


VLX1570
Based on 2 publication(s) in Google Scholar
VLX1570 is a competitive inhibitor of proteasome deubiquitinases (DUBs) with an IC50 of approximate 10 μM.
For research use only. We do not sell to patients.
- Purity: 99.95%
- CAS No.: 1431280-51-1
- Formula: C23H17F2N3O6
- Molecular Weight:469.39
-
Storage:Powder -20°C, 3 years , 4°C, 2 years ; In solvent -80°C, 2 years , -20°C, 1 year

To place orders, for customer services and technical support, please contact: MedChemExpress USA
Tel: 609-228-6898 E-mail: [email protected] [email protected]


-
 Biological Activity
-
Chemical Information
-
Solvent & Solubility
- Protocol
- Purity & Documentation
- References
-
 Help & FAQs
-

Cell Cycle/DNA Damage Compound Library
HY-L004
-
Anti-Cancer Compound Library
HY-L025
-
Clinical Compound Library
HY-L026
-
Peptidomimetic Library
HY-L033
-
Anti-Aging Compound Library
HY-L034
-
Drug Repurposing Compound Library
HY-L035
-
Covalent Screening Library
HY-L036
-
Ubiquitination Compound Library
HY-L050
-
Endoplasmic Reticulum Stress Compound Library
HY-L054
-
Anti-Blood Cancer Compound Library
HY-L079
-
Metabolic Enzyme Compound Library
HY-L146
-
Protease Inhibitor Library
HY-L147
-
Cysteine Targeted Covalent Library
HY-L153
-
Anti-Hematopathy Compound Library
HY-L171
-
Bioactive Compound Library Max
HY-L181
-
Covalent Screening Library Plus
HY-L036P
-
Drug Repurposing Compound Library Plus
HY-L035P
-
Clinical Compound Library Plus
HY-L026P
-
Bioactive Compound Library
HY-L001
-
High-Throughput Bioactive Compound Library
HY-L205
-
Posttranslational Modification Library
HY-L226


Publications Citing Use of MedChemExpress (MCE) VLX1570
More Customer Validation & Images

-
WB


Biological Activity
IC50: appr 10 μM (Deubiquitinase)[2]
|
Cell Line
|
Type | Value | Description | References |
|---|---|---|---|---|
| HCT-116 | EC50 |
0.58 μM
Compound: VLX1570
|
Cytotoxicity in human HCT116 cells assessed as reduction in cell viability incubated for 72 hrs by FMCA analysis
Cytotoxicity in human HCT116 cells assessed as reduction in cell viability incubated for 72 hrs by FMCA analysis
|
[PMID: 31682427] |
| KMS-11 | EC50 |
43 nM
Compound: VLX1570
|
Cytotoxicity in human KMS11 cells assessed as reduction in cell viability incubated for 72 hrs Cell-titer Glo reagent based assay
Cytotoxicity in human KMS11 cells assessed as reduction in cell viability incubated for 72 hrs Cell-titer Glo reagent based assay
|
[PMID: 32109059] |
| U2OS | EC50 |
98 nM
Compound: VLX1570
|
Cytotoxicity in human U2OS cells assessed as reduction in cell viability incubated for 72 hrs Cell-titer Glo reagent based assay
Cytotoxicity in human U2OS cells assessed as reduction in cell viability incubated for 72 hrs Cell-titer Glo reagent based assay
|
[PMID: 32109059] |
VLX1570 inhibits USP14 and UCHL5 activity of 19S regulatory particles, and the inhibition of USP14 is more pronounced. VLX1570 (1 μM) shows inhibitory activity against USP14 in KMS-11 myeloma cells. VLX1570 exhibits an IC50 of 0.58 μM on HCT116 cells[1]. VLX1570 binds to recombinant USP14 with Kd of 1.5-18?μM using two different sources of recombinant protein, and the Kd for recombinant UCHL5 is higher (14-18?μM) compared to that of USP14. VLX1570 has potent antiproliferative activities on multiple myeloma cells, with IC50s of 43?±?2 nM, 74?±?2 nM, 126?±?3 nM, and 191?±?1 nM for KMS-11, RPMI8226, OPM-2, and OPM-2-BZR cells, respectively[2]. VLX1570 suppresses the viability of BCWM.1 cells, with an EC50 of 20.22?nM. VLX1570 (100, 250, 500 nM) induces significant apoptosis by 12?h in a dose-dependent manner in all Waldenstrom macroglobulinemia (WM) cell lines tested, including BCWM.1/IR (IR) and BCWM.1/BR (BR) subclones. VLX1570 (100, 250, 500 nM) also causes ER stress machinery and mitochondrial damage in WM cells. VLX1570 (250?nM) downregulates BCR-signalosome components and their end effectors, as well as CXCR4 expression in WM cells[3].
MedChemExpress (MCE) has not independently confirmed the accuracy of these methods. They are for reference only.
MedChemExpress (MCE) has not independently confirmed the accuracy of these methods. They are for reference only.
| NCT Number | Sponsor | Condition | Start Date |
Phase
|
|---|---|---|---|---|
| NCT01329991 | Plexxikon| | 2011-05 | PHASE1 |


Chemical Information
-
CAS No. 1431280-51-1
-
Appearance Solid
-
Molecular Weight 469.39
-
Formula C23H17F2N3O6
-
Color White to yellow
-
SMILES
O=C1/C(CN(C(C=C)=O)CC/C1=C\C2=CC=C(F)C([N+]([O-])=O)=C2)=C/C3=CC=C(F)C([N+]([O-])=O)=C3
-
Shipping
Room temperature in continental US; may vary elsewhere.
-
Storage
Powder -20°C 3 years 4°C 2 years In solvent -80°C 2 years -20°C 1 year


Publications (2)
-
Journal Impact Factor
-
Most Recent
-
Cell Death Dis
TRIB2 modulates proteasome function to reduce ubiquitin stability and protect liver cancer cells against oxidative stress. [Abstract]2021 Jan 7;12(1):42. PMID: 33414446 -
Mol Cancer Ther
Targeting the Proteasome-Associated Deubiquitinating Enzyme USP14 Impairs Melanoma Cell Survival and Overcomes Resistance to MAPK-Targeting Therapies. [Abstract]2018 Jul;17(7):1416-1429. PMID: 29703842
VLX1570 purchased from MedChemExpress. Usage Cited in: Mol Cancer Ther. 2018 Jul;17(7):1416-1429. [Abstract]
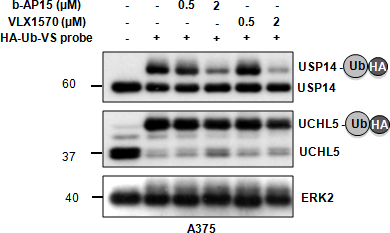
VLX1570 blocks USP14, but not UCHL5, activity in melanoma.


Solvent & Solubility
DMSO : ≥ 32 mg/mL (68.17 mM; Hygroscopic DMSO has a significant impact on the solubility of product, please use newly opened DMSO)
* "≥" means soluble, but saturation unknown.
Please refer to the solubility information to select the appropriate solvent. Once prepared, please aliquot and store the solution to prevent product inactivation from repeated freeze-thaw cycles.
Storage method and period of stock solution: -80°C, 2 years; -20°C, 1 year. When stored at -80°C, please use it within 2 years. When stored at -20°C, please use it within 1 year.
Concentration (start) × Volume (start) = Concentration (final) × Volume (final)

Protocol
Preparations of 26S proteasomes (1 nM) are pretreated with DMSO, VLX1570, or b-AP15 for 2 min in assay buffer (25 mM Tris, 5 mM MgCl2, 10% glycerol, 0.05 mg/mL BSA, 2 mM ATP, and 1 mM DTT) before addition of Ubrhodamine. Fluorescence is monitored at 37°C using Ex/Em = 490 nm/520 nm to read data every 10 second for 30 min using a TECAN infinite 200 instrument. For UbVS labeling of KMS 11 cells, cell pellets are lysed from control or treated cells with buffer (50 mM HEPES pH 7.4, 250 mM sucrose, 10 mM MgCl2, 2 mM ATP, 1 mM DTT) on ice for 30 min and removed debris by centrifugation. Twenty five μg of protein is labeled with 1 μM UbVS for 30 min at 37°C. Samples are resolved by SDS-PAGE and subjected to immunoblotting. For UbVS labeling of proteasomes, purified 19S proteasomes (50 nM) are pretreated with DMSO, VLX1570, or b-AP15 (50 μM) for 10 min at room temperature, followed by labeling with 1 μM HA-UbVS for 30 min at 37°C and by immunoblotting[1].
MedChemExpress (MCE) has not independently confirmed the accuracy of these methods. They are for reference only.
Cell viability is monitored by the MTT (3-(4,5-dimethylthiazol-2-yl)-2,5-diphenyltetrazolium bromide) assay. For the MTT assay, cells are suspended at 5 × 10⁵ cells/mL, and 100 μL aliquots are dispended into 96-well microtiter plates and exposed to drugs using DMSO as control. At the end of incubations, 10 μL of a stock solution of 5 mg/mL MTT (3-(4,5-dimethylthiazol-2-yl)-2,5-diphenyltetrazolium bromide), is added into each well, and the plates are incubated 4 hours at 37°C. Formazan crystals are dissolved with 100 μL of 10% SDS/10 mM HCl solution overnight at 37°C. Since MTT assays are affected by mitochondrial activity, and since OXPHOS is affected by VLX1570, the acid phosphatase method49 are used to determine cell viability in some experiments. After washing twice with PBS, cells are lysed in 100 μL of 0.1 M sodium acetate, 0,1% Triton X-100, p-nitrophenylphosphate and incubated for 90 min at 37°C. At the end of the incubation, 10 μL NaOH is added to each well and A405 is determined[2].
MedChemExpress (MCE) has not independently confirmed the accuracy of these methods. They are for reference only.
Animal experiment is performed with a sample size of 7 per group, 80% power at the 5% significance level to detect a difference in means of 1800 mm3 between the 2 groups. For percentage change in IgM from baseline, with a sample size of 7 per group, 80% power at the 5% significance level is calculated to detect a difference in means of 450% between the 2 groups. Fourteen female NOD/SCID mice (6-8 weeks of age) are subcutaneously implanted with 1× 10⁶ luciferase labeled RPCI-WM1 cells (Luc-RPCI-WM1), which are allowed to grow till a bioluminescent signal is observed by IVIS imaging (Day 20). On day 21, mice are randomized into 2 groups (n=7 each), with one group receiving vehicle (cremaphor+PEG+Tween) and the other receiving VLX1570 at 4.4 mg/kg via intraperitoneal injection. The investigator is not blinded to the group allocation. Both groups are respectively treated with either vehicle or VLX1570 every alternate day for 22 days. Sizes of the tumors is measured every 3- 4 days using direct caliper measurements, and volume of the tumorsis calculated using the formula (width)2 × length/2. Bioluminescent tumor imaging is performed with the Xenogen imaging system on Days 0, 20, 30, 36 and 43 post-tumor implantation. Blood from mice is collected on the same days by submandibular venous puncture, with sera subsequently separated for quantification of human IgM levels’ using ELISA. On Day 44, mice are sacrificed, and final tumor volume is measured in control and treatment arms. All images are obtained using a Canon D40 digital camera. No specific criteria for inclusion/exclusion are used as all mice formed tumors and are therefore included into the study[3].
MedChemExpress (MCE) has not independently confirmed the accuracy of these methods. They are for reference only.


Purity & Documentation
-
Data Sheet (283 KB)
-
SDS (393 KB)
- English - EN (393 KB)
- Français - FR (393 KB)
- Deutsch - DE (393 KB)
- Norwegian - NO (393 KB)
- Español - ES (393 KB)
- Swedish - SV (393 KB)
- Italian - IT (393 KB)
- Korean - KR (393 KB)
- Portuguese - PT (393 KB)
-
Handling Instructions (2659 KB)
References
[1]. Wang X, et al. Synthesis and evaluation of derivatives of the proteasome deubiquitinase inhibitor b-AP15. Chem Biol Drug Des. 2015 Nov;86(5):1036-48. [Content Brief]
[2]. Wang X, et al. The proteasome deubiquitinase inhibitor VLX1570 shows selectivity for ubiquitin-specific protease-14 and induces apoptosis of multiple myeloma cells. Sci Rep. 2016 Jun 6;6:26979. [Content Brief]
[3]. Paulus A, et al. Coinhibition of the deubiquitinating enzymes, USP14 and UCHL5, with VLX1570 is lethal to ibrutinib- or bortezomib-resistant Waldenstrom macroglobulinemia tumor cells. Blood Cancer J. 2016 Nov 4;6(11):e492. [Content Brief]


Complete Stock Solution Preparation Table
Please refer to the solubility information to select the appropriate solvent. Once prepared, please aliquot and store the solution to prevent product inactivation from repeated freeze-thaw cycles.
Storage method and period of stock solution: -80°C, 2 years; -20°C, 1 year. When stored at -80°C, please use it within 2 years. When stored at -20°C, please use it within 1 year.
| Optional Solvent | Concentration Solvent Mass | 1 mg | 5 mg | 10 mg | 25 mg |
|---|---|---|---|---|---|
| DMSO | 1 mM | 2.1304 mL | 10.6521 mL | 21.3042 mL | 53.2606 mL |
| 5 mM | 0.4261 mL | 2.1304 mL | 4.2608 mL | 10.6521 mL | |
| 10 mM | 0.2130 mL | 1.0652 mL | 2.1304 mL | 5.3261 mL | |
| 15 mM | 0.1420 mL | 0.7101 mL | 1.4203 mL | 3.5507 mL | |
| 20 mM | 0.1065 mL | 0.5326 mL | 1.0652 mL | 2.6630 mL | |
| 25 mM | 0.0852 mL | 0.4261 mL | 0.8522 mL | 2.1304 mL | |
| 30 mM | 0.0710 mL | 0.3551 mL | 0.7101 mL | 1.7754 mL | |
| 40 mM | 0.0533 mL | 0.2663 mL | 0.5326 mL | 1.3315 mL | |
| 50 mM | 0.0426 mL | 0.2130 mL | 0.4261 mL | 1.0652 mL | |
| 60 mM | 0.0355 mL | 0.1775 mL | 0.3551 mL | 0.8877 mL |


 Powered by Bioz