


Fructose
Based on 4 publication(s) in Google Scholar
Fructose is a simple ketonic monosaccharide found in many plants, where it is often bonded to glucose to form the disaccharide sucrose.
Nur für Forschungszwecke. Wir verkaufen nicht an Patienten.
- Reinheit: 99.92%
- CAS. Nr.: 7660-25-5
- Formel: C6H12O6
- Molecular Weight:180.16
-
Speicherung:Powder -20°C, 3 years , 4°C, 2 years ; In solvent -80°C, 2 years , -20°C, 1 year

To place orders, for customer services and technical support, please contact: MedChemExpress USA
Tel: 609-228-6898 E-mail: [email protected] [email protected]


-
 Biologische Aktivität
-
Chemical Information
-
Lösungsmittel & Löslichkeit
- Protokoll
- Reinheit & Dokumentation
- Verweise
-
 Help & FAQs
-


Anti-diabetic Compound Library
HY-L040
-
Oxygen Sensing Compound Library
HY-L045
-
Anti-Cardiovascular Disease Compound Library
HY-L046
-
Anti-COVID-19 Compound Library
HY-L052
-
NMPA-Approved Drug Library
HY-L053
-
Medicine Food Homology Compound Library
HY-L055
-
Pyroptosis Compound Library
HY-L059
-
Orally Active Compound Library
HY-L061
-
Glutamine Metabolism Compound Library
HY-L064
-
Traditional Chinese Medicine Active Compound Library
HY-L065
-
FDA Approved & Pharmacopeial Drug Library
HY-L066
-
Animal Disease Model Inducer Library
HY-L097
-
Anti-Cancer Natural Product Library
HY-L107
-
Plant-Sourced Natural Product Library
HY-L115
-
FDA-Approved Anticancer Drug Library
HY-L122
-
Non-steroidal Anti-Inflammatory Compound Library
HY-L130
-
Heterocyclic Compound Library
HY-L138
-
Off-patent Drug Library
HY-L141
-
FDA-Approved Traditional Chinese Medicine Active Compound Library
HY-L163
-
Bioactive Compound Library Max
HY-L181
-
MCE Bioactive Compound Library
HY-L001V
-
Natural Product Library Plus
HY-L021P
-
Drug Repurposing Compound Library Plus
HY-L035P
-
FDA-Approved Drug Library Plus
HY-L022P
-
FDA-Approved Drug Library Mini
HY-L022M
-
Bioactive Compound Library
HY-L001
-
Tibetan Medicine Compound Library
HY-L191
-
Heat-Clearing and Detoxification Traditional Chinese Medicine Compound Library
HY-L194
-
High-Throughput Bioactive Compound Library
HY-L205
-
High-Throughput Natural Product Library
HY-L206
-
Ancient Chinese Classical Formulas Traditional Chinese Medicine Active Compound Library
HY-L209
-
Mouse Metabolite Compound Library
HY-L217
-
Cosmetic Ingredient Compound Library
HY-L221
-
Diarrhea-Related Traditional Chinese Medicine Active Compound Library
HY-L224
-
Mongolian Medicine Compound Library
HY-L238
-
Tonifying Traditional Chinese Medicine Monomer Compound Library
HY-L246
-
Mass Spectrometry Natural Product Library
HY-L262
-
Natural Product and Natural Product-Like Compound Library
HY-L021M
-
Anti-Infection Compound Library
HY-L002
-
Natural Product Library
HY-L021
-
FDA-Approved Drug Library
HY-L022
-
Anti-Cancer Compound Library
HY-L025
-
Anti-Aging Compound Library
HY-L034
-
Drug Repurposing Compound Library
HY-L035


Publications Citing Use of MedChemExpress (MCE) Fructose
More Customer Validation & Images

-
In Vivo Efficacy Study
-
In Vivo Efficacy Study
-
In Vivo Efficacy Study
-
Histological Imaging/Staining
-
WB


Biologische Aktivität
Fructose, at low concentrations do not cause any significant increase of Tissue factor (TF)-mRNA levels. On the contrary, higher Fructose concentrations cause increase in TF mRNA levels at 60 min, as compare to unstimulated cells. Increasing Fructose concentrations causes significant decrease of tPA-mRNA levels. SOD significantly prevents Fructose induced NF-κB activation which is associated with the parallel reduction of Fructose-induced TF expression/activity[1].
MedChemExpress (MCE) has not independently confirmed the accuracy of these methods. They are for reference only.
Please do not refer to only one article to determine the experimental conditions. It is recommended to determine the optimal experimental conditions (animal strain, age, dosage, frequency and cycle, detection time and indicators, etc.) through preliminary experiments before the formal experiment.
Fructose can be used in animal modeling to create rat models of hyperuricemia and diabetes. In mice fed a 0% Fructose diet, portal vein (0.060±0.006 mM, overall average across all time points) and systemic (0.030±0.003 mM) Fructose concentrations do not change over time after feeding. In contrast, in wild-type mice, the portal vein concentration more than doubles from time (t)=0 to t=1 hour post-feeding (~0.13 mM). Similarly, systemic serum Fructose increases from 0.037 at t=0 to 0.13 mM one hour post-feeding. In the 20% group, fasting (t=0) serum Fructose levels in the portal vein and systemically are similar to the postprandial concentrations in 0% mice, suggesting that baseline Fructose concentrations during fasting are not affected by diet. At the same dietary conditions, time, and sampling site, serum Fructose concentrations in KHK-/- mice are 5 to 100 times higher than in wild-type mice. The mean (across all time points) portal vein and systemic glucose concentrations in mice fed 20% Fructose are approximately 3 (P=0.004) and 2 (P=0.04) mM higher, respectively, compared to mice fed 0% Fructose. Systemic Fructose concentrations in KHK-/- mice fed 20% Fructose are about three times higher than in mice fed glucose, whereas systemic Fructose concentrations in wild-type mice fed Fructose are similar to those fed glucose[2].
Administration: 30% Fructose in drinking water • intragastrically • for six weeks
Tissue changes: Infiltration of inflammatory cells in mouse glomeruli[3].
Metabolic changes: Increase serum uric acid, creatinine, blood urea nitrogen levels, reduce urine uric acid and creatinine levels (FEUA is significantly reduced)[3].
Administration: 65% fructose • oral administration • 8 weeks of feeding
MedChemExpress (MCE) has not independently confirmed the accuracy of these methods. They are for reference only.
| NCT Number | Sponsor | Condition | Start Date |
Phase
|
|---|---|---|---|---|
| NCT01329991 | Plexxikon| | 2011-05 | PHASE1 |


Chemical Information
-
CAS. Nr. 7660-25-5
-
Appearance Solid
-
Molecular Weight 180.16
-
Formel C6H12O6
-
Color White to off-white
-
SMILES
O[C@H]1[C@@H](O)[C@H](O)[C@@](O)(CO)OC1
-
Synonyms
beta-D-Fructopyranose
-
Structure Classification
-
Initial Source
-
Versand
Room temperature in continental US; may vary elsewhere.
-
Speicherung
Powder -20°C 3 years 4°C 2 years In solvent -80°C 2 years -20°C 1 year


Publications (4)
-
Journal Impact Factor
-
Most Recent
-
Nature
2025 Jul;643(8070):192-200. PMID: 39695227 -
Eur J Pharmacol
Alisol B blocks the development of HFD-induced obesity by triggering the LKB1-AMPK signaling in subcutaneous adipose tissue. [Abstract]2023 Oct 5:956:175942. PMID: 37536624
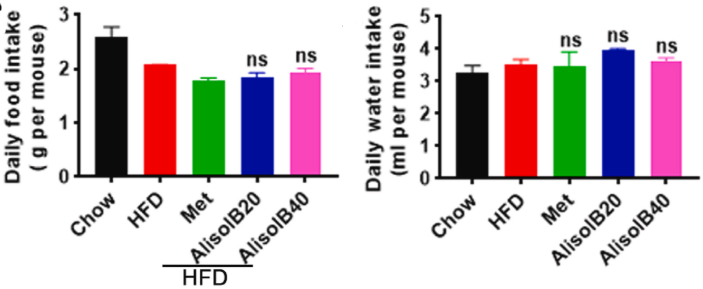
Fructose purchased from MedChemExpress. Usage Cited in: Eur J Pharmacol. 2023 Oct 5:956:175942. [Abstract]
Fructose (HFD, 5% g/v in drinking water, 6 weeks). The average food intake and water intake of mice in different groups.
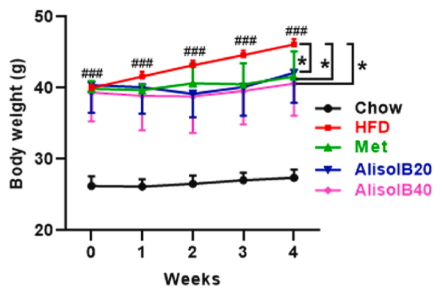
Fructose purchased from MedChemExpress. Usage Cited in: Eur J Pharmacol. 2023 Oct 5:956:175942. [Abstract]
Fructose (HFD, 5% g/v in drinking water, 6 weeks). The total body weight of mice in different groups.
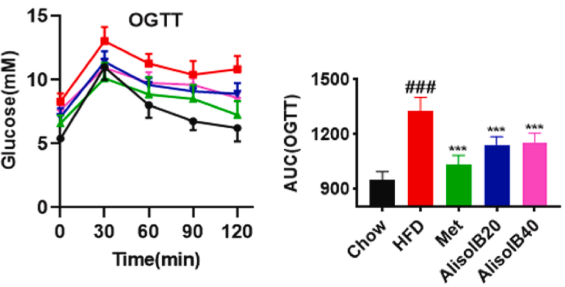
Fructose purchased from MedChemExpress. Usage Cited in: Eur J Pharmacol. 2023 Oct 5:956:175942. [Abstract]
Fructose (HFD, 5% g/v in drinking water, 6 weeks). OGTT in mice after starving overnight and the areas under the glucose curve.
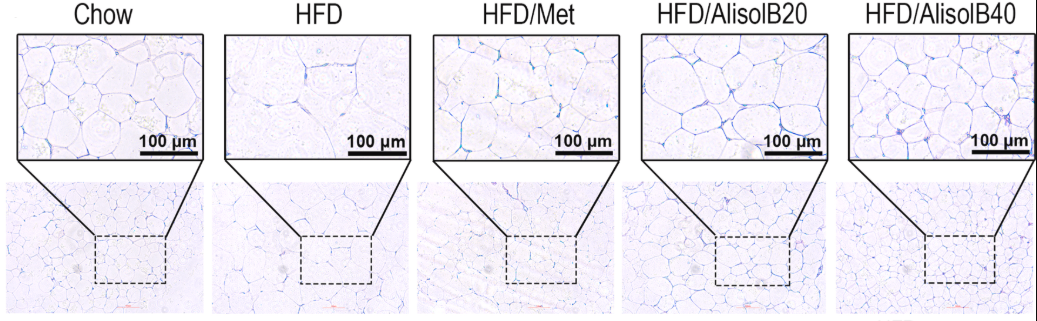
Fructose purchased from MedChemExpress. Usage Cited in: Eur J Pharmacol. 2023 Oct 5:956:175942. [Abstract]
Fructose (HFD, 5% g/v in drinking water, 6 weeks). Representative H&E-stained micrographs of subcutaneous WAT histopathology. Scale bar = 100 μm.
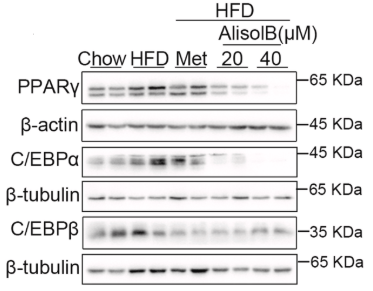
Fructose purchased from MedChemExpress. Usage Cited in: Eur J Pharmacol. 2023 Oct 5:956:175942. [Abstract]
Fructose (HFD, 5% g/v in drinking water, 6 weeks). Expression levels of C/EBPβ, PPARγ and C/EBPα in subcutaneous WAT.
-
Bioorg Chem
Euphorbia factor L3 ameliorates hepatic steatosis by activating LKB1-AMPK signaling pathway-regulated lipid metabolism. [Abstract]2026 Sep 5:179:110008. PMID: 42176359 -


Lösungsmittel & Löslichkeit
H2O : 100 mg/mL (555.06 mM; Need ultrasonic)
DMSO : ≥ 100 mg/mL (555.06 mM; Hygroscopic DMSO has a significant impact on the solubility of product, please use newly opened DMSO)
* "≥" means soluble, but saturation unknown.
Please refer to the solubility information to select the appropriate solvent. Once prepared, please aliquot and store the solution to prevent product inactivation from repeated freeze-thaw cycles.
Storage method and period of stock solution: -80°C, 2 years; -20°C, 1 year. When stored at -80°C, please use it within 2 years. When stored at -20°C, please use it within 1 year.
* Note: If you choose water as the stock solution, please dilute it to the working solution, then filter and sterilize it with a 0.22 μm filter before use.
Konzentration (Stammlösung) × Volumen (Stammlösung) = Konzentration (Ziellösung) × Volumen (Ziellösung)
Select the appropriate dissolution method based on your experimental animal and administration route.
- For the following dissolution methods, please ensure to first prepare a clear stock solution using an In Vitro approach and then sequentially add co-solvents:
- To ensure reliable experimental results, the clarified stock solution can be appropriately stored based on storage conditions. As for the working solution for In Vivo experiments, it is recommended to prepare freshly and use it on the same day.
- The percentages shown for the solvents indicate their volumetric ratio in the final prepared solution. If precipitation or phase separation occurs during preparation, heat and/or sonication can be used to aid dissolution.
Add each solvent one by one: 10% DMSO 40% PEG300 5% Tween-80 45% Saline
Solubility: ≥ 2.5 mg/mL (13.88 mM); Clear solution
This protocol yields a clear solution of ≥ 2.5 mg/mL (saturation unknown).
Taking 1 mL working solution as an example, add 100 μL DMSO stock solution (25.0 mg/mL) to 400 μL PEG300, and mix evenly; then add 50 μL Tween-80 and mix evenly; then add 450 μL Saline to adjust the volume to 1 mL.
Preparation of Saline: Dissolve 0.9 g sodium chloride in ddH₂O and dilute to 100 mL to obtain a clear Saline solution.
Add each solvent one by one: 10% DMSO 90% (20% SBE-β-CD in Saline)
Solubility: ≥ 2.5 mg/mL (13.88 mM); Clear solution
This protocol yields a clear solution of ≥ 2.5 mg/mL (saturation unknown).
Taking 1 mL working solution as an example, add 100 μL DMSO stock solution (25.0 mg/mL) to 900 μL 20% SBE-β-CD in Saline, and mix evenly.
Preparation of 20% SBE-β-CD in Saline (4°C, storage for one week): 2 g SBE-β-CD powder is dissolved in 10 mL Saline, completely dissolve until clear.
For the following dissolution methods, please prepare the working solution directly:
It is recommended to prepare fresh solutions and use them promptly within a short period of time.
The percentages shown for the solvents indicate their volumetric ratio in the final prepared solution. If precipitation or phase separation occurs during preparation, heat and/or sonication can be used to aid dissolution.
Add each solvent one by one: PBS
Solubility: 100 mg/mL (555.06 mM); Clear solution; Need ultrasonic
Please enter the basic information of animal experiments:
-
-
-
-
Recommended: Prepare an additional quantity of animals to account for potential losses during experiments.
Working solution concentration: 0.22 mg/mL
This product has good water solubility, please refer to the measured solubility data in water/PBS/Saline for details.

Protokoll
HUVECs are incubated with Fructose (0.25, 1 and 2.5 mM) for 30 min. Then, cells are washed with PBS and then fresh medium is added. Total mRNA is extracted by cell cultures using TRIzol reagent, at baseline and 60 min after Fructose stimulation and Tissue factor (TF) mRNA levels are examined by realtime reverse transcription (RT) and polymerase chain reaction (PCR). In positive control experiments, HUVECs are incubated with LPS (50 μg/mL), for 30 min and then mRNA is extracted at 60 min[1].
MedChemExpress (MCE) has not independently confirmed the accuracy of these methods. They are for reference only.
50 young adult (7-wk-old) male C57BL6 wild-type mice (~18 g) are divided into 10 cages and acclimatized to a reversed light cycle. Mice are fed a nonpurified commercial diet ad libitum for the first 4 days. On the 5th day and then throughout the experiment, diets are removed at 2001 (lights on) and returned at 0801 (lights off). For days 8 to 14, diets are switched to pellets containing either 0% Fructose, 10% sucrose, 20% glucose (termed as "0% Fructose") or 20% Fructose, 10% sucrose, or 0% glucose (20% Fructose). On the 15th day, mice are killed at 0800 before feeding and 0900, 1030, 1200, and 1530 during the dark phase, with n=5 for each time point and diet[2].
MedChemExpress (MCE) has not independently confirmed the accuracy of these methods. They are for reference only.


Reinheit & Dokumentation
-
Data Sheet (289 KB)
-
SDS (396 KB)
- English - EN (396 KB)
- Français - FR (396 KB)
- Deutsch - DE (396 KB)
- Norwegian - NO (396 KB)
- Español - ES (396 KB)
- Swedish - SV (396 KB)
- Italian - IT (396 KB)
- Korean - KR (396 KB)
- Portuguese - PT (396 KB)
-
Handling Instructions (2659 KB)
Verweise
[1]. Cirillo P, et al. Fructose induces prothrombotic phenotype in human endothelial cells : A new role for "added sugar" in cardio-metabolic risk. J Thromb Thrombolysis. 2015 Nov;40(4):444-51. [Content Brief]
[2]. Patel C, et al. Effect of dietary fructose on portal and systemic serum fructose levels in rats and in KHK-/- and GLUT5-/- mice. Am J Physiol Gastrointest Liver Physiol. 2015 Nov 1;309(9):G779-90. [Content Brief]
[3]. Ying Yang, et al. Wuling San protects kidney dysfunction by inhibiting renal TLR4/MyD88 signaling and NLRP3 inflammasome activation in high fructose-induced hyperuricemic mice. J Ethnopharmacol. 2015 Jul 1:169:49-59. [Content Brief]
[4]. Raju Padiya, et al. Garlic improves insulin sensitivity and associated metabolic syndromes in fructose fed rats. Nutr Metab (Lond). 2011 Jul 27:8:53. [Content Brief]


Complete Stock Solution Preparation Table
Please refer to the solubility information to select the appropriate solvent. Once prepared, please aliquot and store the solution to prevent product inactivation from repeated freeze-thaw cycles.
Storage method and period of stock solution: -80°C, 2 years; -20°C, 1 year. When stored at -80°C, please use it within 2 years. When stored at -20°C, please use it within 1 year.
| Optional Solvent | Concentration Solvent Mass | 1 mg | 5 mg | 10 mg | 25 mg |
|---|---|---|---|---|---|
| H2O / DMSO | 1 mM | 5.5506 mL | 27.7531 mL | 55.5062 mL | 138.7655 mL |
| 5 mM | 1.1101 mL | 5.5506 mL | 11.1012 mL | 27.7531 mL | |
| 10 mM | 0.5551 mL | 2.7753 mL | 5.5506 mL | 13.8766 mL | |
| 15 mM | 0.3700 mL | 1.8502 mL | 3.7004 mL | 9.2510 mL | |
| 20 mM | 0.2775 mL | 1.3877 mL | 2.7753 mL | 6.9383 mL | |
| 25 mM | 0.2220 mL | 1.1101 mL | 2.2202 mL | 5.5506 mL | |
| 30 mM | 0.1850 mL | 0.9251 mL | 1.8502 mL | 4.6255 mL | |
| 40 mM | 0.1388 mL | 0.6938 mL | 1.3877 mL | 3.4691 mL | |
| 50 mM | 0.1110 mL | 0.5551 mL | 1.1101 mL | 2.7753 mL | |
| 60 mM | 0.0925 mL | 0.4626 mL | 0.9251 mL | 2.3128 mL | |
| 80 mM | 0.0694 mL | 0.3469 mL | 0.6938 mL | 1.7346 mL | |
| 100 mM | 0.0555 mL | 0.2775 mL | 0.5551 mL | 1.3877 mL |
* Note: If you choose water as the stock solution, please dilute it to the working solution, then filter and sterilize it with a 0.22 μm filter before use.


 Powered by Bioz