


Linsitinib
Based on 51 publication(s) in Google Scholar
Linsitinib (OSI-906) is a potent, selective and orally bioavailable dual inhibitor of the IGF-1 receptor and insulin receptor (IR) with IC50s of 35 and 75 nM, respectively.
Nos produits utilisent uniquement pour la recherche. Nous ne vendons pas aux patients.
- Pureté: 99.90%
- CAS No.: 867160-71-2
- Formule: C26H23N5O
- Masse moléculaire:421.49
-
Stockage:Powder -20°C, 3 years , 4°C, 2 years ; In solvent -80°C, 2 years , -20°C, 1 year

To place orders, for customer services and technical support, please contact: MedChemExpress USA
Tel: 609-228-6898 E-mail: [email protected] [email protected]


-
 Activité biologique
-
Chemical Information
-
Solvant et solubilité
- Protocole
- Pureté et documentation
- Références
-
 Help & FAQs
-


Differentiation Inducing Compound Library
HY-L038
-
Anti-diabetic Compound Library
HY-L040
-
Endocrinology Compound Library
HY-L047
-
Anti-COVID-19 Compound Library
HY-L052
-
Orally Active Compound Library
HY-L061
-
Chemical Probe Library
HY-L063
-
Anti-Lung Cancer Compound Library
HY-L075
-
Anti-Pancreatic Cancer Compound Library
HY-L077
-
Angiogenesis-Related Compound Library
HY-L088
-
Rare Diseases Drug Library
HY-L102
-
Human Metabolite Library
HY-L123
-
Anti-Prostate Cancer Compound Library
HY-L124
-
Heterocyclic Compound Library
HY-L138
-
Metabolic Enzyme Compound Library
HY-L146
-
Membrane Protein-targeted Compound Library
HY-L149
-
Membrane Receptor-targeted Compound Library
HY-L150
-
Highly Selective Inhibitors Library
HY-L158
-
Cytokine Inhibitors Library
HY-L161
-
Multi-Target Compound Library
HY-L176
-
Bioactive Compound Library Max
HY-L181
-
Kinase Inhibitor Library Mini
HY-L009M
-
MCE Bioactive Compound Library
HY-L001V
-
Drug Repurposing Compound Library Plus
HY-L035P
-
Clinical Compound Library Plus
HY-L026P
-
Bioactive Compound Library
HY-L001
-
Anti-Brain Cancer Compound Library
HY-L188
-
Protein Kinase Compound Library
HY-L196
-
High-Throughput Bioactive Compound Library
HY-L205
-
Mass Spectrometry Human Metabolite Library
HY-L215
-
Posttranslational Modification Library
HY-L226
-
Anti-Aging Compound Library Mini
HY-L034M
-
Kinase Inhibitor Library
HY-L009
-
Protein Tyrosine Kinase Compound Library
HY-L016
-
Anti-Cancer Compound Library
HY-L025
-
Clinical Compound Library
HY-L026
-
Anti-Aging Compound Library
HY-L034
-
Drug Repurposing Compound Library
HY-L035


Publications Citing Use of MedChemExpress (MCE) Linsitinib
More- Nature. 2024 Sep;633(8031):895-904. [Abstract]
- Cancer Cell. 2024 Jun 10;42(6):1067-1085.e11. [Abstract]
- Cell. 2024 Nov 14;187(23):6566-6583.e22. [Abstract]
- Nat Nanotechnol. 2021 Jul;16(7):830-839. [Abstract]
- Cell Metab. 2017 Apr 4;25(4):868-882.e5. [Abstract]
- Cancer Res. 2025 Feb 1;85(3):442-461. [Abstract]
- Nat Commun. 2026 Feb 12;17(1):1214. [Abstract]
- Nat Commun. 2021 Jul 16;12(1):4360. [Abstract]
- Nat Commun. 2021 Apr 16;12(1):2288. [Abstract]
- Sci Transl Med. 2018 Jul 18;10(450):eaaq1093. [Abstract]
- J Exp Clin Cancer Res. 2024 Jul 29;43(1):211. [Abstract]
- Adv Sci (Weinh). 2025 Jan;12(2):e2407662. [Abstract]
- Cell Death Dis. 2026 Mar 26;17(1):381. [Abstract]
- Pharmacol Res. 2019 Jun:144:292-305. [Abstract]
- J Immunother Cancer. 2021 Jun;9(6):e002722. [Abstract]
- J Pharm Anal. 2023 Aug;13(8):862-879. [Abstract]
- Diabetologia. 2020 Mar;63(3):577-587. [Abstract]
- J Transl Med. 2025 Jun 17;23(1):660. [Abstract]
- J Transl Med. 2022 Jun 7;20(1):263. [Abstract]
- Dev Cell. 2025 Sep 29:S1534-5807(25)00539-8. [Abstract]
- Oncogene. 2023 Jan;42(1):11-25. [Abstract]
- NPJ Breast Cancer. 2022 Nov 29;8(1):125. [Abstract]
- Cell Rep. 2022 Oct 4;41(1):111436. [Abstract]
- Curr Res Food Sci. 2022 Sep 27;5:1685-1700. [Abstract]
- Cell Syst. 2019 Jul 24;9(1):35-48.e5. [Abstract]
- Int J Oncol. 2017 Aug;51(2):625-632. [Abstract]
- Mol Neurobiol. 2025 Jun;62(6):8065-8083. [Abstract]
- Cancer Sci. 2018 Apr;109(4):944-955. [Abstract]
- Sci Rep. 2017 Jun 23;7(1):4119. [Abstract]
- iScience. 2024 Oct 28;27(12):111256. [Abstract]
- Biomed Environ Sci. 2022 Nov 20;35(11):981-991. [Abstract]
- ACS Infect Dis. 2022 Oct 14;8(10):2019-2027. [Abstract]
- Insect Biochem Mol Biol. 2025 May:180:104305. [Abstract]
- FASEB J. 2024 Jan;38(1):e23355. [Abstract]
- Proteomes. 2023 Jun 2;11(2):20. [Abstract]
- FEBS J. 2024 Dec;291(24):5435-5454. [Abstract]
- BMC Cancer. 2017 Dec 5;17(1):820. [Abstract]
- J Cell Physiol. 2021 Sep;236(9):6559-6570. [Abstract]
- Endocrinology. 2017 Dec 1;158(12):4152-4164. [Abstract]
- Endocrinology. 2014 Jun;155(6):2102-11. [Abstract]
- Exp Cell Res. 2024 Oct 1;442(2):114229. [Abstract]
- Exp Cell Res. 2020 Nov 1;396(1):112237. [Abstract]
- J Cancer. 2021 Jul 3;12(17):5310-5319. [Abstract]
- Exp Eye Res. 2025 Jan:250:110158. [Abstract]
- PLoS One. 2024 Nov 1;19(11):e0308647. [Abstract]
- bioRxiv. 2025 Nov 20.
- SSRN. 2025 May 9.
- Res Sq. 2023 Jan 10:rs.3.rs-2320717. [Abstract]
- Research Square Print. November 22nd, 2022
- Universidade de São Paulo. 2021, Jun.
- Okayama University. 2015.
 Customer Validation & Images

-
WB
-
WB
-
WB
-
WB
-
WB


Activité biologique
IC50: 35 nM (IGF-1R), 75 nM (InsR)[1]
|
Cell Line
|
Type | Value | Description | References |
|---|---|---|---|---|
| A-431 | IC50 |
18 nM
Compound: OSI-906
|
Inhibition of IGF1R intracellular phosphorylation in human A431 cells by ELISA
Inhibition of IGF1R intracellular phosphorylation in human A431 cells by ELISA
|
[PMID: 20346655] |
| A-431 | IC50 |
>10000 nM
Compound: OSI-906
|
Inhibition of EGFR intracellular phosphorylation in human A431 cells by ELISA
Inhibition of EGFR intracellular phosphorylation in human A431 cells by ELISA
|
[PMID: 20346655] |
| A673 | IC50 |
0.153 μM
Compound: Chemical probe: OSI-906
|
Antiproliferative activity against human A673 cells assessed as inhibition of cell growth measured after 3 days by celltitre glo luciferase based cellular ATP assay
Antiproliferative activity against human A673 cells assessed as inhibition of cell growth measured after 3 days by celltitre glo luciferase based cellular ATP assay
|
[PMID: 21425998] |
| BaF3 | IC50 |
126 nM
Compound: Linsitinib
|
Inhibition of full length insulin receptor (unknown origin) transfected in Ba/F3 cells assessed as cell proliferation
Inhibition of full length insulin receptor (unknown origin) transfected in Ba/F3 cells assessed as cell proliferation
|
[PMID: 26951753] |
| BaF3 | IC50 |
7.6 nM
Compound: Linsitinib
|
Inhibition of full length IGF-1 receptor (unknown origin) transfected in Ba/F3 cells assessed as cell proliferation
Inhibition of full length IGF-1 receptor (unknown origin) transfected in Ba/F3 cells assessed as cell proliferation
|
[PMID: 26951753] |
| BXPC-3 | IC50 |
0.15 μM
Compound: Chemical probe: OSI-906
|
Antiproliferative activity against human BXPC-3 cells assessed as inhibition of cell growth measured after 3 days by celltitre glo luciferase based cellular ATP assay
Antiproliferative activity against human BXPC-3 cells assessed as inhibition of cell growth measured after 3 days by celltitre glo luciferase based cellular ATP assay
|
[PMID: 21425998] |
| COLO 205 | IC50 |
0.32 μM
Compound: Chemical probe: OSI-906
|
Antiproliferative activity against human COLO 205 cells assessed as inhibition of cell growth measured after 3 days by celltitre glo luciferase based cellular ATP assay
Antiproliferative activity against human COLO 205 cells assessed as inhibition of cell growth measured after 3 days by celltitre glo luciferase based cellular ATP assay
|
[PMID: 21425998] |
| DU-4475 | IC50 |
0.086 μM
Compound: Chemical probe: OSI-906
|
Antiproliferative activity against human DU-4475 cells assessed as inhibition of cell growth measured after 3 days by celltitre glo luciferase based cellular ATP assay
Antiproliferative activity against human DU-4475 cells assessed as inhibition of cell growth measured after 3 days by celltitre glo luciferase based cellular ATP assay
|
[PMID: 21425998] |
| HEK293 | IC50 |
16 nM
Compound: Linsitinib
|
Inhibition of full length insulin receptor (unknown origin) autophosphorylation transfected in HEK293 cells pretreated for 60 mins followed by IGF-1 stimulation measured after 10 mins by quantitative Western blot analysis
Inhibition of full length insulin receptor (unknown origin) autophosphorylation transfected in HEK293 cells pretreated for 60 mins followed by IGF-1 stimulation measured after 10 mins by quantitative Western blot analysis
|
[PMID: 26951753] |
| HEK293 | IC50 |
2.8 nM
Compound: Linsitinib
|
Inhibition of full length IGF-1 receptor (unknown origin) autophosphorylation transfected in HEK293 cells pretreated for 60 mins followed by IGF-1 stimulation measured after 10 mins by quantitative Western blot analysis
Inhibition of full length IGF-1 receptor (unknown origin) autophosphorylation transfected in HEK293 cells pretreated for 60 mins followed by IGF-1 stimulation measured after 10 mins by quantitative Western blot analysis
|
[PMID: 26951753] |
| HT-29 | IC50 |
0.21 μM
Compound: Chemical probe: OSI-906
|
Antiproliferative activity against mouse HT-29 cells assessed as inhibition of cell growth measured after 3 days by celltitre glo luciferase based cellular ATP assay
Antiproliferative activity against mouse HT-29 cells assessed as inhibition of cell growth measured after 3 days by celltitre glo luciferase based cellular ATP assay
|
[PMID: 21425998] |
| MCF7 | IC50 |
0.177 μM
Compound: Chemical probe: OSI-906
|
Antiproliferative activity against human MCF7 cells assessed as inhibition of cell growth measured after 3 days by celltitre glo luciferase based cellular ATP assay
Antiproliferative activity against human MCF7 cells assessed as inhibition of cell growth measured after 3 days by celltitre glo luciferase based cellular ATP assay
|
[PMID: 21425998] |
| NCI-H1703 | IC50 |
>10 μM
Compound: Chemical probe: OSI-906
|
Antiproliferative activity against human H1703 cells assessed as inhibition of cell growth measured after 3 days by celltitre glo luciferase based cellular ATP assay
Antiproliferative activity against human H1703 cells assessed as inhibition of cell growth measured after 3 days by celltitre glo luciferase based cellular ATP assay
|
[PMID: 21425998] |
| NCI-H292 | IC50 |
0.78 μM
Compound: Chemical probe: OSI-906
|
Antiproliferative activity against human H292 cells assessed as inhibition of cell growth measured after 3 days by celltitre glo luciferase based cellular ATP assay
Antiproliferative activity against human H292 cells assessed as inhibition of cell growth measured after 3 days by celltitre glo luciferase based cellular ATP assay
|
[PMID: 21425998] |
| NCI-H358 | IC50 |
0.81 μM
Compound: Chemical probe: OSI-906
|
Antiproliferative activity against human H358 cells assessed as inhibition of cell growth measured after 3 days by celltitre glo luciferase based cellular ATP assay
Antiproliferative activity against human H358 cells assessed as inhibition of cell growth measured after 3 days by celltitre glo luciferase based cellular ATP assay
|
[PMID: 21425998] |
| NCI-N87 | IC50 |
>10000 nM
Compound: OSI-906
|
Inhibition of ErbB2 intracellular phosphorylation in human N87 cells by ELISA
Inhibition of ErbB2 intracellular phosphorylation in human N87 cells by ELISA
|
[PMID: 20346655] |
| NIH3T3 | IC50 |
24 nM
Compound: OSI-906
|
Inhibition of human IGF1R expressed in mouse 3T3 cells by ELISA based assay
Inhibition of human IGF1R expressed in mouse 3T3 cells by ELISA based assay
|
[PMID: 21251824] |
| NIH3T3 | IC50 |
0.06 μM
Compound: Chemical probe: OSI-906
|
Effect on mouse 3T3 cells assessed as inhibition of 70s6k phosphorylation treated at 2 hrs followed by IGF1 ligand addition for 15 mins by ELISA analysis
Effect on mouse 3T3 cells assessed as inhibition of 70s6k phosphorylation treated at 2 hrs followed by IGF1 ligand addition for 15 mins by ELISA analysis
|
[PMID: 21425998] |
| NIH3T3 | IC50 |
0.078 μM
Compound: Chemical probe: OSI-906
|
Antiproliferative activity against mouse 3T3 cells expressing human IGF-1R assessed as inhibition of cell growth measured after 3 days by celltitre glo luciferase based cellular ATP assay
Antiproliferative activity against mouse 3T3 cells expressing human IGF-1R assessed as inhibition of cell growth measured after 3 days by celltitre glo luciferase based cellular ATP assay
|
[PMID: 21425998] |
| NIH3T3 | IC50 |
1.28 μM
Compound: Chemical probe: OSI-906
|
Invivo inhibition of human IGF-1R in athymic nu/nu CD-1 mouse allografted with mouse 3T3 cells expressing human IGF-1R at 75 mg/kg, po measured after 4 to 24 hrs relative to control
Invivo inhibition of human IGF-1R in athymic nu/nu CD-1 mouse allografted with mouse 3T3 cells expressing human IGF-1R at 75 mg/kg, po measured after 4 to 24 hrs relative to control
|
[PMID: 21425998] |
| NIH3T3 | IC50 |
24 nM
Compound: OSI-906
|
Inhibition of full length human IGF-1R overexpressed in mouse NIH 3T3 cells assessed as IGF1-induced protein phosphorylation incubated for 2 hrs prior to IGF1 induction measured after 15 mins by ELISA
Inhibition of full length human IGF-1R overexpressed in mouse NIH 3T3 cells assessed as IGF1-induced protein phosphorylation incubated for 2 hrs prior to IGF1 induction measured after 15 mins by ELISA
|
[PMID: 24900721] |
| RKO | IC50 |
>10 μM
Compound: Chemical probe: OSI-906
|
Antiproliferative activity against human RKO cells assessed as inhibition of cell growth measured after 3 days by celltitre glo luciferase based cellular ATP assay
Antiproliferative activity against human RKO cells assessed as inhibition of cell growth measured after 3 days by celltitre glo luciferase based cellular ATP assay
|
[PMID: 21425998] |
| SW-620 | IC50 |
0.021 μM
Compound: Chemical probe: OSI-906
|
Antiproliferative activity against human SW620 cells assessed as inhibition of cell growth measured after 3 days by celltitre glo luciferase based cellular ATP assay
Antiproliferative activity against human SW620 cells assessed as inhibition of cell growth measured after 3 days by celltitre glo luciferase based cellular ATP assay
|
[PMID: 21425998] |
Linsitinib inhibits IGF-1R autophosphorylation and activation of the downstream signaling proteins Akt, ERK1/2 and S6 kinase with IC50 of 0.028 to 0.13 μM. Linsitinib enables an intermediate conformation of the target protein through interactions with the C-helix. Linsitinib displays favorable metabolic stability in liver microsomes. Linsitinib fully inhibits both IR and IGF-1R phosphorylation at a concentration of 1 μM. Linsitinib inhibits proliferation of several tumor cell lines including non-small-cell lung cancer and colorectal cancer (CRC) tumor cell line with EC50 of 0.021 to 0.810 μM[1].
MedChemExpress (MCE) has not independently confirmed the accuracy of these methods. They are for reference only.
MedChemExpress (MCE) has not independently confirmed the accuracy of these methods. They are for reference only.
| NCT Number | Sponsor | Condition | Start Date |
Phase
|
|---|---|---|---|---|
| NCT01329991 | Plexxikon| | 2011-05 | PHASE1 |


Chemical Information
-
CAS No. 867160-71-2
-
Appearance Solid
-
Masse moléculaire 421.49
-
Formule C26H23N5O
-
Color White to yellow
-
SMILES
O[C@@]1(C)C[C@@H](C2=NC(C3=CC=C4C=CC(C5=CC=CC=C5)=NC4=C3)=C6C(N)=NC=CN62)C1
-
Synonyms
OSI-906
-
Livraison
Room temperature in continental US; may vary elsewhere.
-
Stockage
Powder -20°C 3 years 4°C 2 years In solvent -80°C 2 years -20°C 1 year


Publications (51)
-
Journal Impact Factor
-
Most Recent
-
Nature
2024 Sep;633(8031):895-904. PMID: 39169180 -
Cancer Cell
Integrative molecular and spatial analysis reveals evolutionary dynamics and tumor-immune interplay of in situ and invasive acral melanoma. [Abstract]2024 Jun 10;42(6):1067-1085.e11. PMID: 38759655 -
Cell
2024 Nov 14;187(23):6566-6583.e22. PMID: 39332412 -
Nat Nanotechnol
Therapeutically reprogrammed nutrient signalling enhances nanoparticulate albumin bound drug uptake and efficacy in KRAS-mutant cancer. [Abstract]2021 Jul;16(7):830-839. PMID: 33958764 -
Cell Metab
Insulin Signaling Regulates the FoxM1/PLK1/CENP-A Pathway to Promote Adaptive Pancreatic β Cell Proliferation. [Abstract]2017 Apr 4;25(4):868-882.e5. PMID: 28286049
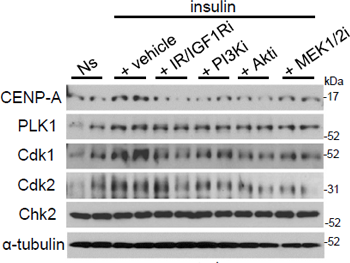
Linsitinib purchased from MedChemExpress. Usage Cited in: Cell Metab. 2017 Apr 4;25(4):868-882.e5. [Abstract]
Western blot of indicated proteins in control β cells in the presence of 10 nM Insulin, 200 nM OSI-906 (IR/IGF1Ri), 50μM LY294002 (PI3Ki), 5μM MK-2206 (Akti), or 20μM U0126 (MEKi) for 24 hr. Bottom: intensity of the signals quantified by densitometry.
-
Cancer Res
Mutant PP2A Induces IGFBP2 Secretion to Promote Development of High-Grade Uterine Cancer. [Abstract]2025 Feb 1;85(3):442-461. PMID: 39531506 -
Nat Commun
Human iPSC-based Modeling of Pulmonary Fibrosis Reveals p300/CBP Inhibition Suppresses Alveolar Transitional Cell State. [Abstract]2026 Feb 12;17(1):1214. PMID: 41680175 -
Nat Commun
Glucocorticoid receptor triggers a reversible drug-tolerant dormancy state with acquired therapeutic vulnerabilities in lung cancer. [Abstract]2021 Jul 16;12(1):4360. PMID: 34272384 -
Nat Commun
Hypothalamic Rax+ tanycytes contribute to tissue repair and tumorigenesis upon oncogene activation in mice. [Abstract]2021 Apr 16;12(1):2288. PMID: 33863883 -
Sci Transl Med
PP2A inhibition is a druggable MEK inhibitor resistance mechanism in KRAS-mutant lung cancer cells. [Abstract]2018 Jul 18;10(450):eaaq1093. PMID: 30021885 -
J Exp Clin Cancer Res
IGF1R signaling induces epithelial-mesenchymal plasticity via ITGAV in cutaneous carcinoma. [Abstract]2024 Jul 29;43(1):211. PMID: 39075581 -
Adv Sci (Weinh)
Osteoblast-Derived ECM1 Promotes Anti-Androgen Resistance in Bone Metastatic Prostate Cancer. [Abstract]2025 Jan;12(2):e2407662. PMID: 39563492 -
Cell Death Dis
Generation of proliferative hESC-derived grape-clustered hepatocyte organoids with multipolar architecture as regenerative counterpart via synergy of YAP and IGF2 pathways. [Abstract]2026 Mar 26;17(1):381. PMID: 41888105 -
Pharmacol Res
2019 Jun:144:292-305. PMID: 31048033 -
J Immunother Cancer
IGF1 receptor inhibition amplifies the effects of cancer drugs by autophagy and immune-dependent mechanisms. [Abstract]2021 Jun;9(6):e002722. PMID: 34127545 -
J Pharm Anal
Temporal dynamics of microglia-astrocyte interaction in neuroprotective glial scar formation after intracerebral hemorrhage. [Abstract]2023 Aug;13(8):862-879. PMID: 37719195 -
Diabetologia
Luseogliflozin increases beta cell proliferation through humoral factors that activate an insulin receptor- and IGF-1 receptor-independent pathway. [Abstract]2020 Mar;63(3):577-587. PMID: 31897526 -
J Transl Med
Interleukin-1β mediates a tumor-supporting environment prompted by IGF1 in triple-negative breast cancer (TNBC). [Abstract]2025 Jun 17;23(1):660. PMID: 40528195 -
J Transl Med
Metformin counteracts stimulatory effects induced by insulin in primary breast cancer cells. [Abstract]2022 Jun 7;20(1):263. PMID: 35672854 -
Dev Cell
2025 Sep 29:S1534-5807(25)00539-8. PMID: 41027427 -
Oncogene
Therapeutic targeting the oncogenic driver EWSR1::FLI1 in Ewing sarcoma through inhibition of the FACT complex. [Abstract]2023 Jan;42(1):11-25. PMID: 36357572 -
NPJ Breast Cancer
Elacestrant demonstrates strong anti-estrogenic activity in PDX models of estrogen-receptor positive endocrine-resistant and fulvestrant-resistant breast cancer. [Abstract]2022 Nov 29;8(1):125. PMID: 36446866 -
Cell Rep
E2F1 transcription factor mediates a link between fat and islets to promote β cell proliferation in response to acute insulin resistance. [Abstract]2022 Oct 4;41(1):111436. PMID: 36198264 -
Curr Res Food Sci
Potential role of gut microbiota-LCA-INSR axis in high fat-diet-induced non-alcoholic fatty liver dysfunction: From perspective of radiation variation. [Abstract]2022 Sep 27;5:1685-1700. PMID: 36204709 -
Cell Syst
A Multi-center Study on the Reproducibility of Drug-Response Assays in Mammalian Cell Lines. [Abstract]2019 Jul 24;9(1):35-48.e5. PMID: 31302153 -
Int J Oncol
2017 Aug;51(2):625-632. PMID: 28656278 -
Mol Neurobiol
IGF1R/ARRB1 Mediated Regulation of ERK and cAMP Pathways in Response to Aβ Unfolds Novel Therapeutic Avenue in Alzheimer's Disease. [Abstract]2025 Jun;62(6):8065-8083. PMID: 39969678 -
Cancer Sci
Reverse of non-small cell lung cancer drug resistance induced by cancer-associated fibroblasts via a paracrine pathway. [Abstract]2018 Apr;109(4):944-955. PMID: 29383798 -
Sci Rep
Metabolic recovery of lipodystrophy, liver steatosis, and pancreatic β cell proliferation after the withdrawal of OSI-906. [Abstract]2017 Jun 23;7(1):4119. PMID: 28646158
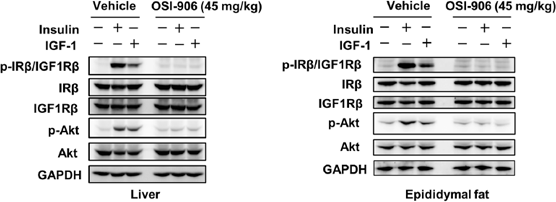
Linsitinib purchased from MedChemExpress. Usage Cited in: Sci Rep. 2017 Jun 23;7(1):4119. [Abstract]
Transient hyperglycemia accompanied by ephemeral hyperinsulinemia induced by IR and IGF1R inhibition with OSI-906. C57BL/6J mice are subjected to a 16-hour fast and OSI-906 (45 mg/kg) or a vehicle (Solutol HS-15) is administered orally 1 hour before injection with either saline, 10 units of insulin, or 1 mg/kg of IGF-1 via the inferior vena cava. The liver and epididymal fat are collected 70 and 120 seconds after injection, respectively.
-
iScience
Dietary or pharmacological inhibition of insulin-like growth factor-1 protects from renal ischemia-reperfusion injury in mice. [Abstract]2024 Oct 28;27(12):111256. PMID: 39759002 -
Biomed Environ Sci
2022 Nov 20;35(11):981-991. PMID: 36443251 -
ACS Infect Dis
Human Kinase IGF1R/IR Inhibitor Linsitinib Controls the In Vitro and Intracellular Growth of Mycobacterium tuberculosis. [Abstract]2022 Oct 14;8(10):2019-2027. PMID: 36048501 -
Insect Biochem Mol Biol
The role of insulin receptor InR in photoperiod-regulated reproductive diapause of Chrysoperla nipponensis. [Abstract]2025 May:180:104305. PMID: 40158640 -
FASEB J
Biochemical characterization of the Drosophila insulin receptor kinase and longevity-associated mutants. [Abstract]2024 Jan;38(1):e23355. PMID: 38071609 -
Proteomes
Mass Spectrometry and Pharmacological Approaches to Measuring Cooption and Reciprocal Activation of Receptor Tyrosine Kinases. [Abstract]2023 Jun 2;11(2):20. PMID: 37368466 -
FEBS J
2024 Dec;291(24):5435-5454. PMID: 39428852 -
BMC Cancer
Insulin-like growth factor receptor and sphingosine kinase are prognostic and therapeutic targets in breast cancer. [Abstract]2017 Dec 5;17(1):820. PMID: 29207959
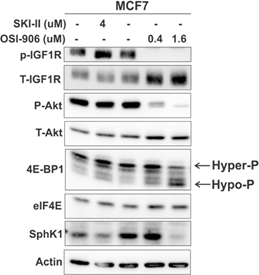
Linsitinib purchased from MedChemExpress. Usage Cited in: BMC Cancer. 2017 Dec 5;17(1):820. [Abstract]
OSI-906 inhibits p-IGF1R and IGF1R signaling factors in breast cancer cell-lines. 3 × 10⁵ ER-positive MCF7 and ER-negative are plated per well of a 6-well plate and cultured for 24 h and subsequently treated with the OSI-906 (0.1, 0.4 and 1.6 μM) and/or SKI-II (4 μM) for 24 h. Protein lysates are collected and 20 μg of protein is used for immunoblot analysis to measure changes to IGF1R signaling and SphK1 steady-state protein expression levels.
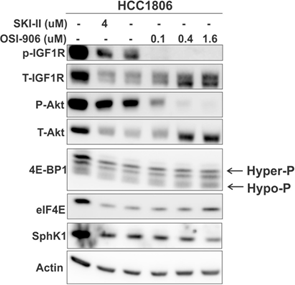
Linsitinib purchased from MedChemExpress. Usage Cited in: BMC Cancer. 2017 Dec 5;17(1):820. [Abstract]
OSI-906 inhibits p-IGF1R and IGF1R signaling factors in breast cancer cell-lines. HCC-1806 breast cancer cells are plated per well of a 6-well plate and cultured for 24 h and subsequently treated with OSI-906 (0.1, 0.4 and 1.6 μM) and/or SKI-II (4 μM) for 24 h. Protein lysates are collected and 20 μg of protein is used for immunoblot analysis to measure changes to IGF1R signaling and SphK1 steady-state protein expression levels.
-
J Cell Physiol
2021 Sep;236(9):6559-6570. PMID: 33634483 -
Endocrinology
Serum Quantitative Proteomic Analysis Reveals Soluble EGFR To Be a Marker of Insulin Resistance in Male Mice and Humans. [Abstract]2017 Dec 1;158(12):4152-4164. PMID: 29028997 -
Endocrinology
Effects of the antitumor drug OSI-906, a dual inhibitor of IGF-1 receptor and insulin receptor, on the glycemic control, β-cell functions, and β-cell proliferation in male mice. [Abstract]2014 Jun;155(6):2102-11. PMID: 24712877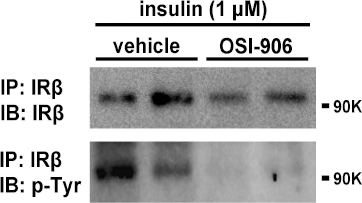
Linsitinib purchased from MedChemExpress. Usage Cited in: Endocrinology. 2014 Jun;155(6):2102-11. [Abstract]
OSI-906 inhibits insulin receptor-mediated signaling in HEK293 cells. The cells are deprived of serum for 2 hours, stimulated for 5 min with 1 μM i nsulin in the presence or absence of 200 nM OSI-906 in serum-free medium. Cell extracts are subjected to immunoprecipitation and immunoblotting, as indicated.
-
Exp Cell Res
Leptin and insulin synergize with PIK3CA mutation to enhance PD-L1 mediated immunosuppression in thyroid cancer. [Abstract]2024 Oct 1;442(2):114229. PMID: 39209143 -
Exp Cell Res
LRTM1 promotes the differentiation of myoblast cells by negatively regulating the FGFR1 signaling pathway. [Abstract]2020 Nov 1;396(1):112237. PMID: 32841643 -
J Cancer
Trop2 binding IGF2R induces gefitinib resistance in NSCLC by remodeling the tumor microenvironment. [Abstract]2021 Jul 3;12(17):5310-5319. PMID: 34335947 -
Exp Eye Res
SN promote retinal pathological neovascularization through activation of EGFR, IR and IGF-1R. [Abstract]2025 Jan:250:110158. PMID: 39549871 -
PLoS One
A novel small molecule screening assay using normal human chondrocytes toward osteoarthritis drug discovery. [Abstract]2024 Nov 1;19(11):e0308647. PMID: 39485774 -
-
-
Res Sq
Post-fast refeeding enhances intestinal stem cell-mediated regeneration and tumourigenesis through mTORC1-dependent polyamine synthesis. [Abstract]2023 Jan 10:rs.3.rs-2320717. PMID: 36711807 -
-
-
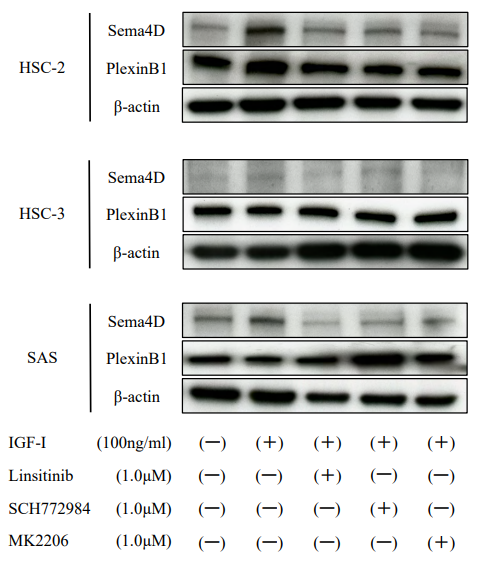
Linsitinib purchased from MedChemExpress. Usage Cited in: Okayama University. 2015.
Expression of Sema4D and PlexinB1 in various oral squamous cell carcinoma cell lines following the addition of IGF-I. Notably, the addition of IGF-I resulted in increased expression of Sema4D, particularly in HSC-2 and SAS cells. This increase was suppressed when IGF-I was administered in the presence of inhibitors targeting its receptor or downstream signaling pathways. No changes in PlexinB1 expression were observed following the addition of IGF-I.


Solvant et solubilité
DMSO : 50 mg/mL (118.63 mM; Need ultrasonic; Hygroscopic DMSO has a significant impact on the solubility of product, please use newly opened DMSO)
Please refer to the solubility information to select the appropriate solvent. Once prepared, please aliquot and store the solution to prevent product inactivation from repeated freeze-thaw cycles.
Storage method and period of stock solution: -80°C, 2 years; -20°C, 1 year. When stored at -80°C, please use it within 2 years. When stored at -20°C, please use it within 1 year.
Concentration (start) × Volume (start) = Concentration (final) × Volume (final)
Select the appropriate dissolution method based on your experimental animal and administration route.
- For the following dissolution methods, please ensure to first prepare a clear stock solution using an In Vitro approach and then sequentially add co-solvents:
- To ensure reliable experimental results, the clarified stock solution can be appropriately stored based on storage conditions. As for the working solution for In Vivo experiments, it is recommended to prepare freshly and use it on the same day.
- The percentages shown for the solvents indicate their volumetric ratio in the final prepared solution. If precipitation or phase separation occurs during preparation, heat and/or sonication can be used to aid dissolution.
Add each solvent one by one: 10% DMSO 40% PEG300 5% Tween-80 45% Saline
Solubility: ≥ 2.5 mg/mL (5.93 mM); Clear solution
This protocol yields a clear solution of ≥ 2.5 mg/mL (saturation unknown).
Taking 1 mL working solution as an example, add 100 μL DMSO stock solution (25.0 mg/mL) to 400 μL PEG300, and mix evenly; then add 50 μL Tween-80 and mix evenly; then add 450 μL Saline to adjust the volume to 1 mL.
Preparation of Saline: Dissolve 0.9 g sodium chloride in ddH₂O and dilute to 100 mL to obtain a clear Saline solution.
Add each solvent one by one: 10% DMSO 90% (20% SBE-β-CD in Saline)
Solubility: ≥ 2.5 mg/mL (5.93 mM); Clear solution
This protocol yields a clear solution of ≥ 2.5 mg/mL (saturation unknown).
Taking 1 mL working solution as an example, add 100 μL DMSO stock solution (25.0 mg/mL) to 900 μL 20% SBE-β-CD in Saline, and mix evenly.
Preparation of 20% SBE-β-CD in Saline (4°C, storage for one week): 2 g SBE-β-CD powder is dissolved in 10 mL Saline, completely dissolve until clear.
For the following dissolution methods, please prepare the working solution directly:
It is recommended to prepare fresh solutions and use them promptly within a short period of time.
The percentages shown for the solvents indicate their volumetric ratio in the final prepared solution. If precipitation or phase separation occurs during preparation, heat and/or sonication can be used to aid dissolution.
Add each solvent one by one: 30% Solutol HS-15 in Saline
Solubility: 5 mg/mL (11.86 mM); Suspended solution; Need ultrasonic
Please enter the basic information of animal experiments:
-
-
-
-
Recommended: Prepare an additional quantity of animals to account for potential losses during experiments.
Please enter your animal formula composition:
-
%DMSO +
Recommended: Keep the proportion of DMSO in working solution below 2% if your animal is weak.
-
%+
-
+%Tween-80 + +
-
%Saline +
The co-solvents required include: DMSO, . All of co-solvents are available by MedChemExpress (MCE). , Tween 80. All of co-solvents are available by MedChemExpress (MCE).
Working solution concentration: 0.22 mg/mL
Method for preparing stock solution: mg drug dissolved in μL DMSO. Stock solution concentration: mg/mL.
1. Take μL DMSO stock solution;
2. Add μL .
μL , mix evenly;
3. Then add μL Tween 80, mix evenly;
4. Then add μL
Please ensure that the stock solution in the first step is dissolved to a clear state, and add co-solvents in sequence. You can use ultrasonic heating (ultrasonic cleaner, recommended frequency 20-40 kHz), vortexing, etc. to assist dissolution.

Protocole
Protein kinase assays are either performed in-house by ELISA-based assay methods (IGF-1R, IR, EGFR and KDR) or by a radiometric method with ATP at 100 µM concentration. In-house ELISA assays use poly(Glu:Tyr) as the substrate bound to the surface of 96-well assay plates and phosphorylation is detected using an antiphosphotyrosine antibody conjugated to horseradish peroxidase. The bound antibody is quantified using ABTS as the peroxidase substrate by measuring absorbance at 405/490 nm. All assays use purified recombinant kinase catalytic domains. Recombinant enzymes of human IGF-1R or EGFR are expressed as an NH2-terminal glutathione S-transferase fusion protein in insect cells and are purified in house. IC50 values are determined from the sigmoidal dose-response plot of percent inhibition versus log10 compound concentration. A minimum of three measurements, performed in duplicate, are carried out with in-house assays unless otherwise indicated. Linsitinib at a concentration of 1 µM is profiled versus a panel of kinases using the ProfilerProTM Kinase Selectivity Assay Kit.
MedChemExpress (MCE) has not independently confirmed the accuracy of these methods. They are for reference only.
For assays of cell proliferation, cells are seeded into 96-well plates in appropriate media containing FCS 10% and incubated for 3 days in the presence of Linsitinib at various concentrations. Inhibition of cell growth is determined by luminescent quantitation of intracellular ATP content using CellTiterGlo. Data is presented as a fraction of maximal proliferation, calculated by dividing the cellular density in the presence of varying concentrations of Linsitinib by the cellular density of control cells treated with vehicle (DMSO) only.
MedChemExpress (MCE) has not independently confirmed the accuracy of these methods. They are for reference only.
Cells are harvested from cell culture flasks during exponential cell growth, washed twice with sterile PBS to a suitable concentration before subcutaneous implantation on the right flank of female nu/nu CD-1 mice. Tumors are established to 200±50 mm3 in size before randomization into treatment groups of eight mice each for efficacy studies. Linsitinib or vehicle is administered orally as indicated. The %TGI values indicated are the median %TGI over the entire dosing period. TGI of at lease 505 is considered significant. Growth delay is calculated as T-C shere T and C are the times in days for mean tumor size in the treated (T) and control (C) groups to reach 400% of the initial tumor volume. Cures are excluded from this calculation.
MedChemExpress (MCE) has not independently confirmed the accuracy of these methods. They are for reference only.


Pureté et documentation
-
Fiche technique (284 KB)
-
SDS (393 KB)
- English - EN (393 KB)
- Français - FR (393 KB)
- Deutsch - DE (393 KB)
- Norwegian - NO (393 KB)
- Español - ES (393 KB)
- Swedish - SV (393 KB)
- Italian - IT (393 KB)
- Korean - KR (393 KB)
- Portuguese - PT (393 KB)
-
Instruction de manipulation (2659 KB)
Références
[1]. Mulvihill MJ, et al. Discovery of OSI-906: a selective and orally efficacious dual inhibitor of the IGF-1 receptor and IR. Future Med Chem. 2009 Sep;1(6):1153-71. [Content Brief]
[2]. McKinley ET, et al. 18FDG-PET predicts pharmacodynamic response to OSI-906, a dual IGF-1R/IR inhibitor, in preclinical mouse models of lung cancer. Clin Cancer Res. 2011 May 15;17(10):3332-40. [Content Brief]
[3]. Li W, et al. Effectiveness of inhibitor rapamycin, saracatinib, linsitinib and JNJ-38877605 against human prostate cancer cells. Int J Clin Exp Med. 2015 Apr 15;8(4):6563-7. [Content Brief]


Complete Stock Solution Preparation Table
Please refer to the solubility information to select the appropriate solvent. Once prepared, please aliquot and store the solution to prevent product inactivation from repeated freeze-thaw cycles.
Storage method and period of stock solution: -80°C, 2 years; -20°C, 1 year. When stored at -80°C, please use it within 2 years. When stored at -20°C, please use it within 1 year.
| Optional Solvent | Concentration Solvent Mass | 1 mg | 5 mg | 10 mg | 25 mg |
|---|---|---|---|---|---|
| DMSO | 1 mM | 2.3725 mL | 11.8627 mL | 23.7254 mL | 59.3134 mL |
| 5 mM | 0.4745 mL | 2.3725 mL | 4.7451 mL | 11.8627 mL | |
| 10 mM | 0.2373 mL | 1.1863 mL | 2.3725 mL | 5.9313 mL | |
| 15 mM | 0.1582 mL | 0.7908 mL | 1.5817 mL | 3.9542 mL | |
| 20 mM | 0.1186 mL | 0.5931 mL | 1.1863 mL | 2.9657 mL | |
| 25 mM | 0.0949 mL | 0.4745 mL | 0.9490 mL | 2.3725 mL | |
| 30 mM | 0.0791 mL | 0.3954 mL | 0.7908 mL | 1.9771 mL | |
| 40 mM | 0.0593 mL | 0.2966 mL | 0.5931 mL | 1.4828 mL | |
| 50 mM | 0.0475 mL | 0.2373 mL | 0.4745 mL | 1.1863 mL | |
| 60 mM | 0.0395 mL | 0.1977 mL | 0.3954 mL | 0.9886 mL | |
| 80 mM | 0.0297 mL | 0.1483 mL | 0.2966 mL | 0.7414 mL | |
| 100 mM | 0.0237 mL | 0.1186 mL | 0.2373 mL | 0.5931 mL |


 Powered by Bioz