



PF15
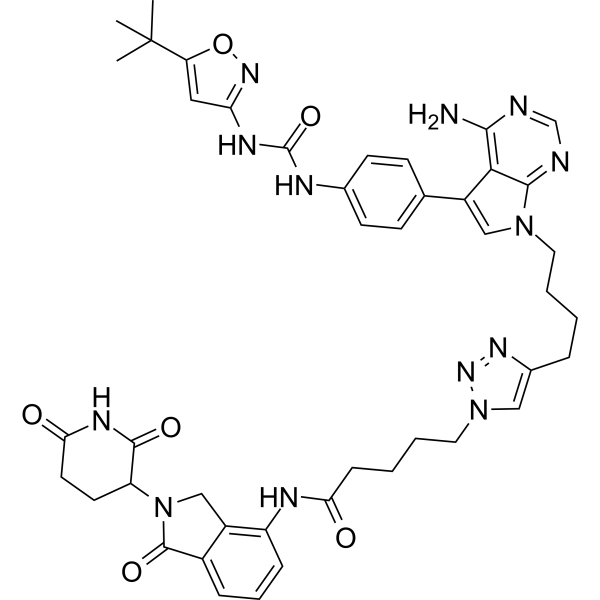
PF15 is an orally active FLT3-ITD PROTAC degrader with a DC50 of 76.7 nM and an IC50 of 36 nM against FLT3-ITD. PF15 induces FLT3-ITD protein degradation, thereby downregulating its phosphorylation level. PF15 inhibits the proliferation of FLT3-ITD-positive cells and reduces the phosphorylation level of STAT5, a downstream molecule of FLT3-ITD. PF15 exhibits efficacy in in vivo xenograft models of acute myeloid leukemia and prolongs survival. PF15 can be used for the research of acute myeloid leukemia.
(Pink: FLT3 Target protein ligand; Blue: Cereblon ligand (HY-A0003); Black: linker).
Nur für Forschungszwecke. Wir verkaufen nicht an Patienten.
- CAS. Nr.: 2892631-70-6
- Formel: C44H49N13O6
- Molecular Weight:855.94
-
Speicherung:
Please store the product under the recommended conditions in the Certificate of Analysis.

To place orders, for customer services and technical support, please contact: MedChemExpress USA
Tel: 609-228-6898 E-mail: [email protected] [email protected]


-
 Biologische Aktivität
-
Chemical Information
-
Lösungsmittel & Löslichkeit
- Protokoll
- Reinheit & Dokumentation
- Verweise
-
 Help & FAQs


Alle PROTACs Isoform-spezifische Produkte anzeigen
More

Biologische Aktivität
Beschreibung
IC50 & Target
[1]|
STAT5 |
Cellular Effect
|
Cell Line

|
Type | Value | Description | References |
|---|---|---|---|---|
| MV4-11 | IC50 |
4.83 nM
Compound: 6; PF15
|
Antiproliferative activity against human MV4-11 cells assessed as reduction in cell viability measured after 48 hrs by CellTiter-Glo assay
Antiproliferative activity against human MV4-11 cells assessed as reduction in cell viability measured after 48 hrs by CellTiter-Glo assay
|
[PMID: 39094274] |
In Vitro
PF15 potently and selectively inhibits FLT3 kinase with an IC50 of 36 nM, and its inhibitory potency against c-Kit kinase is over 35-fold lower; it exhibits high selectivity for FLT3 among a panel of 93 tumor-related kinases[1].
PF15 (1-2000 nM; 1-24 h) induces proteasome-dependent degradation of FLT3 protein in BaF3-FLT3-ITD cells, with a DC50 of 76.7 nM, and prolonged incubation achieves complete degradation of the protein[1].
PF15 (10-1000 nM; 2 h) upregulates FLT3 mRNA levels in BaF3-FLT3-ITD cells at low concentrations (10 nM, 30 nM)[1].
PF15 (72 h) potently inhibits the proliferation of MV4-11 FLT3-ITD-positive AML cells with an IC50 of 4.83 nM; potently inhibits the proliferation of Molm-13 FLT3-ITD-positive AML cells with an IC50 of 4.01 nM; potently inhibits the proliferation of BaF3-FLT3-ITD transformed cells with an IC50 of 7.85 nM; inhibits the proliferation of drug-resistant BaF3-FLT3-ITD-D835V transformed cells with an IC50 of 120.1 nM; inhibits the proliferation of drug-resistant BaF3-FLT3-ITD-F691L transformed cells with an IC50 of 116.6 nM; and exhibits only extremely low antiproliferative activity against FLT3 wild-type cancer cells (THP-1, K562, Daudi, HEL, Jurkat, RS4;11)[1].
PF15 (10-1000 nM; 6 h) downregulates the phosphorylation levels of FLT3 and STAT5 in BaF3-FLT3-ITD, BaF3-FLT3-ITD-D835V, and BaF3-FLT3-ITD-F691L cells at a concentration of 100 nM after 6 h of treatment, whereas a higher concentration is required for FLT3 degradation[1].
MedChemExpress (MCE) has not independently confirmed the accuracy of these methods. They are for reference only. Further protocols information, click here.
-
Cell Line:FLT3 wild-type cancer cells (THP-1, K562, Daudi, HEL, Jurkat, RS4;11)
-
Concentration:40 μM
-
Incubation Time:72 h
-
Result:Hardly inhibited proliferation of all tested FLT3 wild-type cell lines even at the maximum tested concentration of 40 μM.
-
Cell Line:BaF3-FLT3-ITD cells
-
Concentration:1, 3, 10, 30, 100, 300, 1000 nM (6 h incubation)
100 nM
15.6, 31.2, 62.5, 250, 500, 1000, 2000 nM (24 h incubation)
1000 nM (6 h incubation, with 1 h MG132 (HY-13259) pre-treatment) -
Incubation Time:6 h
1, 3, 6, 12, 24 h
24 h
6 h (with 1 h MG132 pre-treatment) -
Result:Induced dose-dependent FLT3 degradation with a DC50 of 76.7 nM after 24 h of treatment, and achieves complete degradation with extended incubation.
Achieved complete degradation after 24 h of treatment at sufficient concentrations.
Pre-treatment with proteasome inhibitor MG132 completely blocked PF15-induced FLT3 degradation.
-
Cell Line:BaF3-FLT3-ITD cells
-
Concentration:10, 30, 100, 300, 1000 nM
-
Incubation Time:6 h
-
Result:Dramatically inhibited phosphorylation of FLT3 and STAT5 in a dose-dependent manner.
Downregulated p-FLT3 more pronouncedly than p-STAT5.
-
Cell Line:BaF3-FLT3-ITD-D835V cells
-
Concentration:10, 30, 100, 300, 1000 nM
-
Incubation Time:6 h
-
Result:Sharply downregulated phosphorylation of FLT3 and STAT5 at 100 nM.
Required high concentrations to induce FLT3 protein degradation.
-
Cell Line:BaF3-FLT3-ITD-F691L cells
-
Concentration:10, 30, 100, 300, 1000 nM
-
Incubation Time:6 h
-
Result:Sharply downregulated phosphorylation of FLT3 and STAT5 at 100 nM.
Required high concentrations to induce FLT3 protein degradation.
In Vivo
PF15 (20-40 mg/kg; p.o.; twice daily; 12 days; i.p.; daily; 12 days) significantly extends survival in an AML in situ xenograft model, with the 20 mg/kg twice-daily p.o. dose increasing median survival from 11 days to 15 days[1].
MedChemExpress (MCE) has not independently confirmed the accuracy of these methods. They are for reference only.
-
Animal Model:NOD/SCID (female; subcutaneous xenograft model via implantation of 107 BaF3-FLT3-ITD cells)[1]
-
Dosage:10 mg/kg; 20 mg/kg
-
Administration:i.p.; daily; 10 days
-
Result:Achieved a tumor growth inhibition rate of 58.4% at 10 mg/kg.
Achieved a higher tumor growth inhibition rate at 20 mg/kg.
Showed no significant changes in serum AST, urea, and CK-MB levels at both doses.
-
Animal Model:BALB/c nude (female; in situ xenograft model via tail vein injection of 1×10⁶ BaF3-FLT3-ITD cells)[1]
-
Dosage:20 mg/kg; 40 mg/kg
-
Administration:p.o.; twice daily; 12 days; i.p.; daily; 12 days
-
Result:Prolonged median survival to 15 days at 20 mg/kg twice-daily dose.
Resulted in median survival equivalent to the 20 mg/kg twice-daily dose at 40 mg/kg daily dose.


Chemical Information
-
CAS. Nr. 2892631-70-6
-
Molecular Weight 855.94
-
Formel C44H49N13O6
-
SMILES
CC(C)(C1=CC(NC(NC2=CC=C(C=C2)C3=CN(C4=NC=NC(N)=C34)CCCCC5=CN(N=N5)CCCCC(NC6=C7CN(C(C7=CC=C6)=O)C8CCC(NC8=O)=O)=O)=O)=NO1)C
-
Versand
Room temperature in continental US; may vary elsewhere.
-
Speicherung
Please store the product under the recommended conditions in the Certificate of Analysis.


Lösungsmittel & Löslichkeit
In Vitro:
DMSO : 100 mg/mL (116.83 mM; Need ultrasonic; Hygroscopic DMSO has a significant impact on the solubility of product, please use newly opened DMSO)
Konzentration (Stammlösung) × Volumen (Stammlösung) = Konzentration (Ziellösung) × Volumen (Ziellösung)
In Vivo:
Select the appropriate dissolution method based on your experimental animal and administration route.
- For the following dissolution methods, please ensure to first prepare a clear stock solution using an In Vitro approach and then sequentially add co-solvents:
- To ensure reliable experimental results, the clarified stock solution can be appropriately stored based on storage conditions. As for the working solution for In Vivo experiments, it is recommended to prepare freshly and use it on the same day.
- The percentages shown for the solvents indicate their volumetric ratio in the final prepared solution. If precipitation or phase separation occurs during preparation, heat and/or sonication can be used to aid dissolution.
Add each solvent one by one: 10% DMSO 40% PEG300 5% Tween-80 45% Saline
Solubility: ≥ 2.5 mg/mL (2.92 mM); Clear solution
This protocol yields a clear solution of ≥ 2.5 mg/mL (saturation unknown).
Taking 1 mL working solution as an example, add 100 μL DMSO stock solution (25.0 mg/mL) to 400 μL PEG300, and mix evenly; then add 50 μL Tween-80 and mix evenly; then add 450 μL Saline to adjust the volume to 1 mL.
Preparation of Saline: Dissolve 0.9 g sodium chloride in ddH₂O and dilute to 100 mL to obtain a clear Saline solution.
In Vivo Dissolution Calculator
Please enter the basic information of animal experiments:
-
-
-
-
Recommended: Prepare an additional quantity of animals to account for potential losses during experiments.
Please enter your animal formula composition:
-
%DMSO +
Recommended: Keep the proportion of DMSO in working solution below 2% if your animal is weak.
-
%+
-
+%Tween-80 + +
-
%Saline +
The co-solvents required include: DMSO, . All of co-solvents are available by MedChemExpress (MCE). , Tween 80. All of co-solvents are available by MedChemExpress (MCE).
Working solution concentration: 0.22 mg/mL
Method for preparing stock solution: mg drug dissolved in μL DMSO. Stock solution concentration: mg/mL.
1. Take μL DMSO stock solution;
2. Add μL .
μL , mix evenly;
3. Then add μL Tween 80, mix evenly;
4. Then add μL
Please ensure that the stock solution in the first step is dissolved to a clear state, and add co-solvents in sequence. You can use ultrasonic heating (ultrasonic cleaner, recommended frequency 20-40 kHz), vortexing, etc. to assist dissolution.

Protokoll
-
Kinase activity and phosphorylation assays
Kinase activity assays measure the ability of kinases to transfer phosphate groups from ATP to specific substrates, while phosphorylation assays detect the presence and levels of phosphorylated proteins. Common methods include radiolabeled ATP incorporation (e. g. ,), ADP release detection via bioluminescence (e. g. ,[3]), enzyme-linked immunosorbent assays (ELISA) for phospho-specific epitopes (e. g. ,[6]), and microtiter-based formats for high-throughput screening (e. g. ,[8]). The ADP-Glo assay quantifies kinase activity by measuring ADP produced during phosphorylation using a luciferase-based system. Radiometric assays involve autoradiography or scintillation counting after incorporation of 32P-labeled ATP into substrate proteins. ELISA-based approaches rely on phospho-specific antibodies to detect activated kinases in cell lysates or purified samples.
-
Western Blot
Western blotting (WB) is a commonly used experimental method in molecular biology, biochemistry, and immunogenetics for identifying and quantifying target proteins. It combines gel electrophoresis with immunoassay, enabling researchers to analyze protein expression, post-translational modifications, and molecular weight.
-
Cell Cytotoxicity Assay
Cytotoxicity assays are usually based on the assessment of cell membrane damage, which can also be indirectly detected by measuring cell viability. Detection methods include MTT assay, CKK-8 assay, LDH assay and ATP assay, etc.
-
Patient-Derived Xenograft (PDX)
Patient-derived xenograft (PDX) models are generated by engrafting primary human tumor tissue directly into immunodeficient mice, allowing in vivo propagation of patient tumor biology without initial in vitro adaptation. These models are used to preserve key histopathological and molecular characteristics of the original tumor and enable assessment of tumor growth dynamics and therapeutic response in a living organism. The biological readout is tumor engraftment and subsequent growth in the murine host, which reflects the ability of human tumor cells to survive, vascularize, and expand in an immunocompromised microenvironment.
-
Splenic/Portal-Vein Liver Metastasis Xenograft
Splenic and portal-vein liver metastasis xenograft models deliver tumor cells into the portal circulation so that cells reach the liver first and form hepatic metastatic lesions; splenic injection uses the spleen as an access route to the portal system, while direct portal-vein injection introduces cells into the portal vein without requiring splenectomy. The assay detects liver colonization, intrahepatic tumor growth, tumor distribution, treatment response, survival, and liver-metastasis microenvironment changes; readouts include bioluminescence or fluorescence imaging, gross liver nodule counts, liver weight or tumor burden, histology, and survival.
-
Protocol for Kinase activity and phosphorylation assays
Kinase activity assays measure transfer of phosphate from ATP to a protein or peptide substrate, generating phosphorylated substrate, ADP, or incorporated radiolabeled phosphate as the readout; phosphorylation assays measure site-specific phosphorylation in cells or tissues as a proxy for kinase-pathway activation, inhibition, or substrate regulation. Phosphorylation can be detected by phospho-specific Western blot, immunoprecipitation kinase assay, phospho-immunofluorescence, phospho-flow cytometry, luminescent ADP detection, radiolabeled ATP incorporation, or reporter-based pathway assays, and these readouts can be applied to cancer cells, primary neurons, mouse tumors, organoids, inflammatory macrophages, ferroptosis studies, and mitophagy studies when the kinase target is biologically relevant.
-
Subcutaneous Cell-Line-Derived Xenograft
Subcutaneous cell-line-derived xenograft (CDX) models are established by implanting cultured human cancer cell lines into immunodeficient mice, where the injected cells form localized tumors that can be monitored in vivo as a measure of tumorigenic potential, growth kinetics, and treatment response. These models are widely used in oncology research because they allow reproducible tumor formation and enable comparative assessment of tumor growth between different cell lines or genetic manipulations in a controlled in vivo microenvironment. Subcutaneous implantation of cancer cells in immunodeficient mice is a standard approach for evaluating tumor growth behavior and therapeutic response across multiple cancer types, including prostate, esophageal, pancreatic, and colon cancer models.
-
Orthotopic Cell-Line Xenograft
Orthotopic cell-line xenograft models involve implantation of human cancer cell lines into the anatomically corresponding organ of immunodeficient mice to reproduce tumor growth within a native microenvironment, enabling more clinically relevant tumor behavior compared with subcutaneous models. These models are widely used because orthotopic placement better recapitulates tumor progression, including invasion and metastatic spread, which are often underrepresented in heterotopic implantation systems. Compared with conventional xenografts, orthotopic implantation is described as more technically complex but provides improved simulation of tumor-microenvironment interactions and metastatic behavior, making it particularly valuable for translational oncology research. Surgical orthotopic implantation approaches have been emphasized as enabling faithful reproduction of clinical cancer features, including metastasis and disease progression patterns that align with the tumor’s organ of origi
-
Cell Viability Determination by MTT Colorimetric Assay
The following protocol uses the MTT colorimetric assay as a classic literature-established method for assessing cell viability/metabolic activity in cultured mammalian cells. MTT[3-(4,5-dimethylthiazol-2-yl)-2,5-diphenyltetrazolium bromide] is reduced by metabolically active cells to a colored formazan product; the amount of formazan is quantified spectrophotometrically and provides an indirect measure of metabolically active viable cells. Importantly, MTT reduction reflects cellular oxidoreductase/metabolic activity rather than an absolute direct count of living cells, so changes in cellular metabolism can alter the signal independently of cell number.
-
Intraperitoneal/Peritoneal Dissemination Xenograft
Intraperitoneal (IP) or peritoneal dissemination xenograft models are based on the introduction of human cancer cells into the peritoneal cavity of immunodeficient mice, where they attach to peritoneal surfaces, form multicellular aggregates or spheroids, and progressively generate disseminated tumor nodules that mimic advanced peritoneal metastatic disease. These models are widely used to study ovarian cancer progression, tumor-microenvironment interactions, and intraperitoneal therapeutic responses, often incorporating bioluminescence or fluorescence imaging to longitudinally monitor tumor burden in vivo. The biological principle relies on the capacity of tumor cells such as SKOV3 or related ovarian carcinoma lines to survive in suspension, aggregate within ascites-like fluid, adhere to mesothelial surfaces, and invade peritoneal organs, thereby recapitulating human peritoneal carcinomatosis patterns observed in advanced disease.


Reinheit & Dokumentation
Verweise


Complete Stock Solution Preparation Table
| Optional Solvent | Concentration Solvent Mass | 1 mg | 5 mg | 10 mg | 25 mg |
|---|---|---|---|---|---|
| DMSO | 1 mM | 1.1683 mL | 5.8415 mL | 11.6831 mL | 29.2077 mL |
| 5 mM | 0.2337 mL | 1.1683 mL | 2.3366 mL | 5.8415 mL | |
| 10 mM | 0.1168 mL | 0.5842 mL | 1.1683 mL | 2.9208 mL | |
| 15 mM | 0.0779 mL | 0.3894 mL | 0.7789 mL | 1.9472 mL | |
| 20 mM | 0.0584 mL | 0.2921 mL | 0.5842 mL | 1.4604 mL | |
| 25 mM | 0.0467 mL | 0.2337 mL | 0.4673 mL | 1.1683 mL | |
| 30 mM | 0.0389 mL | 0.1947 mL | 0.3894 mL | 0.9736 mL | |
| 40 mM | 0.0292 mL | 0.1460 mL | 0.2921 mL | 0.7302 mL | |
| 50 mM | 0.0234 mL | 0.1168 mL | 0.2337 mL | 0.5842 mL | |
| 60 mM | 0.0195 mL | 0.0974 mL | 0.1947 mL | 0.4868 mL | |
| 80 mM | 0.0146 mL | 0.0730 mL | 0.1460 mL | 0.3651 mL | |
| 100 mM | 0.0117 mL | 0.0584 mL | 0.1168 mL | 0.2921 mL |


PF15 Related Classifications
HY-143286 Related Classifications
 Powered by Bioz