



HDAC-IN-37
Based on 1 publication(s) in Google Scholar
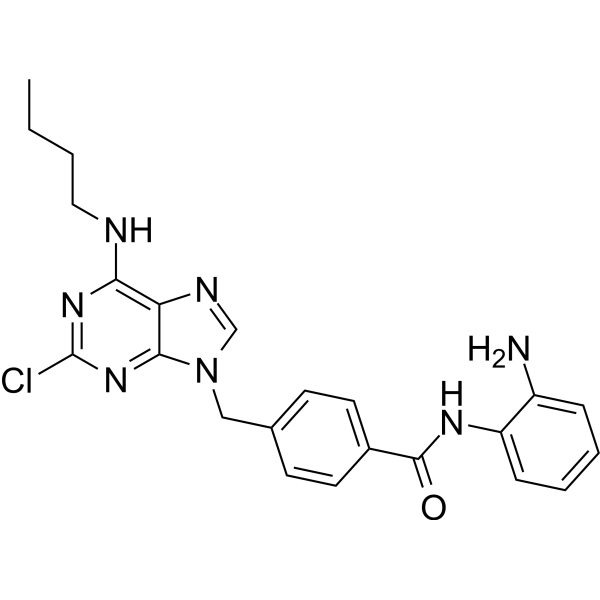
HDAC-IN-37 is a potent HDAC inhibitor with IC50s of 0.0551 μM, 1.24 μM, 0.948 μM and 34.2 μM for HDAC1, HDAC3, HDAC8 and HDAC6, respectively. HDAC-IN-37 induces histone acetylation in a slow-off manner. HDAC-IN-37 prevents cell transition from G1 phase to S phase and induces early cell apoptosis.
For research use only. We do not sell to patients.
- CAS No.: 2766466-56-0
- Formula: C23H24ClN7O
- Molecular Weight:449.94
-
Storage:
Please store the product under the recommended conditions in the Certificate of Analysis.

To place orders, for customer services and technical support, please contact: MedChemExpress USA
Tel: 609-228-6898 E-mail: [email protected] [email protected]


-
 Biological Activity
-
Chemical Information
- Protocols
- Purity & Documentation
- References
-
 Help & FAQs


Publications Citing Use of MedChemExpress (MCE) HDAC-IN-37
More

Biological Activity
Description
IC50 & Target
[1]|
HDAC1 55.1 nM (IC50) |
HDAC3 1.24 μM (IC50) |
HDAC8 0.948 μM (IC50) |
HDAC6 34.2 μM (IC50) |
Cellular Effect
|
Cell Line

|
Type | Value | Description | References |
|---|---|---|---|---|
| A549 | IC50 |
1.65 μM
Compound: 9d
|
Antiproliferative activity against human A549 cells measured after 48 hrs by MTT assay
Antiproliferative activity against human A549 cells measured after 48 hrs by MTT assay
|
[PMID: 35041998] |
| HCT-116 | IC50 |
0.5 μM
Compound: 9d
|
Antiproliferative activity against human HCT-116 cells measured after 48 hrs by MTT assay
Antiproliferative activity against human HCT-116 cells measured after 48 hrs by MTT assay
|
[PMID: 35041998] |
| HepG2 | IC50 |
1.29 μM
Compound: 9d
|
Antiproliferative activity against human HepG2 cells measured after 48 hrs by MTT assay
Antiproliferative activity against human HepG2 cells measured after 48 hrs by MTT assay
|
[PMID: 35041998] |
| K562 | IC50 |
0.12 μM
Compound: 9d
|
Antiproliferative activity against human K562 cells measured after 48 hrs by MTT assay
Antiproliferative activity against human K562 cells measured after 48 hrs by MTT assay
|
[PMID: 35041998] |
| MDA-MB-231 | IC50 |
0.38 μM
Compound: 9d
|
Antiproliferative activity against human MDA-MB-231 cells measured after 48 hrs by MTT assay
Antiproliferative activity against human MDA-MB-231 cells measured after 48 hrs by MTT assay
|
[PMID: 35041998] |
| SGC-7901 | IC50 |
1.52 μM
Compound: 9d
|
Antiproliferative activity against human SGC-7901 cells measured after 48 hrs by MTT assay
Antiproliferative activity against human SGC-7901 cells measured after 48 hrs by MTT assay
|
[PMID: 35041998] |
In Vitro
HDAC-IN-37 (compound 9d) exhibits the potent antiproliferative activities on the HCT116, MDA-MB-231, K562 cell lines at IC50s of 0.50, 0.38, 0.12 μM, respectively[1].
HDAC-IN-37 (0 - 10 μM; 24 hours) significantly induces the accumulation of acetylated histones at H3K9 and H4K5 in HCT-116 cells[1].
HDAC-IN-37 (0 - 10 μM; 24 hours) induces cell apoptosis in HCT-116 cells by 35.22%, 58.34, 80.7% at 0.5, 1, 5 μM, mainly occurring in early apoptosis[1].
HDAC-IN-37 (0 - 10 μM; 6, 12, 24 hours) causes G0/G1 phase arrest of HCT-116 cells in a time-dependent manner, effectively preventing cell cycle progression[1].
HDAC-IN-37 (0, 0.1, 0.5, 1, 5 and 10 μM; 0, 6, 12, 24, 36, 48 hours) down-regulates the levels of CDK2, Cyclin D1 and the up-regulates P21 with dose- and time-dependent manners in HCT-116 cells, and decreases Bcl-2 of Bcl-2 family in dose- and time-dependent manners[1].
MedChemExpress (MCE) has not independently confirmed the accuracy of these methods. They are for reference only.
-
Cell Line:HCT-116, MDA-MB-231, HepG2, A549, SGC7901 and K562[1]
-
Concentration:0-10 μM
-
Incubation Time:48 hours
-
Result:Exhibited the potent antiproliferative activities on the HCT116, MDA-MB-231, K562 cell lines at IC50 of 0.50, 0.38, 0.12 μM, respectively.
-
Cell Line:HCT-116[1]
-
Concentration:0, 0.1, 0.5, 1, 5 and 10 μM
-
Incubation Time:24 hours
-
Result:Significantly induced the accumulation of acetylated histones at H3K9 and H4K5 in HCT-116 cells.
-
Cell Line:HCT-116[1]
-
Concentration:0.1, 0.5, 1, 5 and 10 μM
-
Incubation Time:24 hours
-
Result:Induced cell apoptosis in HCT-116 cells by 35.22%, 58.34, 80.7% at 0.5, 1, 5 μM, mainly occurring in early apoptosis.
-
Cell Line:HCT-116[1]
-
Concentration:0.1, 0.5, 1, 5 and 10 μM
-
Incubation Time:0, 6, 12 and 24 hours
-
Result:Caused G0/G1 phase arrest of HCT-116 cells in a time-dependent manner, effectively preventing cell cycle progression.
- EdU Incorporation Assay (Click Chemistry-Based DNA Synthesis Measurement)
- Detection of Apoptosis
- TUNEL staining for apoptotic DNA fragmentation
- Flow cytometric DNA-content cell-cycle staining
- Annexin V plus membrane-impermeant dye apoptosis staining
- BrdU Incorporation Assay
- Apoptosis Solutions
- Protocol for Cell Cycle


Chemical Information
-
CAS No. 2766466-56-0
-
Molecular Weight 449.94
-
Formula C23H24ClN7O
-
SMILES
CCCCNC1=C2N=CN(C2=NC(Cl)=N1)CC3=CC=C(C=C3)C(NC4=CC=CC=C4N)=O
-
Shipping
Room temperature in continental US; may vary elsewhere.
-
Storage
Please store the product under the recommended conditions in the Certificate of Analysis.


Publications (1)
-
Journal Impact Factor
-
Most Recent


Purity & Documentation
References

Calculators
Concentration (start) × Volume (start) = Concentration (final) × Volume (final)


HDAC-IN-37 Related Classifications
HY-146750 Related Classifications
 Powered by Bioz