



Bimiralisib
Based on 5 publication(s) in Google Scholar
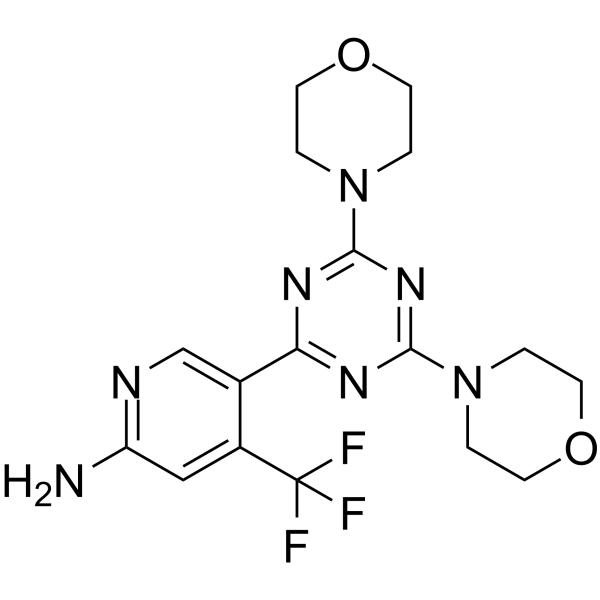
Bimiralisib (PQR309) is an orally active, blood-brain barrier-penetrant PI3K/mTOR inhibitor with in vitro antiproliferative activity and in vivo antitumor activity. Bimiralisib induces G1 cell cycle arrest, apoptosis and cell death in cancer cells, while inhibiting cancer cell proliferation, migration, invasion, colony formation and spheroid generation. Bimiralisib upregulates the expression of E2F4. The combination of Bimiralisib with venetoclax enhances therapeutic efficacy in acute myeloid leukemia models. Bimiralisib can be used in cancer-related research.
Nos produits utilisent uniquement pour la recherche. Nous ne vendons pas aux patients.
- Pureté : 98.62%
- CAS No.: 1225037-39-7
- Formule: C17H20F3N7O2
- Masse moléculaire:411.38
-
Stockage:Powder -20°C, 3 years , 4°C, 2 years ; In solvent -80°C, 2 years , -20°C, 1 year

To place orders, for customer services and technical support, please contact: MedChemExpress USA
Tel: 609-228-6898 E-mail: [email protected] [email protected]


-
 Activité biologique
-
Chemical Information
-
Solvant et solubilité
- Protocole
- Pureté et documentation
- Références
-
 Help & FAQs


-
HY-16585
VS-5584PI3K/mTOR Inhibitor -
HY-10297
OmipalisibPI3K/mTOR Inhibitor -
HY-10681
GedatolisibPI3K/mTOR Inhibitor -
HY-19962
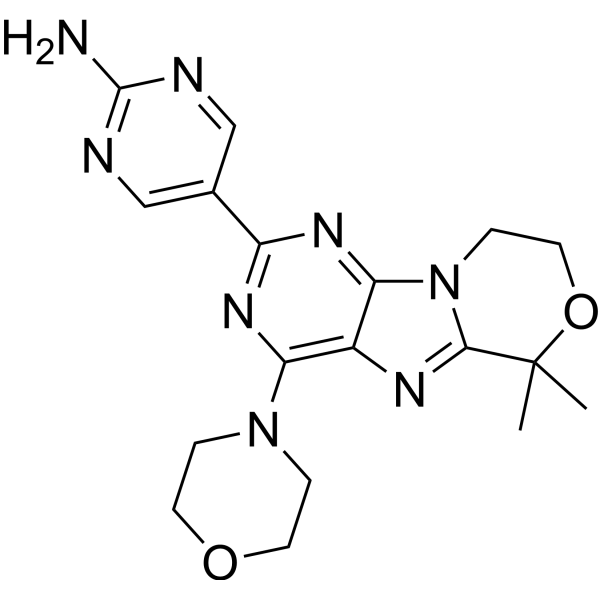
PaxalisibPI3K/mTOR Inhibitor -
HY-50673
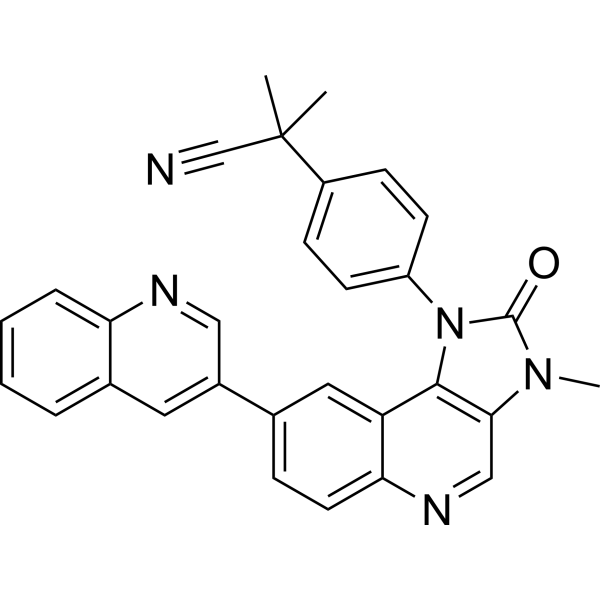
DactolisibPI3K/mTOR Inhibitor -
HY-15244
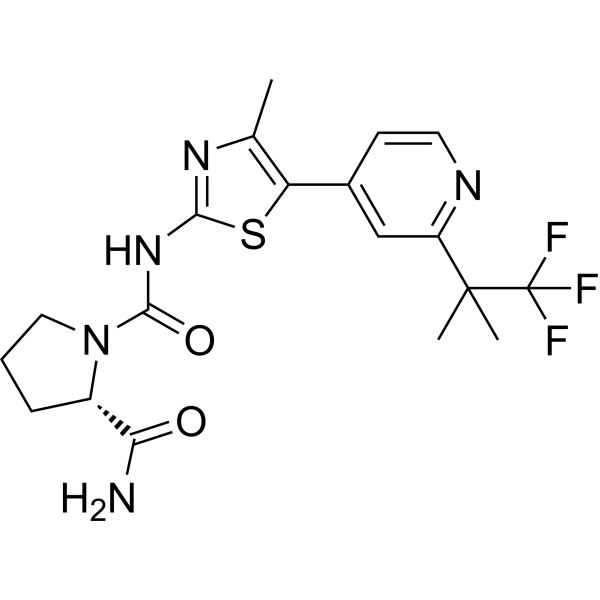
AlpelisibPI3Kα Inhibitor -
HY-15900
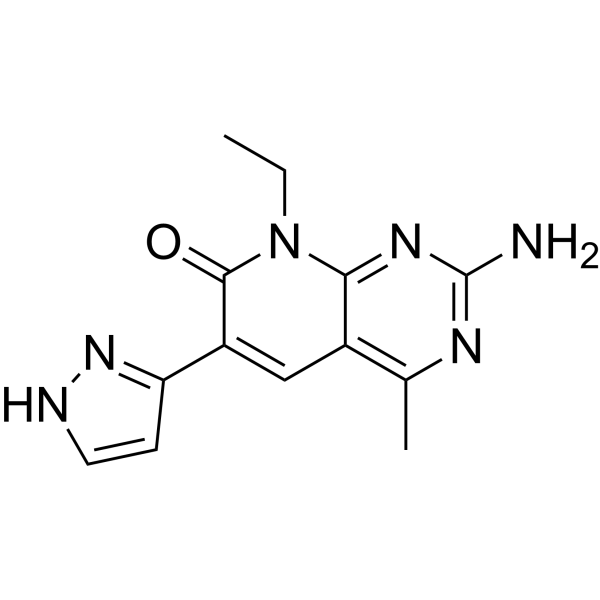
VoxtalisibPI3K Inhibitor -
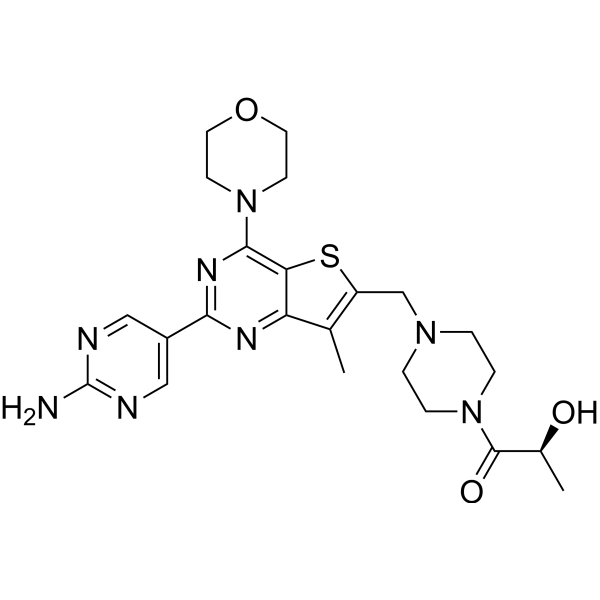
HY-13246
ApitolisibApoptosis Inducer -
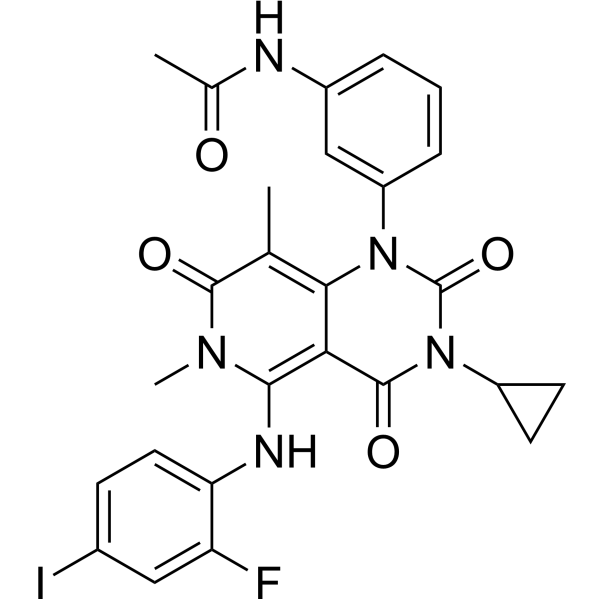
HY-10999
TrametinibMEK Inhibitor -
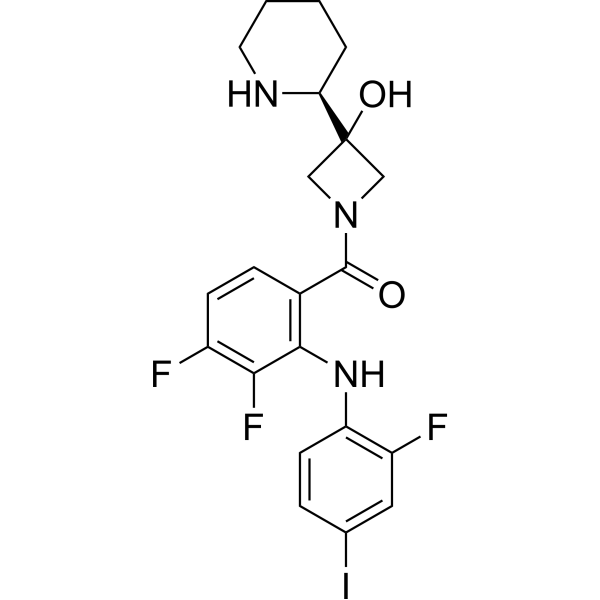
HY-13064
CobimetinibMEK1 Inhibitor -
HY-15247
VistusertibmTORC Inhibitor -
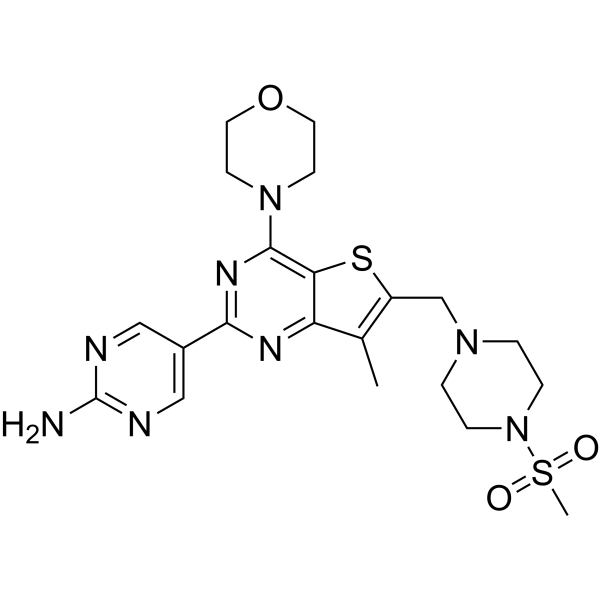
HY-11042
GNE-477PI3K Inhibitor
Publications Citing Use of MedChemExpress (MCE) Bimiralisib
More

Activité biologique
Description
|
PI3Kα-H1047R 36 nM (IC50) |
PI3Kα-E542K 63 nM (IC50) |
PI3Kα-E545K 136 nM (IC50) |
Cellular Effect
|
Cell Line

|
Type | Value | Description | References |
|---|---|---|---|---|
| A2058 | IC50 |
139 nM
Compound: 1; PQR309
|
Inhibition of mTORC2 in human A2058 cells assessed as reduction in PKB phosphorylation at S473 residues incubated for 1 hr by Western blot analysis
Inhibition of mTORC2 in human A2058 cells assessed as reduction in PKB phosphorylation at S473 residues incubated for 1 hr by Western blot analysis
|
[PMID: 31465220] |
| A2058 | IC50 |
139 nM
Compound: 5; PQR309
|
Inhibition of Class 1 PI3K/mTOR in human A2058 cells assessed as reduction in Akt phosphorylation at Ser473 residue incubated for 1 hr by InCell Western assay
Inhibition of Class 1 PI3K/mTOR in human A2058 cells assessed as reduction in Akt phosphorylation at Ser473 residue incubated for 1 hr by InCell Western assay
|
[PMID: 31244112] |
| A2058 | IC50 |
205 nM
Compound: 1; PQR309
|
Inhibition of mTORC1 in human A2058 cells assessed as reduction in ribosomal protein S6 phosphorylation at Ser235/236 residues incubated for 1 hr by Western blot analysis
Inhibition of mTORC1 in human A2058 cells assessed as reduction in ribosomal protein S6 phosphorylation at Ser235/236 residues incubated for 1 hr by Western blot analysis
|
[PMID: 31465220] |
| A2058 | IC50 |
205 nM
Compound: 5; PQR309
|
Inhibition of Class 1 PI3K/mTOR in human A2058 cells assessed as reduction in S6 phosphorylation at Ser235/236 residue incubated for 1 hr by InCell Western assay
Inhibition of Class 1 PI3K/mTOR in human A2058 cells assessed as reduction in S6 phosphorylation at Ser235/236 residue incubated for 1 hr by InCell Western assay
|
[PMID: 31244112] |
| A2058 | IC50 |
2333 nM
Compound: 1; PQR309
|
Antiproliferative activity against human A2058 cells after 48 hrs by sulforhodamine B assay
Antiproliferative activity against human A2058 cells after 48 hrs by sulforhodamine B assay
|
[PMID: 28829592] |
| SK-OV-3 | IC50 |
237 nM
Compound: 1; PQR309
|
Antiproliferative activity against human SKOV3 cells after 48 hrs by sulforhodamine B assay
Antiproliferative activity against human SKOV3 cells after 48 hrs by sulforhodamine B assay
|
[PMID: 28829592] |
In Vitro
Bimiralisib inhibits the proliferation and induces apoptosis of human glioblastoma U87 and U251 cells, reduces the migration and invasion abilities of glioma cells, and also induces G1-phase cell cycle arrest in a dose-dependent manner[1].
Bimiralisib (PQR-309) reduces the viability of OCI-Ly1 diffuse large B-cell lymphoma (DLBCL) cells, MOLM-13 acute myeloid leukemia (AML) cells, mL-2 and SKM-1 AML cells, HL-60 AML cells, as well as OCI-AML3, PL-21 and MOLM-16 AML cells, with corresponding IC50 values of 1 μM, 2 μM, 3 μM, 5 μM and 10 μM[2].
Bimiralisib (1 μM alone or combined with 100 nM Venetoclax (HY-15531); 20 h) exhibits reduced cytotoxic potency in MOLM-13, SKM-1 and OCI-AML3 acute myeloid leukemia (AML) cells due to the protective effect of bone marrow stroma[2].
Bimiralisib (0.312-20.0 μM; 72 h) potently inhibits the viability of human gastric cancer cell lines SNU-484, SNU-668 and AGS, with IC50 values of 0.792 μM, 0.419 μM and 0.611 μM, respectively[3].
Bimiralisib (0.312-1.25 μM; 8 days) inhibits clonogenic growth of SNU-484, SNU-668 and AGS human gastric cancer cells[3].
Bimiralisib (0.312-1.25 μM; 14 days) inhibits the anchorage-independent sphere growth of SNU-484, SNU-668 and AGS human gastric cancer cells[3].
Bimiralisib (0.625-1.25 μM; 24 h) effectively inhibits the PI3K/mTOR signaling pathway in SNU-484 and AGS human gastric cancer cells by reducing the phosphorylation levels of AKT, mTOR and p70S6K. It also induces G1-phase cell cycle arrest in SNU-484 and AGS human gastric cancer cells and regulates the expression of G1-phase cell cycle regulatory proteins, specifically characterized by upregulated expression of E2F4, p107 and (in AGS cells) p21, and downregulated expression of Cyclin E[3].
Bimiralisib (0.625-1.25 μM; 48 h) inhibits the migratory capacity of human gastric cancer cells SNU-484 and AGS under low-serum (1% FBS) conditions; it regulates the expression of epithelial-mesenchymal transition-related markers in human gastric cancer cells SNU-484 and AGS, upregulating E-cadherin expression and downregulating vimentin expression[3].
Bimiralisib has IC50 values of 36 nM, 63 nM and 136 nM for PI3Kα-H1047R, PI3Kα-E542K and PI3Kα-E545K, respectively[4].
MedChemExpress (MCE) has not independently confirmed the accuracy of these methods. They are for reference only.
-
Cell Line:Susceptible AML cell lines (MOLM-13, mL-2, SKM-1, OCI-AML3), HS-5 bone marrow stroma cells
-
Concentration:1 μM alone or in combination with 100 nM Venetoclax
-
Incubation Time:20 h
-
Result:Reduced cytotoxic efficacy in AML cells due to bone marrow stroma protection: MOLM-13 cells were protected against the combination treatment.
SKM-1 cells were protected against bimiralisib single-agent and combination treatment.
mL-2 cells showed no specific protection against bimiralisib-containing treatments.
OCI-AML3 cells were protected against all venetoclax combination treatments including with bimiralisib.
-
Cell Line:human gastric cancer cell lines SNU-484, SNU-668, AGS
-
Concentration:0.312, 0.625, 1.25, 2.5, 5, 10, 20 μM
-
Incubation Time:72 h
-
Result:Reduced cell viability in a dose-dependent manner across all three cell lines.
Achieved IC50 values of 0.792 μM for SNU-484, 0.419 μM for SNU-668, and 0.611 μM for AGS cells.
-
Cell Line:human gastric cancer cell lines SNU-484, SNU-668, AGS
-
Concentration:0.312, 0.625, 1.25 μM
-
Incubation Time:8 days
-
Result:Suppressed clonogenic growth of SNU-484, SNU-668, and AGS human gastric cancer cells.
-
Cell Line:human gastric cancer cell lines SNU-484, AGS
-
Concentration:0.625, 1.25 μM
-
Incubation Time:24 h
-
Result:Markedly reduced phosphorylation of AKT (S473), mTOR (S2448), and p70S6K (T389) in both SNU-484 and AGS cells.
Left total levels of AKT and mTOR unchanged.\nIncreased expression of E2F4 and p107 in both cell lines.
Decreased Cyclin E expression in both cell lines.
Increased p21 expression in AGS cells, while p21 was barely detectable in SNU-484 cells.
-
Cell Line:human gastric cancer cell lines SNU-484, AGS
-
Concentration:0.625, 1.25 μM
-
Incubation Time:24 h
-
Result:Caused a significant accumulation of cells in the G1 phase in both SNU-484 and AGS cells.
Induced a corresponding decrease in the S phase population in both SNU-484 and AGS cells.
-
Cell Line:human gastric cancer cell lines SNU-484, AGS
-
Concentration:0.625, 1.25 μM
-
Incubation Time:48 h (1% FBS medium)
-
Result:Significantly delayed wound closure in a dose-dependent manner in both SNU-484 and AGS cells compared to untreated controls.
-
Cell Line:human gastric cancer cell lines SNU-484, AGS
-
Concentration:0.625, 1.25 μM
-
Incubation Time:48 h (1% FBS medium)
-
Result:Caused a dose-dependent increase in E-cadherin expression in both SNU-484 and AGS cells.
Induced a dose-dependent decrease in vimentin expression in both SNU-484 and AGS cells.
In Vivo
MedChemExpress (MCE) has not independently confirmed the accuracy of these methods. They are for reference only.
- RNA extraction experimental
- Cell migration
- Somatic Cell Culture
- Detection of Apoptosis
- TUNEL staining for apoptotic DNA fragmentation
- Flow cytometric DNA-content cell-cycle staining
- Cell Cytotoxicity Assay
- Apoptosis Solutions
- Cell invasion
- Soft Agar Colony Formation Assay
- MTT Cell Proliferation Assay
- Mammalian live/dead viability and cytotoxicity staining
- Annexin V plus membrane-impermeant dye apoptosis staining
- BrdU Incorporation Assay
- CFSE Dye Dilution Proliferation Assay
- Dye-dilution cell tracking and proliferation staining
- Protocol for Cell Cycle
- CCK-8/WST-8 Cell Proliferation Assay
- Cell Counting-Based Growth Curve Assay
- Colony Formation (Clonogenic) Assay
- Cell Viability Determination by MTT Colorimetric Assay
- EdU Incorporation Assay (Click Chemistry-Based DNA Synthesis Measurement)
- Ki-67 Immunostaining Proliferation Assay
- PCNA Immunodetection Proliferation Assay
- Protocol for Cell Counting and Cell Density Analysis
- Subcutaneous Cell-Line-Derived Xenograft
Essai clinique
| NCT Number | Sponsor | Condition | Start Date |
Phase
|
|---|---|---|---|---|
| NCT01329991 | Plexxikon| | 2011-05 | PHASE1 |


Chemical Information
-
CAS No. 1225037-39-7
-
Appearance Solid
-
Masse moléculaire 411.38
-
Formule C17H20F3N7O2
-
Color White to gray
-
SMILES
NC1=NC=C(C2=NC(N3CCOCC3)=NC(N4CCOCC4)=N2)C(C(F)(F)F)=C1
-
Synonyms
PQR309
-
Livraison
Room temperature in continental US; may vary elsewhere.
-
Stockage
Powder -20°C 3 years 4°C 2 years In solvent -80°C 2 years -20°C 1 year


Publications (5)
-
Journal Impact Factor
-
Most Recent
-
-
Leukemia
BET inhibitor-based combinations targeting novel dependencies in MECOM-rearranged (r) AML. [Abstract]2025 Dec 19. PMID: 41419608 -
Int J Mol Sci
Rationale for Combining the BCL2 Inhibitor Venetoclax with the PI3K Inhibitor Bimiralisib in the Treatment of IDH2- and FLT3-Mutated Acute Myeloid Leukemia. [Abstract]2022 Oct 20;23(20):12587. PMID: 36293442 -
Front Pharmacol
CC-223, NSC781406, and BGT226 Exerts a Cytotoxic Effect Against Pancreatic Cancer Cells via mTOR Signaling. [Abstract]2020 Nov 11:11:580407. PMID: 33343350 -
Eur J Immunol
Fibroblast transdifferentiation promotes conversion of M1 macrophages and replenishment of cardiac resident macrophages following cardiac injury in mice. [Abstract]2020 Jun;50(6):795-808. PMID: 32068249


Solvant et solubilité
In Vitro:
DMSO : ≥ 50 mg/mL (121.54 mM; Hygroscopic DMSO has a significant impact on the solubility of product, please use newly opened DMSO)
* "≥" means soluble, but saturation unknown.
Please refer to the solubility information to select the appropriate solvent. Once prepared, please aliquot and store the solution to prevent product inactivation from repeated freeze-thaw cycles.
Storage method and period of stock solution: -80°C, 2 years; -20°C, 1 year. When stored at -80°C, please use it within 2 years. When stored at -20°C, please use it within 1 year.
Please refer to the solubility information to select the appropriate solvent. Once prepared, please aliquot and store the solution to prevent product inactivation from repeated freeze-thaw cycles.
Storage method and period of stock solution: -80°C, 2 years; -20°C, 1 year. When stored at -80°C, please use it within 2 years. When stored at -20°C, please use it within 1 year.
Concentration (start) × Volume (start) = Concentration (final) × Volume (final)
In Vivo:
Select the appropriate dissolution method based on your experimental animal and administration route.
- For the following dissolution methods, please ensure to first prepare a clear stock solution using an In Vitro approach and then sequentially add co-solvents:
- To ensure reliable experimental results, the clarified stock solution can be appropriately stored based on storage conditions. As for the working solution for In Vivo experiments, it is recommended to prepare freshly and use it on the same day.
- The percentages shown for the solvents indicate their volumetric ratio in the final prepared solution. If precipitation or phase separation occurs during preparation, heat and/or sonication can be used to aid dissolution.
Add each solvent one by one: 10% DMSO 40% PEG300 5% Tween-80 45% Saline
Solubility: ≥ 2.5 mg/mL (6.08 mM); Clear solution
This protocol yields a clear solution of ≥ 2.5 mg/mL (saturation unknown).
Taking 1 mL working solution as an example, add 100 μL DMSO stock solution (25.0 mg/mL) to 400 μL PEG300, and mix evenly; then add 50 μL Tween-80 and mix evenly; then add 450 μL Saline to adjust the volume to 1 mL.
Preparation of Saline: Dissolve 0.9 g sodium chloride in ddH₂O and dilute to 100 mL to obtain a clear Saline solution.
Add each solvent one by one: 10% DMSO 90% (20% SBE-β-CD in Saline)
Solubility: ≥ 2.5 mg/mL (6.08 mM); Clear solution
This protocol yields a clear solution of ≥ 2.5 mg/mL (saturation unknown).
Taking 1 mL working solution as an example, add 100 μL DMSO stock solution (25.0 mg/mL) to 900 μL 20% SBE-β-CD in Saline, and mix evenly.
Preparation of 20% SBE-β-CD in Saline (4°C, storage for one week): 2 g SBE-β-CD powder is dissolved in 10 mL Saline, completely dissolve until clear.
In Vivo Dissolution Calculator
Please enter the basic information of animal experiments:
-
-
-
-
Recommended: Prepare an additional quantity of animals to account for potential losses during experiments.
Please enter your animal formula composition:
-
%DMSO +
Recommended: Keep the proportion of DMSO in working solution below 2% if your animal is weak.
-
%+
-
+%Tween-80 + +
-
%Saline +
The co-solvents required include: DMSO, . All of co-solvents are available by MedChemExpress (MCE). , Tween 80. All of co-solvents are available by MedChemExpress (MCE).
Working solution concentration: 0.22 mg/mL
Method for preparing stock solution: mg drug dissolved in μL DMSO. Stock solution concentration: mg/mL.
1. Take μL DMSO stock solution;
2. Add μL .
μL , mix evenly;
3. Then add μL Tween 80, mix evenly;
4. Then add μL
Please ensure that the stock solution in the first step is dissolved to a clear state, and add co-solvents in sequence. You can use ultrasonic heating (ultrasonic cleaner, recommended frequency 20-40 kHz), vortexing, etc. to assist dissolution.


Pureté et documentation
-
Fiche technique (298 KB)
-
SDS (394 KB)
- English - EN (394 KB)
- Français - FR (394 KB)
- Deutsch - DE (394 KB)
- Norwegian - NO (394 KB)
- Español - ES (394 KB)
- Swedish - SV (394 KB)
- Italian - IT (394 KB)
- Korean - KR (394 KB)
- Portuguese - PT (394 KB)
-
Instruction de manipulation (2659 KB)
Références
[2]. Seipel K, et al. Rationale for Combining the BCL2 Inhibitor Venetoclax with the PI3K Inhibitor Bimiralisib in the Treatment of IDH2- and FLT3-Mutated Acute Myeloid Leukemia. International journal of molecular sciences. 2022 Oct 20;23(20):12587. [Content Brief]
[3]. Noh YJ, et al. Bimiralisib suppresses proliferation and migration of gastric cancer cells PI3K/mTOR pathway inhibition. The Korean journal of physiology & pharmacology : official journal of the Korean Physiological Society and the Korean Society of Pharmacology. 2026 Jul 08. [Content Brief]


Complete Stock Solution Preparation Table
Please refer to the solubility information to select the appropriate solvent. Once prepared, please aliquot and store the solution to prevent product inactivation from repeated freeze-thaw cycles.
Storage method and period of stock solution: -80°C, 2 years; -20°C, 1 year. When stored at -80°C, please use it within 2 years. When stored at -20°C, please use it within 1 year.
| Optional Solvent | Concentration Solvent Mass | 1 mg | 5 mg | 10 mg | 25 mg |
|---|---|---|---|---|---|
| DMSO | 1 mM | 2.4308 mL | 12.1542 mL | 24.3084 mL | 60.7711 mL |
| 5 mM | 0.4862 mL | 2.4308 mL | 4.8617 mL | 12.1542 mL | |
| 10 mM | 0.2431 mL | 1.2154 mL | 2.4308 mL | 6.0771 mL | |
| 15 mM | 0.1621 mL | 0.8103 mL | 1.6206 mL | 4.0514 mL | |
| 20 mM | 0.1215 mL | 0.6077 mL | 1.2154 mL | 3.0386 mL | |
| 25 mM | 0.0972 mL | 0.4862 mL | 0.9723 mL | 2.4308 mL | |
| 30 mM | 0.0810 mL | 0.4051 mL | 0.8103 mL | 2.0257 mL | |
| 40 mM | 0.0608 mL | 0.3039 mL | 0.6077 mL | 1.5193 mL | |
| 50 mM | 0.0486 mL | 0.2431 mL | 0.4862 mL | 1.2154 mL | |
| 60 mM | 0.0405 mL | 0.2026 mL | 0.4051 mL | 1.0129 mL | |
| 80 mM | 0.0304 mL | 0.1519 mL | 0.3039 mL | 0.7596 mL | |
| 100 mM | 0.0243 mL | 0.1215 mL | 0.2431 mL | 0.6077 mL |


Bimiralisib Related Classifications
HY-12868 Related Classifications
 Powered by Bioz