



Tubulin/MMP-IN-2
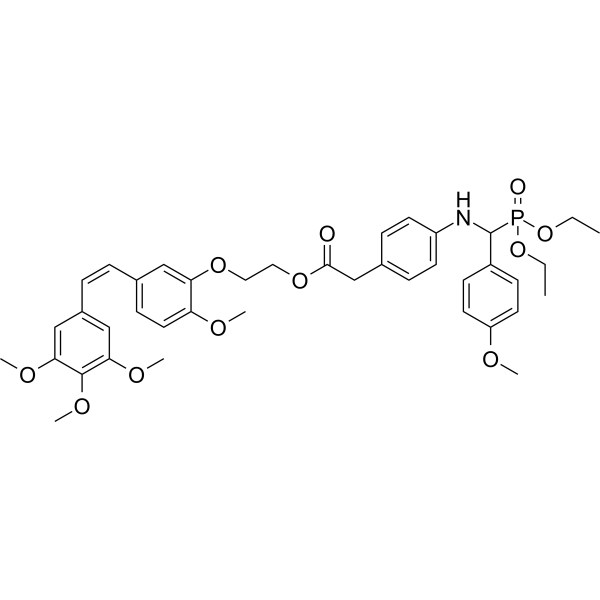
Tubulin/MMP-IN-2 is dual inhibitor of tubulin and matrix metalloproteinases. Tubulin/MMP-IN-2 can strongly inhibit tubulin polymerization and induces cell apoptosis. Tubulin/MMP-IN-2 has inhibitory activities against MMP-2, MMP-3 and MMP-9 with IC50 values of 24.95 μM, 31.60 μM and 22.37 μM, respectively. Tubulin/MMP-IN-2 can be used for the research of cancer.
For research use only. We do not sell to patients.
- CAS No.: 2734877-51-9
- Formula: C40H48NO11P
- Molecular Weight:749.78
-
Storage:
Please store the product under the recommended conditions in the Certificate of Analysis.

To place orders, for customer services and technical support, please contact: MedChemExpress USA
Tel: 609-228-6898 E-mail: [email protected] [email protected]


-
 Biological Activity
-
Chemical Information
- Protocols
- Purity & Documentation
- References
-
 Help & FAQs




Biological Activity
Description
IC50 & Target
IC50: 0.36 μM (HepG-2), 0.31 μM (HT29), 0.19 μM (A549), 0.42 μM (MGC-803), 10.45 μM (LO2 cells); 0.32 μM (SK-OV-3), 0.39 μM (SK-OV-3/CDDP), 0.27 μM (MCF-7), 0.25 μM (MCF-7/DOX); 24.95 μM (MMP-2), 31.60 μM (MMP-3), 22.37 μM (MMP-9)[1].
Cellular Effect
|
Cell Line

|
Type | Value | Description | References |
|---|---|---|---|---|
| A549 | IC50 |
0.19 μM
Compound: 9e
|
Antiproliferative activity against human A549 cells assessed as reduction in cell viability incubated for 72 hrs by MTT assay
Antiproliferative activity against human A549 cells assessed as reduction in cell viability incubated for 72 hrs by MTT assay
|
[PMID: 36252396] |
| HepG2 | IC50 |
0.36 μM
Compound: 9e
|
Antiproliferative activity against human HepG2 cells assessed as reduction in cell viability incubated for 72 hrs by MTT assay
Antiproliferative activity against human HepG2 cells assessed as reduction in cell viability incubated for 72 hrs by MTT assay
|
[PMID: 36252396] |
| HT-29 | IC50 |
0.31 μM
Compound: 9e
|
Antiproliferative activity against human HT-29 cells assessed as reduction in cell viability incubated for 72 hrs by MTT assay
Antiproliferative activity against human HT-29 cells assessed as reduction in cell viability incubated for 72 hrs by MTT assay
|
[PMID: 36252396] |
| L02 | IC50 |
10.45 μM
Compound: 9e
|
Cytotoxicity against human L02 cells assessed as reduction in cell viability incubated for 72 hrs by MTT assay
Cytotoxicity against human L02 cells assessed as reduction in cell viability incubated for 72 hrs by MTT assay
|
[PMID: 36252396] |
| MCF7 | IC50 |
0.27 μM
Compound: 9e
|
Antiproliferative activity against human MCF7 cells assessed as reduction in cell viability incubated for 72 hrs by MTT assay
Antiproliferative activity against human MCF7 cells assessed as reduction in cell viability incubated for 72 hrs by MTT assay
|
[PMID: 36252396] |
| MGC-803 | IC50 |
0.42 μM
Compound: 9e
|
Antiproliferative activity against human MGC-803 cells assessed as reduction in cell viability incubated for 72 hrs by MTT assay
Antiproliferative activity against human MGC-803 cells assessed as reduction in cell viability incubated for 72 hrs by MTT assay
|
[PMID: 36252396] |
| SK-OV-3 | IC50 |
0.32 μM
Compound: 9e
|
Antiproliferative activity against human SK-OV-3 cells assessed as reduction in cell viability incubated for 72 hrs by MTT assay
Antiproliferative activity against human SK-OV-3 cells assessed as reduction in cell viability incubated for 72 hrs by MTT assay
|
[PMID: 36252396] |
In Vitro
Tubulin/MMP-IN-2 (Compound 9e) (0.01-20 μM; 24 h) has activity for HepG-2, HT29, A549, MGC-803 and LO2 cells with IC50 values of 0.36 μM, 0.31 μM, 0.19 μM, 0.42 μM and 10.45 μM, respectively[1].
Tubulin/MMP-IN-2 has anti-proliferative activities for SK-OV-3, SK-OV-3/CDDP, MCF-7 and MCF-7/DOX cells with IC50 values of 0.32 μM, 0.39 μM, 0.27 μM and 0.25 μM, respectively[1].
Tubulin/MMP-IN-2 has inhibitory activities against MMP-2, MMP-3 and MMP-9 with IC50 values of 24.95 μM, 31.60 μM and 22.37 μM, respectively[1].
Tubulin/MMP-IN-2 (2.5, 5 Μm; 24 h) strongly inhibits tubulin polymerization, and induced cell apoptosis and cell cycle arrest in G2/M stage, remarkably displayed inhibition of cell migration against A549 cells in vitro[1].
Tubulin/MMP-IN-2 (2.5, 5 Μm; 24 h) can induce apoptosis via mitochondria-dependent apoptosis pathway[1].
Tubulin/MMP-IN-2 (2.5, 5 Μm; 24 h) can also cause ER stress demonstrating as up-regulation express of proteins (CHOP, p-elF2a, and p-PERK)[1].
MedChemExpress (MCE) has not independently confirmed the accuracy of these methods. They are for reference only. Further protocols information, click here.
-
Cell Line:HepG-2, HT-29, A549, MGC-803, SK-OV-3, MCF-7, SK-OV-3/CDDP, MCF-7/DOX and normal liver cells LO2
-
Concentration:0.01-20 μM
-
Incubation Time:72 h
-
Result:Exhibited the most potent activity against various human cancer cells as well as multidrug-resistant tumor cells (A549/CDDP and MCF-7/DOX) and also showed significantly lower cytotoxic activity toward human normal liver cells LO2.
-
Cell Line:A549 cells
-
Concentration:2.5, 5 μM
-
Incubation Time:24 h
-
Result:Significantly induced apoptosis after 24 h.
-
Cell Line:A549 cells
-
Concentration:2.5, 5 μM
-
Incubation Time:24 h
-
Result:Induced a concentration-dependent G2/M stage arrest of A549 cells.
-
Cell Line:A549 cells
-
Concentration:2.5, 5 μM
-
Incubation Time:24 h
-
Result:Remarkably induced changes in cell morphology, such as loss of membrane protrusions, disrupted microtubule organization and microtubule depolymerization, respectively.
-
Cell Line:A549 cells
-
Concentration:2.5, 5 μM
-
Incubation Time:24 h
-
Result:Increased the accumulation of CHOP, p-eIF2a and p-PERK.
Promoted the expression of pro-apoptotic protein (Bax), and regulated down the level of anti-apoptotic protein (Bcl-2).
Increased the levels of caspase-3.
Lead p53 obviously up-regulated in a concentration-dependent manner.
-
Cell Line:A549 cells
-
Concentration:2.5, 5 μM
-
Incubation Time:24 h
-
Result:Significantly reduced cell migration in a dose-dependent manner.
In Vivo
MedChemExpress (MCE) has not independently confirmed the accuracy of these methods. They are for reference only.
-
Animal Model:BALB/c nude mice[1]
-
Dosage:15, 30 mg/kg
-
Administration:Every two days for three weeks
-
Result:Exhibited a dose-dependent inhibitory effect on tumor growth.
Exhibited no obvious histopathological changes for the main organ tissues (e.g. heart, liver, spleen, lung and kidney).


Chemical Information
-
CAS No. 2734877-51-9
-
Molecular Weight 749.78
-
Formula C40H48NO11P
-
SMILES
CCOP(OCC)(C(C1=CC=C(C=C1)OC)NC2=CC=C(C=C2)CC(OCCOC3=CC(/C=C\C4=CC(OC)=C(C(OC)=C4)OC)=CC=C3OC)=O)=O
-
Shipping
Room temperature in continental US; may vary elsewhere.
-
Storage
Please store the product under the recommended conditions in the Certificate of Analysis.

Protocols
-
Mitochondrial membrane-potential fluorescent assay
Mitochondrial membrane potential fluorescent assays estimate ΔΨm in living cells using lipophilic cationic dyes such as TMRM, TMRE, rhodamine 123, and JC-1, which accumulate in mitochondria according to membrane polarization; loss of signal after FCCP or CCCP treatment is interpreted as mitochondrial depolarization. TMRM/TMRE and rhodamine 123 are commonly used for semi-quantitative live-cell microscopy or flow cytometry, while JC-1 can report a shift from red aggregate fluorescence to green monomer fluorescence during depolarization; interpretation requires controls because dye concentration, quenching mode, cell type, dye efflux, and mitochondrial mass can affect fluorescence independently of ΔΨm.
-
Apoptosis
Apoptosis, also called programmed cell death, is generally characterized by distinct morphological characteristics.
-
TUNEL staining for apoptotic DNA fragmentation
TUNEL staining detects DNA strand breaks by using terminal deoxynucleotidyl transferase to add labeled nucleotides to exposed 3′-OH DNA termini, generating either microscopic staining in fixed cells or tissue sections, or fluorescence/cytometric signal in cell suspensions. TUNEL positivity reflects DNA fragmentation but should not be interpreted alone as definitive apoptosis, because TUNEL can also label necrotic, autolytic, mechanically damaged, or DNA-repair-associated DNA breaks.
-
Cell Cytotoxicity Assay
Cytotoxicity assays are usually based on the assessment of cell membrane damage, which can also be indirectly detected by measuring cell viability. Detection methods include MTT assay, CKK-8 assay, LDH assay and ATP assay, etc.
-
Annexin V plus membrane-impermeant dye apoptosis staining
Annexin V-based apoptosis assays rely on the detection of phosphatidylserine (PS) externalization from the inner leaflet of the plasma membrane to the outer leaflet, an early biochemical hallmark of apoptosis. Fluorescently labeled Annexin V binds PS in a calcium-dependent manner, enabling identification of early apoptotic cells by flow cytometry or fluorescence microscopy. When combined with a membrane-impermeant DNA-binding dye (e. g. , propidium iodide), this approach allows discrimination between viable (Annexin V−/dye−), early apoptotic (Annexin V+/dye−), and late apoptotic or necrotic (Annexin V+/dye+) cell populations by assessing membrane integrity and PS exposure.
-
Mitochondrial membrane-potential and mitochondrial mass staining
Mitochondrial membrane potential staining measures the electrochemical polarization across the mitochondrial inner membrane in live cells using lipophilic cationic fluorescent probes; early rhodamine-based work showed that selective mitochondrial dye accumulation is lost when the mitochondrial transmembrane potential is dissipated. JC-1 reports mitochondrial polarization by shifting from green monomer fluorescence to red J-aggregate fluorescence as dye concentration increases within energized mitochondria; therefore, the red/green fluorescence ratio is used as a relative readout of mitochondrial membrane potential. TMRE or TMRM staining provides a single-channel relative readout because these cationic rhodamine esters accumulate in polarized mitochondria, and lower fluorescence indicates reduced mitochondrial polarization when acquisition and dye-loading conditions are controlled. Mitochondrial mass staining is commonly performed with MitoTracker Green FM or related MitoTracker dyes as
-
Apoptosis Solutions
Apoptosis is a regulated, generally non-lytic cell-death pathway that removes unwanted, damaged, infected, or abnormal cells through coordinated morphological changes, caspase activation, DNA fragmentation, and membrane remodeling. The intrinsic apoptosis pathway is controlled mainly by mitochondrial outer membrane permeabilization, BCL-2 family proteins, cytochrome c release, apoptosome formation, caspase-9 activation, and downstream executioner caspase-3/7 activation. The extrinsic apoptosis pathway is initiated by death receptors such as Fas, TNFR, and TRAIL receptors, which recruit adaptor proteins and activate caspase-8 before engaging executioner caspases or mitochondrial amplification through BID cleavage. Apoptosis is linked to many phenotypes, including cancer cell killing, tissue homeostasis, immune regulation, neurodegeneration, infection response, and treatment-induced cytotoxicity; unresolved questions include how apoptosis interacts with necroptosis, pyroptosis, ferroptos


Purity & Documentation
References

Calculators
Concentration (start) × Volume (start) = Concentration (final) × Volume (final)


Tubulin/MMP-IN-2 Related Classifications
HY-152030 Related Classifications
 Powered by Bioz