



DCVJ

Based on 1 Customer Validation
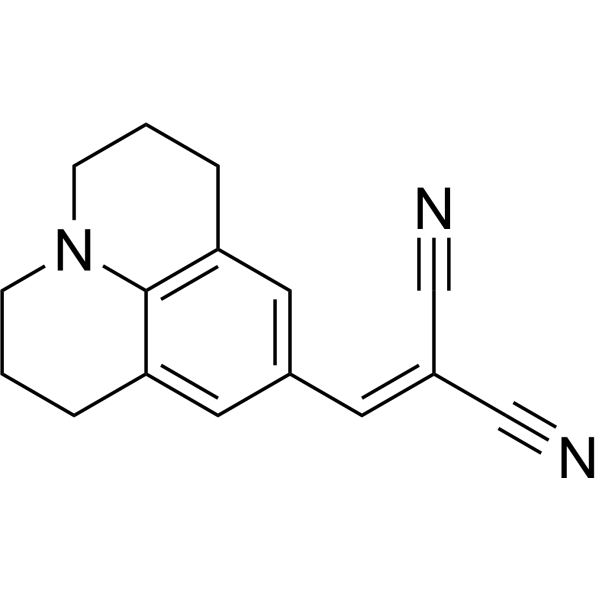
DCVJ (9-(2,2-Dicyanovinyl)julolidine), a molecular rotor and unique fluorescent dye, binds to tubulin and actin, and increases its fluorescence intensity drastically upon polymerization. DCVJ also binds to phospholipid bilayers and increases its fluorescence intensity. DCVJ can detect the kinetic process of degranulation of mast cells (Absorption/emission=489/505 nm).
Nur für Forschungszwecke. Wir verkaufen nicht an Patienten.
- Reinheit : 99.41%
- CAS. Nr.: 58293-56-4
- Formel: C16H15N3
- Molecular Weight:249.31
-
Speicherung:
4°C, protect from light
* In solvent : -80°C, 6 months; -20°C, 1 month (protect from light)

To place orders, for customer services and technical support, please contact: MedChemExpress USA
Tel: 609-228-6898 E-mail: [email protected] [email protected]


-
 Biologische Aktivität
-
Chemical Information
-
Lösungsmittel & Löslichkeit
- Reinheit & Dokumentation
- Verweise
-
 Help & FAQs




Biologische Aktivität
Beschreibung
In Vitro
Guide (The following is our recommended protocol. This protocol is only a guide and should be modified according to your specific needs).
DCVJ Monitoring the Kinetic Process of Mast Cell Degranulation
[2]1. Materials
DCVJ: Used to label cells and monitor their degranulation process.
Fluo-3-AM: Used to label intracellular calcium ions.
Cytochalasin D: Primarily interferes with the function of the cytoskeleton by inhibiting the polymerization of actin.
Compound 48/80: Used to stimulate mast cell degranulation.
2. Experimental Procedure
Cell Preparation
(1) Mast cells were isolated from the peritoneal cavity of Wistar rats and purified using a bovine serum albumin gradient.
(2) Cells were resuspended in Hepes buffer (pH 7.4), and cell viability was checked by trypan blue exclusion, ensuring >95% viability.
Confocal Fluorescence Microscopy Observation
Cells were imaged using a confocal fluorescence microscope, observing DCVJ-labeled mast cells. Excitation wavelength was 488 nm, and fluorescence emission was observed above 515 nm. The temperature of the observation chamber was maintained at 37°C.
Stimulation Process
DCVJ-labeled mast cells were stimulated with Compound 48/80 (12.5 μg/mL) for degranulation.
Fluorescence images were collected every 10 seconds to observe changes in cell fluorescence intensity, while also measuring changes in calcium ion concentrations in Fluo-3-labeled mast cells.
DCVJ Monitoring Early Aggregation Dynamics of Amyloid β Peptides[3]
3. Data Analysis
Fluorescence Intensity Analysis:
After imaging, fluorescence intensity changes were measured to quantitatively analyze the changes in intracellular calcium ion concentration and the increase in DCVJ fluorescence intensity during the mast cell degranulation process. Fluorescence intensity changes reflect key dynamic changes during the degranulation process.
(1) Quantitative analysis of fluorescence intensity in each frame using image processing software (such as ImageJ), and plotting the fluorescence intensity versus time to reveal the timing and dynamics of the degranulation process.
(2) Compare fluorescence changes between DCVJ-labeled and Fluo-3-labeled cells to analyze the relationship between calcium ion concentration changes and the increase in DCVJ fluorescence intensity, further understanding the role of calcium ion signaling in degranulation.
(3) Analyze the effect of interfering with the cytoskeleton by Cytochalasin D by comparing DCVJ fluorescence intensity changes. If DCVJ fluorescence changes are significantly inhibited by Cytochalasin D, it indicates that the dynamics of the cytoskeleton are essential for the degranulation process.
1. Materials
DCVJ
Amyloid β (Aβ40 and Aβ42)
Epigallocatechin-3-gallate (EGCG)
2. Experimental Procedure
DCVJ Fluorescence Measurement
(1) Monitor the aggregation dynamics of Amyloid β (Aβ) peptides, especially the formation of early oligomers, using DCVJ fluorescence.
(2) Add Ab40 (80 μM) or Ab42 solution to the DCVJ solution, with final concentrations of 8 μM Ab and 1 μM DCVJ.
(3) Perform the experiment at 37°C, and continuously stir the solution.
(4) Set the excitation wavelength to 465 nm, with an emission range of 480-600 nm, and measure the fluorescence intensity every 4 minutes (for Aβ42) or 10 minutes (for Aβ40) during the aggregation process.
Time-Resolved Fluorescence Measurement
Further analyze the dynamic behavior of DCVJ in Ab aggregates by exploring its molecular rotation limitations through time-resolved fluorescence decay curves.
(1) Set the laser source: Use a 1064 nm laser pulse with a pulse width of 100 ps and a frequency of 76 MHz.
(2) Excitation source: Use a 460 nm wavelength laser for fluorescence excitation.
(3) Fluorescence detection: Monitor fluorescence decay at 510 nm (monomer peak) and 575 nm (excited-state peak).
(4) Time-resolved data collection: Use a TCSPC system to record time-domain polarization fluorescence decay data and analyze the fluorescence lifetime changes in Aβ40 monomers and oligomers.
Atomic Force Microscopy (AFM) Imaging
Use AFM imaging to observe the morphology of Aβ aggregates, validate the reliability of DCVJ fluorescence data, and provide direct evidence for the structural analysis of aggregates.
(1) Sample preparation: Place 20 μL of Aβ peptide solution (WT Aβ40, WT Aβ42, or F4C F19W mutant) onto freshly cleaved mica sheets and incubate for 30 minutes.
(2) Sample drying: Remove excess liquid and dry overnight.
(3) Imaging: Use a Cypher S atomic force microscope to capture images and observe the morphology of Ab aggregates at different time points.
3. Data Analysis
Fluorescence Intensity Analysis:
DCVJ fluorescence intensity changes during the aggregation process of Aβ. After imaging, the fluorescence intensity values were extracted and plotted as a time-fluorescence intensity curve to reveal the time dynamics of Aβ peptide aggregation, especially the formation and maturation of oligomers.
(1) Analyze the fluorescence intensity at each time point using image processing software and generate the corresponding time-fluorescence intensity curve.
(2) Further calculate the aggregation rates of Aβ40 and Aβ42 and compare fluorescence changes at different time points.
Time-Resolved Fluorescence Lifetime Analysis:
Through time-resolved fluorescence measurements, record the fluorescence lifetime changes of DCVJ, particularly the effect of different forms of Ab peptides during aggregation.
(1) Compare the fluorescence lifetime of Aβ40 monomers and oligomers, and analyze the binding modes of DCVJ with Aβ peptides.
(2) Analyze the lifetime changes to understand the dynamics of oligomer formation and maturation.
AFM Imaging Data Analysis:
After AFM imaging, analyze the morphology changes of Ab aggregates, and observe the correlation between the formation of oligomers and fibers and fluorescence intensity changes.
(1) Use AFM image analysis software to measure the size, morphology, and distribution of aggregates and compare them with fluorescence intensity changes.
(2) Validate the reliability of fluorescence data and understand the structural changes of aggregates.
MedChemExpress (MCE) has not independently confirmed the accuracy of these methods. They are for reference only.


Chemical Information
-
CAS. Nr. 58293-56-4
-
Appearance Solid
-
Molecular Weight 249.31
-
Formel C16H15N3
-
Color Light brown to brown
-
SMILES
N#C/C(C#N)=C/C1=CC(CCCN2CCC3)=C2C3=C1
-
Synonyms
9-(2,2-Dicyanovinyl)julolidine
-
Versand
Room temperature in continental US; may vary elsewhere.
-
Speicherung
4°C, protect from light
* In solvent : -80°C, 6 months; -20°C, 1 month (protect from light)


Lösungsmittel & Löslichkeit
In Vitro:
DMSO : 62.5 mg/mL (250.69 mM; Need ultrasonic; Hygroscopic DMSO has a significant impact on the solubility of product, please use newly opened DMSO)
Please refer to the solubility information to select the appropriate solvent. Once prepared, please aliquot and store the solution to prevent product inactivation from repeated freeze-thaw cycles.
Storage method and period of stock solution: -80°C, 6 months; -20°C, 1 month (protect from light). When stored at -80°C, please use it within 6 months. When stored at -20°C, please use it within 1 month.
Please refer to the solubility information to select the appropriate solvent. Once prepared, please aliquot and store the solution to prevent product inactivation from repeated freeze-thaw cycles.
Storage method and period of stock solution: -80°C, 6 months; -20°C, 1 month (protect from light). When stored at -80°C, please use it within 6 months. When stored at -20°C, please use it within 1 month.
Konzentration (Stammlösung) × Volumen (Stammlösung) = Konzentration (Ziellösung) × Volumen (Ziellösung)


Reinheit & Dokumentation
-
Data Sheet (282 KB)
-
SDS (480 KB)
- English - EN (480 KB)
- Français - FR (480 KB)
- Deutsch - DE (480 KB)
- Norwegian - NO (480 KB)
- Español - ES (480 KB)
- Swedish - SV (480 KB)
- Italian - IT (480 KB)
- Korean - KR (480 KB)
- Portuguese - PT (480 KB)
-
Handling Instructions (2659 KB)
Verweise
[1]. Furuno T, et al. A fluorescent molecular rotor probes the kinetic process of degranulation of mast cells. Immunol Lett. 1992;33(3):285-288. [Content Brief]
[2]. Haidekker MA, et al. New fluorescent probes for the measurement of cell membrane viscosity. Chem Biol. 2001 Feb;8(2):123-31. [Content Brief]
[3]. Nagarajan S, et al. Fluorescent Probe DCVJ Shows High Sensitivity for Characterization of Amyloid β-Peptide Early in the Lag Phase. Chembiochem. 2017 Nov 16;18(22):2205-2211. [Content Brief]


Complete Stock Solution Preparation Table
Please refer to the solubility information to select the appropriate solvent. Once prepared, please aliquot and store the solution to prevent product inactivation from repeated freeze-thaw cycles.
Storage method and period of stock solution: -80°C, 6 months; -20°C, 1 month (protect from light). When stored at -80°C, please use it within 6 months. When stored at -20°C, please use it within 1 month.
| Optional Solvent | Concentration Solvent Mass | 1 mg | 5 mg | 10 mg | 25 mg |
|---|---|---|---|---|---|
| DMSO | 1 mM | 4.0111 mL | 20.0554 mL | 40.1107 mL | 100.2768 mL |
| 5 mM | 0.8022 mL | 4.0111 mL | 8.0221 mL | 20.0554 mL | |
| 10 mM | 0.4011 mL | 2.0055 mL | 4.0111 mL | 10.0277 mL | |
| 15 mM | 0.2674 mL | 1.3370 mL | 2.6740 mL | 6.6851 mL | |
| 20 mM | 0.2006 mL | 1.0028 mL | 2.0055 mL | 5.0138 mL | |
| 25 mM | 0.1604 mL | 0.8022 mL | 1.6044 mL | 4.0111 mL | |
| 30 mM | 0.1337 mL | 0.6685 mL | 1.3370 mL | 3.3426 mL | |
| 40 mM | 0.1003 mL | 0.5014 mL | 1.0028 mL | 2.5069 mL | |
| 50 mM | 0.0802 mL | 0.4011 mL | 0.8022 mL | 2.0055 mL | |
| 60 mM | 0.0669 mL | 0.3343 mL | 0.6685 mL | 1.6713 mL | |
| 80 mM | 0.0501 mL | 0.2507 mL | 0.5014 mL | 1.2535 mL | |
| 100 mM | 0.0401 mL | 0.2006 mL | 0.4011 mL | 1.0028 mL |


DCVJ Related Classifications
HY-D1425 Related Classifications
 Powered by Bioz