



PLK1-IN-4
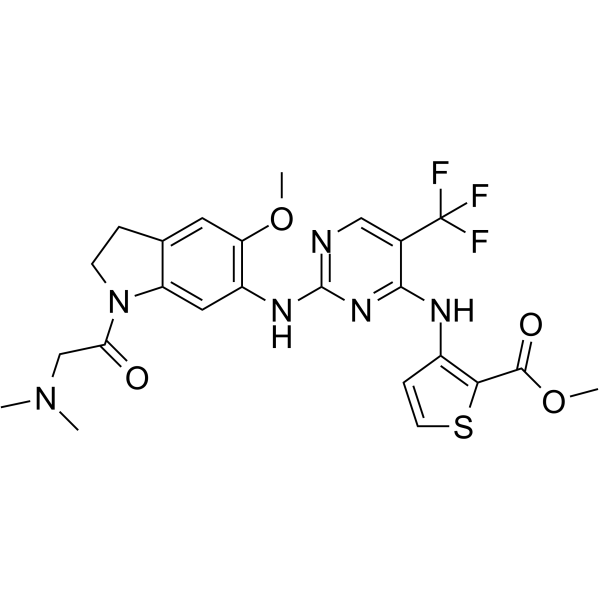
PLK1-IN-4 is a potent and selective PLK1 inhibitor with IC50 < 0.508 nM. PLK1-IN-4 has broad antiproliferative activity against a variety of cancer cell lines. PLK1-IN-4 induces mitotic arrest at the G2/M phase checkpoint, leading to cancer cell apoptosis. PLK1-IN-4 can be used for researching hepatocellular carcinoma.
For research use only. We do not sell to patients.
- CAS No.: 2622273-55-4
- Formula: C24H25F3N6O4S
- Molecular Weight:550.55
-
Storage:
Please store the product under the recommended conditions in the Certificate of Analysis.

To place orders, for customer services and technical support, please contact: MedChemExpress USA
Tel: 609-228-6898 E-mail: [email protected] [email protected]


-
 Biological Activity
-
Chemical Information
- Protocols
- Purity & Documentation
- References
-
 Help & FAQs




Biological Activity
Description
IC50 & Target
IC50:< 0.508 nM (PLK1) [1]
Cellular Effect
|
Cell Line

|
Type | Value | Description | References |
|---|---|---|---|---|
| A-375 | IC50 |
346.9 nM
Compound: 31
|
Antiproliferative activity against human A-375 cells assessed as inhibition of cell growth incubated for 48 hrs by MTS assay
Antiproliferative activity against human A-375 cells assessed as inhibition of cell growth incubated for 48 hrs by MTS assay
|
[PMID: 32814244] |
| A549 | IC50 |
556.8 nM
Compound: 31
|
Antiproliferative activity against human A549 cells assessed as inhibition of cell growth incubated for 48 hrs by MTS assay
Antiproliferative activity against human A549 cells assessed as inhibition of cell growth incubated for 48 hrs by MTS assay
|
[PMID: 32814244] |
| DU-145 | IC50 |
200.9 nM
Compound: 31
|
Antiproliferative activity against human DU-145 cells assessed as inhibition of cell growth incubated for 48 hrs by MTS assay
Antiproliferative activity against human DU-145 cells assessed as inhibition of cell growth incubated for 48 hrs by MTS assay
|
[PMID: 32814244] |
| HCT-116 | IC50 |
259.5 nM
Compound: 31
|
Antiproliferative activity against human HCT-116 cells assessed as inhibition of cell growth incubated for 48 hrs by MTS assay
Antiproliferative activity against human HCT-116 cells assessed as inhibition of cell growth incubated for 48 hrs by MTS assay
|
[PMID: 32814244] |
| HeLa | IC50 |
507.9 nM
Compound: 31
|
Antiproliferative activity against human HeLa cells assessed as inhibition of cell growth incubated for 48 hrs by MTS assay
Antiproliferative activity against human HeLa cells assessed as inhibition of cell growth incubated for 48 hrs by MTS assay
|
[PMID: 32814244] |
| HepG2 | IC50 |
11.1 nM
Compound: 31
|
Antiproliferative activity against human HepG2 cells assessed as inhibition of cell growth incubated for 48 hrs by MTS assay
Antiproliferative activity against human HepG2 cells assessed as inhibition of cell growth incubated for 48 hrs by MTS assay
|
[PMID: 32814244] |
| HT-29 | IC50 |
216 nM
Compound: 31
|
Antiproliferative activity against human HT-29 cells assessed as inhibition of cell growth incubated for 48 hrs by MTS assay
Antiproliferative activity against human HT-29 cells assessed as inhibition of cell growth incubated for 48 hrs by MTS assay
|
[PMID: 32814244] |
| JeKo-1 | IC50 |
70.4 nM
Compound: 31
|
Antiproliferative activity against human JeKo-1 cells assessed as inhibition of cell growth incubated for 48 hrs by MTS assay
Antiproliferative activity against human JeKo-1 cells assessed as inhibition of cell growth incubated for 48 hrs by MTS assay
|
[PMID: 32814244] |
| K562 | IC50 |
254.3 nM
Compound: 31
|
Antiproliferative activity against human K562 cells assessed as inhibition of cell growth incubated for 48 hrs by MTS assay
Antiproliferative activity against human K562 cells assessed as inhibition of cell growth incubated for 48 hrs by MTS assay
|
[PMID: 32814244] |
| KARPAS-299 | IC50 |
19.9 nM
Compound: 31
|
Antiproliferative activity against human KARPAS-299 cells assessed as inhibition of cell growth incubated for 48 hrs by MTS assay
Antiproliferative activity against human KARPAS-299 cells assessed as inhibition of cell growth incubated for 48 hrs by MTS assay
|
[PMID: 32814244] |
| L02 | IC50 |
91.8 nM
Compound: 31
|
Antiproliferative activity against human LO2 cells assessed as inhibition of cell growth incubated for 48 hrs by MTS assay
Antiproliferative activity against human LO2 cells assessed as inhibition of cell growth incubated for 48 hrs by MTS assay
|
[PMID: 32814244] |
| MDA-MB-231 | IC50 |
953.5 nM
Compound: 31
|
Antiproliferative activity against human MDA-MB-231 cells assessed as inhibition of cell growth incubated for 48 hrs by MTS assay
Antiproliferative activity against human MDA-MB-231 cells assessed as inhibition of cell growth incubated for 48 hrs by MTS assay
|
[PMID: 32814244] |
| SMMC-7721 | IC50 |
70.9 nM
Compound: 31
|
Antiproliferative activity against human SMMC-7721 cells assessed as inhibition of cell growth incubated for 48 hrs by MTS assay
Antiproliferative activity against human SMMC-7721 cells assessed as inhibition of cell growth incubated for 48 hrs by MTS assay
|
[PMID: 32814244] |
In Vitro
PLK1-IN-4 (compound 31) (0-5 μM; 48 hours) exhibits excellent antiproliferative activities against HCC cells[1].
PLK1-IN-4 (60 and 100 nM; 24 hours) induces abnormal spindle formation in HepG2 and HT-29 cells[1].
PLK1-IN-4 (10-300 nM; 0-48 hours) induces apoptosis in cancer cells through G2/M arrest[1].
PLK1-IN-4 (0-120 nM; 24 hours) increases phosphorylation of PLK1, histone H3 and NPM and decreases phosphorylation of Cdc2 in a dose-dependent manner[1].
MedChemExpress (MCE) has not independently confirmed the accuracy of these methods. They are for reference only.
-
Cell Line:MDA-MB-231, HeLa, HCT 116, HT-29, HepG2, SMMC7721, A549 ,JeKo-1,K562, Karpas299, A375, DU-145 and L02[1]
-
Concentration:0-5 μM
-
Incubation Time:48 hours
-
Result:Exhibited excellent antiproliferative activities against HCC cells, with IC50s of 11.1 nM and 70.9 nM in HepG2 and SMMC7721 cells.
-
Cell Line:HepG2[1]
-
Concentration:10, 30, 60, 100 and 300 nM
-
Incubation Time:0, 12, 24, 36 and 48 hours
-
Result:Induced apoptosis in cancer cells through G2/M arrest.
-
Cell Line:HepG2[1]
-
Concentration:0, 10, 30, 60, 90 and 120 nM
-
Incubation Time:24 hours
-
Result:Increased phosphorylation of PLK1, histone H3 and NPM and decreased phosphorylation of Cdc2 in a dose-dependent manner.
In Vivo
PLK1-IN-4 (30 mg/kg; tail vein injection; once or twice daily, for 12 days) suppresses tumor growth in a dose dependent manner[1].
Pharmacokinetic Parameters of PLK1-IN-4 in male ICR mouse[1].
| IV (5 mg/kg) | |
| C0 (ng/mL) | 1790 |
| T1/2 (h) | 1.47 |
| MRT0-inf (h) | 0.808 |
| MRT0-t (h) | 0.704 |
| AUC0-t (ng·h/mL) | 767 |
| AUC0-inf (ng·h/mL) | 776 |
| CL (mL/min/kg) | 107 |
| VdSS (L/kg) | 107 |
MedChemExpress (MCE) has not independently confirmed the accuracy of these methods. They are for reference only.
-
Animal Model:Male nu/nu BALB/c mice (4-6 weeks; injected with HepG2 cells)[1]
-
Dosage:30 mg/kg
-
Administration:Tail vein injection; once or twice daily, for 12 days
-
Result:Suppressed tumor growth in a dose dependent manner, and the tumor growth inhibition (TGI) values were 120.0% and 135.2% at doses of 30 mg/kg once daily and 30 mg/kg twice daily, respectively.
-
Animal Model:ICR mouse[1]
-
Dosage:5 mg/kg
-
Administration:IV; single (Pharmacokinetics Analysis)
-
Result:Exhibited a short half-life (T1/2) of 1.47 h, moderate exposure with an area under the curve (AUC0-inf) of 776 ng·h/mL and volume of distribution at steady state (Vdss) of 5.21 L/kg.


Chemical Information
-
CAS No. 2622273-55-4
-
Molecular Weight 550.55
-
Formula C24H25F3N6O4S
-
SMILES
COC1=C(C=C2C(CCN2C(CN(C)C)=O)=C1)NC3=NC=C(C(NC4=C(SC=C4)C(OC)=O)=N3)C(F)(F)F
-
Shipping
Room temperature in continental US; may vary elsewhere.
-
Storage
Please store the product under the recommended conditions in the Certificate of Analysis.


Purity & Documentation
References

Calculators
Concentration (start) × Volume (start) = Concentration (final) × Volume (final)


PLK1-IN-4 Related Classifications
HY-146792 Related Classifications
 Powered by Bioz