



SC912

Based on 1 Customer Validation
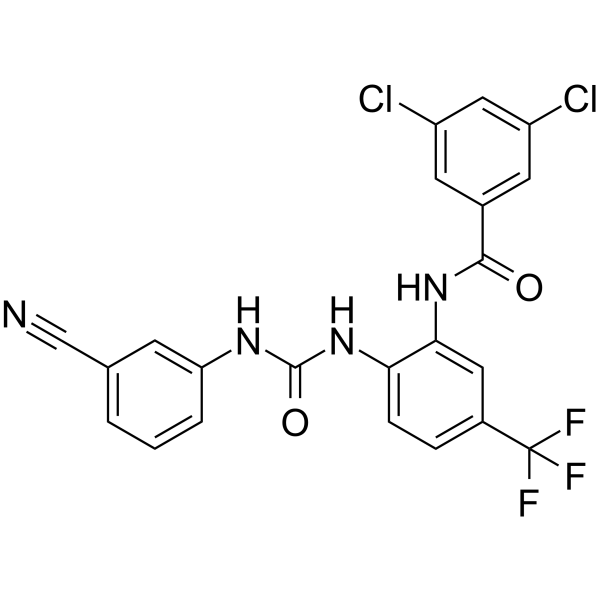
SC912 is an AR-V7 inhibitor (IC50 = 0.36 μM). SC912 possesses safety, potency and selectivity. SC912 binds directly to AR-FL and AR-V7 proteins, inhibites nuclear localization and chromatin binding capabilities. SC912 exerts anticancer activity through inhibition of proliferation, induction of cell cycle arrest and apoptosis.
Nos produits utilisent uniquement pour la recherche. Nous ne vendons pas aux patients.
- Pureté : 99.13%
- Formule: C22H13Cl2F3N4O2
- Masse moléculaire:493.27
-
Stockage:Powder -20°C, 3 years , 4°C, 2 years ; In solvent -80°C, 6 months , -20°C, 1 month

To place orders, for customer services and technical support, please contact: MedChemExpress USA
Tel: 609-228-6898 E-mail: [email protected] [email protected]


-
 Activité biologique
-
Chemical Information
-
Solvant et solubilité
- Protocole
- Pureté et documentation
- Références
-
 Help & FAQs




Activité biologique
Description
In Vitro
SC912 (0.1-10 μM; 24 h) effectively inhibits AR activation in PC3 Cells. No inhibition of GR and PR (AR IC50 = 0.57 μM)[1].
SC912 (0.03-100 μM; 1 h) binding to AR-FL and AR-V7 is attenuated in 293 T cells deleted for AR-NTD amino acids 507-531. Amino acids 507-531 are essential for the antagonistic activity[1].
SC912 (2 μM; 24 h) strongly represses the transcription of AR-regulated genes (PSA, FKBP5, TMPRSS2) that are uniquely regulated by AR-V7 in the LNCaP95 cell model, suggesting effective repression of AR-V7-mediated transcriptional activity[1].
SC912 (1 μM; 24 h) leads to G1 phase blockade and causes apoptosis in LNCaP, VCaP and 22Rv1 cells[1].
SC912 (3 μM; 5 h) significantly reduces the intranuclear accumulation of AR-FL and AR-V7 in LNCaP and LNCaP-AR-V7 cells, suggesting that is able to effectively block the nuclear localization of AR-V7. SC912 also significantly reducs the binding of AR proteins to the chromatin[1].
MedChemExpress (MCE) has not independently confirmed the accuracy of these methods. They are for reference only.
-
Cell Line:LNCaP, VCaP, 22Rv1cell, PC3
-
Concentration:1 μM
-
Incubation Time:24 h
-
Result:SC912 led to significant PARP cleavage in LNCaP, VCaP, and 22Rv1 cells, indicating effective induction of apoptosis. Flow cytometry analysis showed an increase in the percentage of apoptotic cells in LNCaP, VCaP, and 22Rv1 cell lines with SC912. This further supported the finding that SC912 induces apoptosis effectively in AR-positive cells.
-
Cell Line:LNCaP, VCaP, 22Rv1
-
Concentration:0, 0.1, 0.3, 1, 3 μM
-
Incubation Time:24 h
-
Result:SC912-dependent dose (0.33 μM) impaired the transcription of AR-regulated genes (PSA, FKBP5 and TMPRSS2) in these prostate cancer cell lines.This indicates effective inhibition of AR signaling by SC912. The inhibition of gene expression was dose-dependent.
-
Cell Line:LNCaP, VCaP, 22Rv1cell, PC3
-
Concentration:3 μM
-
Incubation Time:48 h
-
Result:Induced a significant G1/S phase arrest in the treated cells. This effect was dose-dependent, with higher concentrations of SC912 leading to a more pronounced accumulation of cells in the G1 phase, suggesting a blockade in the transition from G1 to S phase.
In Vivo
SC912 (90 mg/kg; i.p.; 5 days a week for 3 weeks) alleviates tumor progression even in this highly castration-resistant 22Rv1 model[1].
MedChemExpress (MCE) has not independently confirmed the accuracy of these methods. They are for reference only.
-
Animal Model:NOD-SCID mice implanted with VCaP cells [1]
-
Dosage:60 mg/kg, five times a week for 3 weeks
-
Administration:i.p.
-
Result:SC912 was found to effectively repress tumor growth in the xenograft models. This was evidenced by a marked reduction in tumor size in mice treated with SC912 compared to those treated with vehicle controls. The serum levels of human PSA, a marker of AR activity, were considerably lower , indicating effective inhibition of AR signaling.
-
Animal Model:mice implanted with 22Rv1 cells [1]
-
Dosage:90 mg/kg, five times a week for 3 weeks
-
Administration:i.p.
-
Result:SC912 markedly mitigated tumor progression in this highly castration-resistant 22Rv1 model. The growth rate of tumors was significantly reduced in the SC912-treated group compared to the vehicle-treated controls. Reduction in tumor size was associated with a significant decrease in AR-driven gene expression within the tumors, highlighting SC912’s capability to interrupt AR-V7-mediated signaling pathways even under high AR-V7 expressing conditions.


Chemical Information
-
Appearance Solid
-
Masse moléculaire 493.27
-
Formule C22H13Cl2F3N4O2
-
Color White to off-white
-
SMILES
N#CC1=CC=CC(NC(NC2=CC=C(C(F)(F)F)C=C2NC(C3=CC(Cl)=CC(Cl)=C3)=O)=O)=C1
-
Livraison
Room temperature in continental US; may vary elsewhere.
-
Stockage
Powder -20°C 3 years 4°C 2 years In solvent -80°C 6 months -20°C 1 month


Solvant et solubilité
In Vitro:
DMSO : 100 mg/mL (202.73 mM; Need ultrasonic; Hygroscopic DMSO has a significant impact on the solubility of product, please use newly opened DMSO)
Please refer to the solubility information to select the appropriate solvent. Once prepared, please aliquot and store the solution to prevent product inactivation from repeated freeze-thaw cycles.
Storage method and period of stock solution: -80°C, 6 months; -20°C, 1 month. When stored at -80°C, please use it within 6 months. When stored at -20°C, please use it within 1 month.
Please refer to the solubility information to select the appropriate solvent. Once prepared, please aliquot and store the solution to prevent product inactivation from repeated freeze-thaw cycles.
Storage method and period of stock solution: -80°C, 6 months; -20°C, 1 month. When stored at -80°C, please use it within 6 months. When stored at -20°C, please use it within 1 month.
Concentration (start) × Volume (start) = Concentration (final) × Volume (final)
In Vivo:
Select the appropriate dissolution method based on your experimental animal and administration route.
- For the following dissolution methods, please ensure to first prepare a clear stock solution using an In Vitro approach and then sequentially add co-solvents:
- To ensure reliable experimental results, the clarified stock solution can be appropriately stored based on storage conditions. As for the working solution for In Vivo experiments, it is recommended to prepare freshly and use it on the same day.
- The percentages shown for the solvents indicate their volumetric ratio in the final prepared solution. If precipitation or phase separation occurs during preparation, heat and/or sonication can be used to aid dissolution.
In Vivo Dissolution Calculator
Please enter the basic information of animal experiments:
-
-
-
-
Recommended: Prepare an additional quantity of animals to account for potential losses during experiments.
Please enter your animal formula composition:
-
%DMSO +
Recommended: Keep the proportion of DMSO in working solution below 2% if your animal is weak.
-
%+
-
+%Tween-80 + +
-
%Saline +
The co-solvents required include: DMSO, . All of co-solvents are available by MedChemExpress (MCE). , Tween 80. All of co-solvents are available by MedChemExpress (MCE).
Working solution concentration: 0.22 mg/mL
Method for preparing stock solution: mg drug dissolved in μL DMSO. Stock solution concentration: mg/mL.
1. Take μL DMSO stock solution;
2. Add μL .
μL , mix evenly;
3. Then add μL Tween 80, mix evenly;
4. Then add μL
Please ensure that the stock solution in the first step is dissolved to a clear state, and add co-solvents in sequence. You can use ultrasonic heating (ultrasonic cleaner, recommended frequency 20-40 kHz), vortexing, etc. to assist dissolution.


Pureté et documentation
-
Fiche technique (279 KB)
-
SDS (251 KB)
- English - EN (251 KB)
- Français - FR (251 KB)
- Deutsch - DE (251 KB)
- Norwegian - NO (251 KB)
- Español - ES (251 KB)
- Swedish - SV (251 KB)
- Italian - IT (251 KB)
- Korean - KR (251 KB)
- Portuguese - PT (251 KB)
-
Instruction de manipulation (2659 KB)
Références


Complete Stock Solution Preparation Table
Please refer to the solubility information to select the appropriate solvent. Once prepared, please aliquot and store the solution to prevent product inactivation from repeated freeze-thaw cycles.
Storage method and period of stock solution: -80°C, 6 months; -20°C, 1 month. When stored at -80°C, please use it within 6 months. When stored at -20°C, please use it within 1 month.
| Optional Solvent | Concentration Solvent Mass | 1 mg | 5 mg | 10 mg | 25 mg |
|---|---|---|---|---|---|
| DMSO | 1 mM | 2.0273 mL | 10.1364 mL | 20.2729 mL | 50.6822 mL |
| 5 mM | 0.4055 mL | 2.0273 mL | 4.0546 mL | 10.1364 mL | |
| 10 mM | 0.2027 mL | 1.0136 mL | 2.0273 mL | 5.0682 mL | |
| 15 mM | 0.1352 mL | 0.6758 mL | 1.3515 mL | 3.3788 mL | |
| 20 mM | 0.1014 mL | 0.5068 mL | 1.0136 mL | 2.5341 mL | |
| 25 mM | 0.0811 mL | 0.4055 mL | 0.8109 mL | 2.0273 mL | |
| 30 mM | 0.0676 mL | 0.3379 mL | 0.6758 mL | 1.6894 mL | |
| 40 mM | 0.0507 mL | 0.2534 mL | 0.5068 mL | 1.2671 mL | |
| 50 mM | 0.0405 mL | 0.2027 mL | 0.4055 mL | 1.0136 mL | |
| 60 mM | 0.0338 mL | 0.1689 mL | 0.3379 mL | 0.8447 mL | |
| 80 mM | 0.0253 mL | 0.1267 mL | 0.2534 mL | 0.6335 mL | |
| 100 mM | 0.0203 mL | 0.1014 mL | 0.2027 mL | 0.5068 mL |


SC912 Related Classifications
HY-161409 Related Classifications
 Powered by Bioz