



Arvenin I

Based on 1 Customer Validation
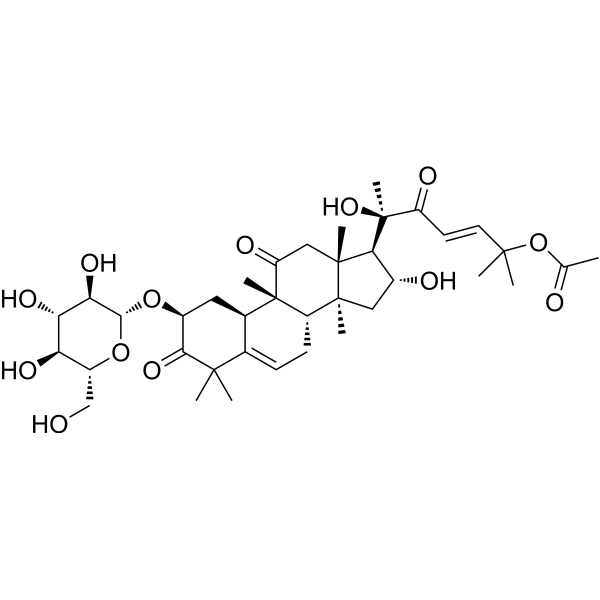
Arvenin I is a natural cucurbitacin glucoside that activates T cells within the cancer-competitive environment. Arvenin I covalently reacts with and hyperactivates MKK3, thereby reviving the mitochondrial fitness of exhausted T cells through the activation of the p38MAPK pathway. Arvenin I exhibits broad-spectrum antiproliferative against cancer cells. Arvenin I enhances antitumor effects both as a monotherapy and in combination with immune checkpoint inhibitors in mice. Arvenin I can be used for cancer research, such as colon cancer, breast cancer, lung cancer, and ovarian cancer[1][2].
Nos produits utilisent uniquement pour la recherche. Nous ne vendons pas aux patients.
- Pureté : 89.41%
- CAS No.: 65247-27-0
- Formule: C38H56O13
- Masse moléculaire:720.84
-
Stockage:
4°C, protect from light
* In solvent : -80°C, 6 months; -20°C, 1 month (protect from light)

To place orders, for customer services and technical support, please contact: MedChemExpress USA
Tel: 609-228-6898 E-mail: [email protected] [email protected]


-
 Activité biologique
-
Chemical Information
- Protocole
- Pureté et documentation
- Références
-
 Help & FAQs




Activité biologique
Description
In Vitro
Arvenin I (0.5-4 μM, 48 h) displays no detectable induction of IL-2 in Jurkat PD-1 cells in the absence of PHA and PMA (HY-18739) and exhibits no significant cytotoxicity in Jurkat PD-1 cells at 4 μM, suggesting that it does not independently activate T cells but rather augments the PHA/PMA-induced activation of T cells[1].
Arvenin I (0-30 μM, 24-48 h) forms a covalent bond with specific cysteine residues in AKT (Cys310) and MKK3 (Cys227) through its Michael acceptor moiety to activate the MKK3-p38MAPK signaling pathway, leading to increased IL-2 production[1].
Arvenin I (250 nM, 2 h) enhances the mitochondrial bioenergetics in primary CD8+ T cells by increasing basal and maximal respiration as well as spare respiratory capacity through the p38MAPK pathway[1].
Arvenin I (1-100 μM, 3 days) exhibits broad-spectrum antiproliferative activity against a panel of human cancer cell lines, with IC50 values of 17.0, 49.4, 14.7 and 42.8 μM in A-549, HT-29, OVCAR, and MCF-7 cells, respectively[2].
MedChemExpress (MCE) has not independently confirmed the accuracy of these methods. They are for reference only.
-
Cell Line:HEK293 and Jurkat PD-1 cells
-
Concentration:0, 3, 10, and 30 μM for HEK293 cells; 0, 2, and 4 μM for Jurkat PD-1 cells
-
Incubation Time:24 h
-
Result:Caused slightly slower electrophoretic migration of the Western-blotted bands of Flag-AKT wt and Flag-MKK3 wt on SDS-PAGE gels at concentrations as low as 3 μM.
Failed to induce a band shift in mutants where each corresponding cysteine residue was substituted with a serine residue (Flag-AKT C310S and Flag-MKK3 C227S), even at a high concentration of 30 μM.
Markedly increased the phosphorylation of p38MAPK Thr180/Tyr182 in Jurkat hPD-1 cells either in the presence or absence of PHA and PMA.
Had no detectable effects on the phosphorylation of FOXO1 Ser256.
Increased the phosphorylation of MKK3 in Jurkat hPD-1 cells.
-
Cell Line:Jurkat PD-1 cells
-
Concentration:0.5, 1, 2, and 4 μM
-
Incubation Time:48 h
-
Result:Exhibited no significant cytotoxicity in Jurkat PD-1 cells at 4 μM.
-
Cell Line:Jurkat PD-1, Jurkat MKK3 wild-type and C227S cells
-
Concentration:4 μM
-
Incubation Time:48 h
-
Result:Its ability to restore IL-2 production (suppressed by MDA-MB-231 conditioned medium) was dose-dependently canceled by SB203580 (HY-10256).
Potentiated the augmentation of IL-2 production resulting from the overexpression of wild-type MKK3.
In Vivo
MedChemExpress (MCE) has not independently confirmed the accuracy of these methods. They are for reference only.
-
Animal Model:WT C57BL/6N mice (6 weeks old) subcutaneously injected with MC38 colon cancer cells[1]
-
Dosage:6 mg/kg
-
Administration:i.p., every 3 days from day 10 to day 22
-
Result:Caused a 40% inhibition of tumor growth in comparison to the control group, comparable to the efficacy of the PD-L1 antibody (30 μg every 6 day from day 10 to day 22).
Produced approximately 70% inhibition of tumor growth with a combination with PD-L1 antibody.
Did not lead to significant reductions in body weight or differences in liver toxicity markers, including AST, ALT, and LDH.
Significantly enhanced mitochondrial respiration and upregulated proliferation markers (Ki67) in DLN CD8+ T cells in combination with the PD-L1 antibody.
Increased TNF-α levels but reduced IFN-γ levels in combination with the PD-L1 antibody.
Showed a trend toward decreasing the population of terminally exhausted CD8+ T cells (PD1+ Tim3+) and increasing the proportion of less exhausted CD8+ T cells in the combination group.
-
Animal Model:Rag2KO C57BL/6N mice (6 weeks old) subcutaneously injected with MC38 colon cancer cells[1]
-
Dosage:6 mg/kg
-
Administration:i.p., every 3 days from day 10 to day 22
-
Result:Failed to suppress tumors in immunodeficient mice, thereby demonstrating that its antitumor efficacy is depends on the adaptive immune system.


Chemical Information
-
CAS No. 65247-27-0
-
Appearance Solid
-
Masse moléculaire 720.84
-
Formule C38H56O13
-
Color Off-white to light yellow
-
SMILES
CC(OC(C)(/C=C/C([C@@]([C@H]1[C@H](O)C[C@]2(C)[C@]1(C)CC([C@]3(C)[C@H]2CC=C4[C@H]3C[C@H](O[C@H]5[C@H](O)[C@@H](O)[C@H](O)[C@@H](CO)O5)C(C4(C)C)=O)=O)(O)C)=O)C)=O
-
Structure Classification
-
Initial Source
-
Livraison
Room temperature in continental US; may vary elsewhere.
-
Stockage
4°C, protect from light
* In solvent : -80°C, 6 months; -20°C, 1 month (protect from light)


Pureté et documentation
-
Fiche technique (279 KB)
-
SDS (251 KB)
- English - EN (251 KB)
- Français - FR (251 KB)
- Deutsch - DE (251 KB)
- Norwegian - NO (251 KB)
- Español - ES (251 KB)
- Swedish - SV (251 KB)
- Italian - IT (251 KB)
- Korean - KR (251 KB)
- Portuguese - PT (251 KB)
-
Instruction de manipulation (2659 KB)
Références
[1]. Takemoto M, et al. Covalent Plant Natural Product that Potentiates Antitumor Immunity. J Am Chem Soc. 2025 Jan 22;147(3):2902-2912. [Content Brief]
[2]. Minh CV, et al. Chemical constituents of Trichosanthes kirilowii and their cytotoxic activities. Arch Pharm Res. 2015 Aug;38(8):1443-8. [Content Brief]

Calculators
Concentration (start) × Volume (start) = Concentration (final) × Volume (final)


Arvenin I Related Classifications
HY-N6579 Related Classifications
 Powered by Bioz