



Lotusine

Based on 1 Customer Validation
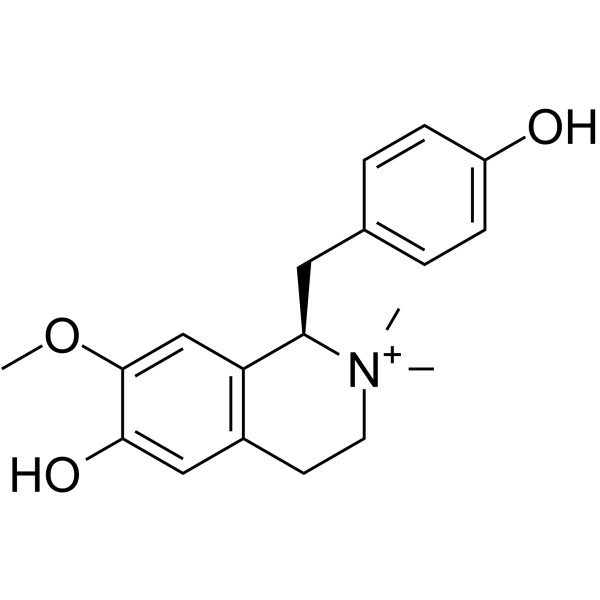
Lotusine is an orally active signaling pathway modulator and enzyme inhibitor, with an IC50 of 30.60 μg/mL against α-amylase and an IC50 of 36.15 μg/mL against α-glucosidase. Lotusine inhibits the EGFR-Akt-ERK signaling pathway by reducing the levels of phosphorylated EGFR, Akt and ERK. Lotusine induces apoptosis, triggers G0/G1 cell cycle arrest and inhibits cancer cell proliferation. Lotusine reduces lipid peroxidation and increases the activities of SOD, CAT and GPx. Lotusine is applicable to researches related to non-small cell lung cancer, type 2 diabetes and autism spectrum disorder.
For research use only. We do not sell to patients.
- Purity : 99.91%
- CAS No.: 6871-67-6
- Formula: C19H24NO3
- Molecular Weight:314.40
-
Storage:Powder -20°C, 3 years , 4°C, 2 years ; In solvent -80°C, 6 months , -20°C, 1 month

To place orders, for customer services and technical support, please contact: MedChemExpress USA
Tel: 609-228-6898 E-mail: [email protected] [email protected]


-
 Biological Activity
-
Chemical Information
-
Solvent & Solubility
- Protocols
- Purity & Documentation
- References
-
 Help & FAQs




Biological Activity
Description
In Vitro
Lotusine (2, 4, 10 μM; 24, 48, 72 h) potently inhibits proliferation of EGFR-mutant HCC827 NSCLC cells and EGFR-wildtype A549 NSCLC cells in time- and concentration-dependent manners, with stronger activity against HCC827 cells (73% inhibition at 10 μM for 72 h)[1].
Lotusine (2.5, 5, 10 μM; 24 h) induces concentration-dependent apoptosis in EGFR-mutant HCC827 NSCLC cells, with 80% of cells undergoing apoptosis at 10 μM for 24 h[1].
Lotusine (2.5, 5, 10 μM; 24 h) disrupts mitochondrial membrane potential in EGFR-mutant HCC827 NSCLC cells in a concentration-dependent manner, as evidenced by reduced JC-1 fluorescence ratios at 2.5, 5, and 10 μM for 24 h[1].
Lotusine (2.5, 5, 10 μM; 72 h) induces concentration-dependent G0/G1 phase cell cycle arrest in EGFR-mutant HCC827 NSCLC cells, halting progression into the DNA synthesis phase[1].
Lotusine (2.5, 5, 10 μM; 24 h) inhibits the EGFR-Akt-ERK signaling pathway in EGFR-mutant HCC827 NSCLC cells in vitro in a concentration-dependent manner, reducing p-EGFR, p-Akt, and p-ERK levels most significantly at 10 μM for 24 h[1].
Lotusine (25-50 μM; 48-72 h) does not significantly reduce the viability of HepG2 cells when administered alone or in combination with 25 mM D-glucose, maintaining 85-90% cell viability[2].
Lotusine (25-50 μM; 48-72 h, co-treated with 25 mM D-glucose) reverses hyperglycemia-induced reductions in SOD, CAT, and GPx antioxidant enzyme activities and lowers elevated MDA levels in HepG2 cells[2].
Lotusine (1.56-200 μg/mL; 10 min) inhibits alpha-amylase activity with an IC50 of 30.60 μg/mL, and achieves 80.36% inhibition at a concentration of 200 μg/mL in a cell-free biochemical assay[2].
Lotusine (1.56-200 μg/mL; 20 min) inhibits alpha-glucosidase activity with an IC50 of 36.15 μg/mL, and achieves 82.6% inhibition at a concentration of 200 μg/mL in a cell-free biochemical assay[2].
Lotusine (10-1000 μM; 24 h) exhibits low cytotoxicity in H9c2 cells, with an IC50 of 701 μM, and concentrations of 10, 50, and 100 μM maintain cell viability near control levels[3].
Lotusine (10-100 μM) enhances endogenous antioxidant (SOD, CAT, GSH) levels in H9c2 cells exposed to doxorubicin, supporting protection against oxidative stress[3].
Lotusine (10-100 μM) significantly reduces doxorubicin-induced lipid peroxidation in H9c2 cells, with 50 μM showing the greatest reduction[3].
Lotusine (10-50 μM; 24 h pretreatment) prevents doxorubicin-induced morphological and nuclear abnormalities in H9c2 cells[3].
Lotusine (10-50 μM) completely inhibits doxorubicin-induced ROS generation in H9c2 cells[3].
Lotusine (10-50 μM) modulates apoptotic gene expression in H9c2 cells exposed to doxorubicin, upregulating Bcl-2 and downregulating Bax and Cas-3 to inhibit apoptosis[3].
Lotusine (10-50 μM; 24 h pretreatment) reduces doxorubicin-induced caspase-3/7 activity in H9c2 cells, with 50 μM showing activity comparable to control cells[3].
Lotusine (50 μM; 3 h) directly interacts with and stabilizes DRD1 protein in PC12 cells[4].
Lotusine (3.12-25 μM; 48 h following 1 h 38 mM PPA pretreatment) protects PC12 cells against PPA-induced cytotoxicity[4].
MedChemExpress (MCE) has not independently confirmed the accuracy of these methods. They are for reference only.
-
Cell Line:human EGFR-mutant HCC827 NSCLC cells, human EGFR-wildtype A549 NSCLC cells
-
Concentration:2.5, 5, 10 μM
-
Incubation Time:24 h, 48 h, 72 h
-
Result:Inhibited approximately 73% of HCC827 cell proliferation at 10 μM for 72 h.
Inhibited approximately 52% of A549 cell proliferation at 10 μM for 72 h.
Exhibited time- and concentration-dependent inhibitory effects on both cell lines, with more pronounced activity in HCC827 cells.
-
Cell Line:human EGFR-mutant HCC827 NSCLC cells
-
Concentration:2.5 μM (24 h); 5 μM (24 h); 10 μM (24 h)
-
Incubation Time:24 h (2.5 μM); 24 h (5 μM); 24 h (10 μM)
-
Result:Induced a substantial increase in apoptosis relative to untreated cells at 2.5 μM for 24 h.
Induced apoptosis in more than 50% of HCC827 cells at 5 μM for 24 h.
Induced apoptosis in approximately 80% of HCC827 cells at 10 μM for 24 h.
-
Cell Line:human EGFR-mutant HCC827 NSCLC cells
-
Concentration:2.5 μM (72 h); 5 μM (72 h); 10 μM (72 h)
-
Incubation Time:72 h (2.5 μM); 72 h (5 μM); 72 h (10 μM)
-
Result:Increased the proportion of cells in the G0/G1 phase in a concentration-dependent manner.
Decreased the S and G2/M phase cell populations in a concentration-dependent manner.
-
Cell Line:human EGFR-mutant HCC827 NSCLC cells
-
Concentration:2.5 μM (24 h); 5 μM (24 h); 10 μM (24 h)
-
Incubation Time:24 h (2.5 μM); 24 h (5 μM); 24 h (10 μM)
-
Result:Reduced phosphorylated EGFR (p-EGFR) levels in a concentration-dependent manner.
Reduced phosphorylated Akt (p-Akt) levels in a concentration-dependent manner.
Reduced phosphorylated ERK (p-ERK) levels in a concentration-dependent manner.
Showed the highest inhibitory activity at 10 μM for 24 h.
-
Cell Line:HepG2 cells
-
Concentration:25 μM (alone; combined with 25 mM D-glucose); 50 μM (alone; combined with 25 mM D-glucose)
-
Incubation Time:48 h (25 μM alone; 25 μM + 25 mM D-glucose); 72 h (50 μM alone; 50 μM + 25 mM D-glucose)
-
Result:Maintained 85-90% of HepG2 cell viability.
Showed no significant reduction in viability relative to control cells.
-
Cell Line:H9c2
-
Concentration:10, 50, 100, 250, 500, 1000 μM
-
Incubation Time:24 h
-
Result:Exhibited an IC50 value of 701 μM.
Maintained cell viability near control levels at 10, 50, and 100 μM.
Caused significant decreases in cell viability at concentrations from 250 to 1000 μM.
-
Cell Line:H9c2
-
Concentration:10, 50, 100 μM (pretreated prior to doxorubicin exposure)
-
Incubation Time:24 h (pretreatment); 24 h (doxorubicin exposure)
-
Result:Maintained cell viability near control levels at 10 μM.
Induced cell proliferation at 50 μM, with viability values of 118.53 % (SRB assay) and 110.36 % (MTT assay).
Caused significantly reduced cell viability at 100 μM (84.41% in SRB assay, 79.84 % in MTT assay).
-
Cell Line:rat pheochromocytoma PC12 cells
-
Concentration:6.25 μM
-
Incubation Time:48 h (following 1 h 38 mM PPA pretreatment)
-
Result:Restored PPA-induced reductions in DRD1, c-fos, GluA1, p-GluA1 Ser 845, and p-GluA1 Ser 831 protein levels.
Had its rescue effect abolished when co-treated with the DRD1 antagonist SCH23390.
In Vivo
Lotusine (5-20 mg/kg; p.o.; daily; 5 days) ameliorates propionic acid-induced ASD-like social deficits and cognitive impairments in mice, with 10 and 20 mg/kg doses also restoring mPFC neuronal activity and AMPA receptor function via upregulation of c-fos and phosphorylated GluA1 levels[4].
MedChemExpress (MCE) has not independently confirmed the accuracy of these methods. They are for reference only.
-
Animal Model:Wistar (Sprague Dawley) (male, 160 ± 20 g, streptozotocin-induced diabetes mellitus)[2]
-
Dosage:50 mg/kg bw
-
Administration:diet supplementation; daily; 4 weeks
-
Result:Restored serum, liver, and pancreatic vitamin C and E concentrations to near-normal values (liver vitamin C: 160 mg/100g; liver vitamin E: 2990 mg/100g).
Increased liver cell protein content to 11.6 mg/g.
Enhanced body weight gain by 45% compared to untreated diabetic rats (final body weight: 225.5 g; body weight gain: 65.3 g).
Reduced feed conversion ratio to 1.45, matching the ratio of non-diabetic control rats.
Lowered relative organ weight to 2.49%, a level comparable to non-diabetic control rats.
Maintained 100% survival rate.
-
Animal Model:C57BL/6J (male, 6-8 weeks old, 20 ± 2 g, intracerebroventricular injection of propionic acid to induce ASD-like behavior)[4]
-
Dosage:5 mg/kg; 10 mg/kg; 20 mg/kg
-
Administration:p.o.; daily; 5 days
-
Result:Significantly increased interaction time with a stranger mouse in the sociability test and with a novel stranger mouse in the social novelty test reversing PPA-induced social deficits.
Significantly increased the percentage of spontaneous alternations in the Y-maze test.
Significantly reversed the PPA-induced reduction in miniature excitatory postsynaptic current frequency in the medial prefrontal cortex at 10 mg/kg, with no effect on amplitude.
Significantly increased c-fos protein levels in the mPFC, reversing PPA-induced reductions.
Reversed PPA-induced reductions in p-GluA1 Ser845 protein levels in the mPFC; reversed PPA-induced reductions in p-GluA1 Ser831 protein levels in the mPFC .
- Annexin V plus membrane-impermeant dye apoptosis staining
- BrdU Incorporation Assay
- Somatic Cell Culture
- CFSE Dye Dilution Proliferation Assay
- Dye-dilution cell tracking and proliferation staining
- Protocol for Cell Cycle
- CCK-8/WST-8 Cell Proliferation Assay
- Cell Counting-Based Growth Curve Assay
- Colony Formation (Clonogenic) Assay
- Research Protocol for Metabolic Diseases
- Cell Viability Determination by MTT Colorimetric Assay
- EdU Incorporation Assay (Click Chemistry-Based DNA Synthesis Measurement)
- Detection of Apoptosis
- TUNEL staining for apoptotic DNA fragmentation
- Ki-67 Immunostaining Proliferation Assay
- Flow cytometric DNA-content cell-cycle staining
- PCNA Immunodetection Proliferation Assay
- Protocol for Cell Counting and Cell Density Analysis
- Apoptosis Solutions
- Ferroptosis Solutions
- MTT Cell Proliferation Assay


Chemical Information
-
CAS No. 6871-67-6
-
Appearance Solid
-
Molecular Weight 314.40
-
Formula C19H24NO3
-
Color White to off-white
-
SMILES
C[N+]1(C)[C@H](CC2=CC=C(O)C=C2)C3=C(C=C(O)C(OC)=C3)CC1
-
Structure Classification
-
Initial Source
-
Shipping
Room temperature in continental US; may vary elsewhere.
-
Storage
Powder -20°C 3 years 4°C 2 years In solvent -80°C 6 months -20°C 1 month


Solvent & Solubility
In Vitro:
H2O : ≥ 100 mg/mL (318.07 mM)
* "≥" means soluble, but saturation unknown.
Please refer to the solubility information to select the appropriate solvent. Once prepared, please aliquot and store the solution to prevent product inactivation from repeated freeze-thaw cycles.
Storage method and period of stock solution: -80°C, 6 months; -20°C, 1 month. When stored at -80°C, please use it within 6 months. When stored at -20°C, please use it within 1 month.
* Note: If you choose water as the stock solution, please dilute it to the working solution, then filter and sterilize it with a 0.22 μm filter before use.
Please refer to the solubility information to select the appropriate solvent. Once prepared, please aliquot and store the solution to prevent product inactivation from repeated freeze-thaw cycles.
Storage method and period of stock solution: -80°C, 6 months; -20°C, 1 month. When stored at -80°C, please use it within 6 months. When stored at -20°C, please use it within 1 month.
* Note: If you choose water as the stock solution, please dilute it to the working solution, then filter and sterilize it with a 0.22 μm filter before use.
Concentration (start) × Volume (start) = Concentration (final) × Volume (final)


Purity & Documentation
-
Data Sheet (291 KB)
-
SDS (252 KB)
- English - EN (252 KB)
- Français - FR (252 KB)
- Deutsch - DE (252 KB)
- Norwegian - NO (252 KB)
- Español - ES (252 KB)
- Swedish - SV (252 KB)
- Italian - IT (252 KB)
- Korean - KR (252 KB)
- Portuguese - PT (252 KB)
-
Handling Instructions (2659 KB)
References
[1]. Lan Y, et al. Anti-lung cancer activity of lotusine in non-small cell lung cancer HCC827 via reducing proliferation, oxidative stress, induction of apoptosis, and G0/G1 cell cycle arrest via suppressing EGFR-Akt-ERK signalling. In Vitro Cell Dev Biol Anim. 2025;61(4):450-458. [Content Brief]
[3]. Harishkumar R, et al. Lotusine, an alkaloid from Nelumbo nucifera (Gaertn.), attenuates doxorubicin-induced toxicity in embryonically derived H9c2 cells. In Vitro Cell Dev Biol Anim. 2020;56(5):367-377. [Content Brief]
[4]. Liu QQ, et al. Lotusine ameliorates propionic acid-induced autism spectrum disorder-like behavior in mice by activating D1 dopamine receptor in medial prefrontal cortex. Phytother Res. 2024;38(2):1089-1103. [Content Brief]
[5]. Le Crouéour G, et al. Lotusine G: a new cyclopeptide alkaloid from Zizyphus lotus. Fitoterapia. 2002;73(1):63-68. [Content Brief]


Complete Stock Solution Preparation Table
Please refer to the solubility information to select the appropriate solvent. Once prepared, please aliquot and store the solution to prevent product inactivation from repeated freeze-thaw cycles.
Storage method and period of stock solution: -80°C, 6 months; -20°C, 1 month. When stored at -80°C, please use it within 6 months. When stored at -20°C, please use it within 1 month.
| Optional Solvent | Concentration Solvent Mass | 1 mg | 5 mg | 10 mg | 25 mg |
|---|---|---|---|---|---|
| H2O | 1 mM | 3.1807 mL | 15.9033 mL | 31.8066 mL | 79.5165 mL |
| 5 mM | 0.6361 mL | 3.1807 mL | 6.3613 mL | 15.9033 mL | |
| 10 mM | 0.3181 mL | 1.5903 mL | 3.1807 mL | 7.9517 mL | |
| 15 mM | 0.2120 mL | 1.0602 mL | 2.1204 mL | 5.3011 mL | |
| 20 mM | 0.1590 mL | 0.7952 mL | 1.5903 mL | 3.9758 mL | |
| 25 mM | 0.1272 mL | 0.6361 mL | 1.2723 mL | 3.1807 mL | |
| 30 mM | 0.1060 mL | 0.5301 mL | 1.0602 mL | 2.6506 mL | |
| 40 mM | 0.0795 mL | 0.3976 mL | 0.7952 mL | 1.9879 mL | |
| 50 mM | 0.0636 mL | 0.3181 mL | 0.6361 mL | 1.5903 mL | |
| 60 mM | 0.0530 mL | 0.2651 mL | 0.5301 mL | 1.3253 mL | |
| 80 mM | 0.0398 mL | 0.1988 mL | 0.3976 mL | 0.9940 mL | |
| 100 mM | 0.0318 mL | 0.1590 mL | 0.3181 mL | 0.7952 mL |
* Note: If you choose water as the stock solution, please dilute it to the working solution, then filter and sterilize it with a 0.22 μm filter before use.


Lotusine Related Classifications
HY-N4309 Related Classifications
 Powered by Bioz