



BLM-IN-2

Based on 1 Customer Validation
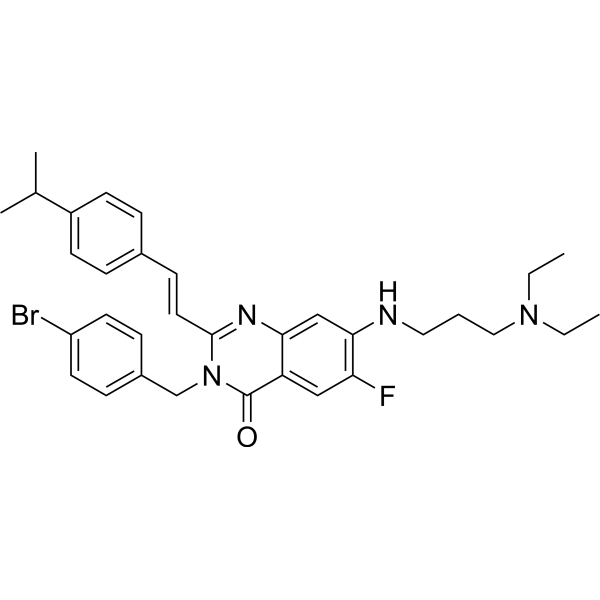
BLM-IN-2 is a Bloom's Syndrome Protein (BLM) inhibitor with an IC50 value of 0.8 μM. BLM-IN-2 effectively suppresses the proliferation, invasion, cell cycle arrest and apoptosis of CRC cells. BLM-IN-2 can be used for the reserarch of colorectal cancer (CRC).
For research use only. We do not sell to patients.
- CAS No.: 3037604-86-4
- Formula: C33H38BrFN4O
- Molecular Weight:605.58
-
Storage:Powder -20°C, 3 years , 4°C, 2 years ; In solvent -80°C, 6 months , -20°C, 1 month

To place orders, for customer services and technical support, please contact: MedChemExpress USA
Tel: 609-228-6898 E-mail: [email protected] [email protected]


-
 Biological Activity
-
Chemical Information
- Protocols
- Purity & Documentation
- References
-
 Help & FAQs


All DNA/RNA Synthesis Isoforms
More

Biological Activity
Description
IC50 & Target
IC50: 0.8 μM (BLM)[1]
Cellular Effect
|
Cell Line

|
Type | Value | Description | References |
|---|---|---|---|---|
| HCT-116 | IC50 |
0.6 μM
Compound: 21
|
Inhibition of colony formation in human HCT-116 cells incubated for 10 days by crystal violet staining based assay
Inhibition of colony formation in human HCT-116 cells incubated for 10 days by crystal violet staining based assay
|
[PMID: 36459756] |
| HCT-116 | IC50 |
1 μM
Compound: 21
|
Inhibition of cell invasion in human HCT-116 cells incubated for 48 hrs by crystal violet staining based transwell assay
Inhibition of cell invasion in human HCT-116 cells incubated for 48 hrs by crystal violet staining based transwell assay
|
[PMID: 36459756] |
| HCT-116 | IC50 |
1.9 μM
Compound: 21
|
Antiproliferative activity against wild type human HCT-116 cells assessed as inhibition of cell growth incubated for 48 hrs by propidium iodide staining based high-content imaging analysis
Antiproliferative activity against wild type human HCT-116 cells assessed as inhibition of cell growth incubated for 48 hrs by propidium iodide staining based high-content imaging analysis
|
[PMID: 36459756] |
| HCT-116 | IC50 |
2.8 μM
Compound: 21
|
Cytotoxicity against human HCT-116 cells assessed as inhibition of cell growth measured after 48 hrs by MTT assay
Cytotoxicity against human HCT-116 cells assessed as inhibition of cell growth measured after 48 hrs by MTT assay
|
[PMID: 36459756] |
| NCM460 | IC50 |
15.6 μM
Compound: 21
|
Cytotoxicity against human NCM460 cells assessed as inhibition of cell growth measured after 48 hrs by MTT assay
Cytotoxicity against human NCM460 cells assessed as inhibition of cell growth measured after 48 hrs by MTT assay
|
[PMID: 36459756] |
| RKO | IC50 |
0.7 μM
Compound: 21
|
Inhibition of colony formation in human RKO cells incubated for 10 days by crystal violet staining based assay
Inhibition of colony formation in human RKO cells incubated for 10 days by crystal violet staining based assay
|
[PMID: 36459756] |
| RKO | IC50 |
5.4 μM
Compound: 21
|
Cytotoxicity against human RKO cells assessed as inhibition of cell growth measured after 48 hrs by MTT assay
Cytotoxicity against human RKO cells assessed as inhibition of cell growth measured after 48 hrs by MTT assay
|
[PMID: 36459756] |
| SW480 | IC50 |
0.6 μM
Compound: 21
|
Inhibition of colony formation in human SW480 cells incubated for 10 days by crystal violet staining based assay
Inhibition of colony formation in human SW480 cells incubated for 10 days by crystal violet staining based assay
|
[PMID: 36459756] |
| SW480 | IC50 |
2.2 μM
Compound: 21
|
Cytotoxicity against human SW480 cells assessed as inhibition of cell growth measured after 48 hrs by MTT assay
Cytotoxicity against human SW480 cells assessed as inhibition of cell growth measured after 48 hrs by MTT assay
|
[PMID: 36459756] |
In Vitro
BLM-IN-2 (0-20 μM) has good inhibitory effect on BLM unwinding and binding DNA with IC50 values of 0.8 μM and 2.3 μM, respectively[1].
BLM-IN-2 exhibits the potent BLM-dependent cytotoxicity against the CRC cells but weak against normal cells[1].
BLM-IN-2 (3 μM; 48 h) disrupts the HRR level while inhibiting BLM located on the DSB site and trigger DNA damage in the CRC cells[1].
BLM-IN-2 (0-5 μM; 48 h) effectively suppresses the proliferation and invasion of CRC cells, along with cell cycle arrest and apoptosis[1].
MedChemExpress (MCE) has not independently confirmed the accuracy of these methods. They are for reference only.
-
Cell Line:HCT116 cells; HCT116, SW480 and RKO cells
-
Concentration:0-5 μM; 0.5, 1, 2 μM
-
Incubation Time:48 h; 10 days
-
Result:Induced proliferation arrest.
Completely inhibited the growth of cancer cells at the concentration around 2 μM, had a good anti-CRC activity.
-
Cell Line:HCT116, SW480 and RKO cells
-
Concentration:1 μM
-
Incubation Time:48 h
-
Result:Induced apoptosis and necrosis in HCT116, SW480 and RKO.
-
Cell Line:HCT116, SW480 and RKO cells
-
Concentration:4 μM
-
Incubation Time:48 h
-
Result:Changed the cell proportion of the S or G2/M phase in CRC cells, arrested the cell cycle at the S phase in HCT116 and SW480 and arrested the cell cycle of HCT116, SW480 and RKO at the G2/M phase.
-
Cell Line:HCT116 cells
-
Concentration:0.25, 0.5, 1, 2, 4 μM
-
Incubation Time:48 h
-
Result:Obviously decreased the invasion in HCT116 cells with an IC50 value of 1.0 μM and had inhibitory on CRC invasion.
- Detection of Apoptosis
- TUNEL staining for apoptotic DNA fragmentation
- Flow cytometric DNA-content cell-cycle staining
- Annexin V plus membrane-impermeant dye apoptosis staining
- BrdU Incorporation Assay
- Apoptosis Solutions
- Cell invasion
- Protocol for Cell Cycle
- Cell Viability Determination by MTT Colorimetric Assay


Chemical Information
-
CAS No. 3037604-86-4
-
Appearance Solid
-
Molecular Weight 605.58
-
Formula C33H38BrFN4O
-
Color Light yellow to yellow
-
SMILES
CCN(CCCNC1=C(C=C2C(N(C(/C=C/C3=CC=C(C=C3)C(C)C)=NC2=C1)CC4=CC=C(C=C4)Br)=O)F)CC
-
Shipping
Room temperature in continental US; may vary elsewhere.
-
Storage
Powder -20°C 3 years 4°C 2 years In solvent -80°C 6 months -20°C 1 month


Purity & Documentation
-
Data Sheet (271 KB)
-
SDS (252 KB)
- English - EN (252 KB)
- Français - FR (252 KB)
- Deutsch - DE (252 KB)
- Norwegian - NO (252 KB)
- Español - ES (252 KB)
- Swedish - SV (252 KB)
- Italian - IT (252 KB)
- Korean - KR (252 KB)
- Portuguese - PT (252 KB)
-
Handling Instructions (2659 KB)
References

Calculators
Concentration (start) × Volume (start) = Concentration (final) × Volume (final)


BLM-IN-2 Related Classifications
HY-151939 Related Classifications
 Powered by Bioz