



Olitigaltin
Based on 14 publication(s) in Google Scholar
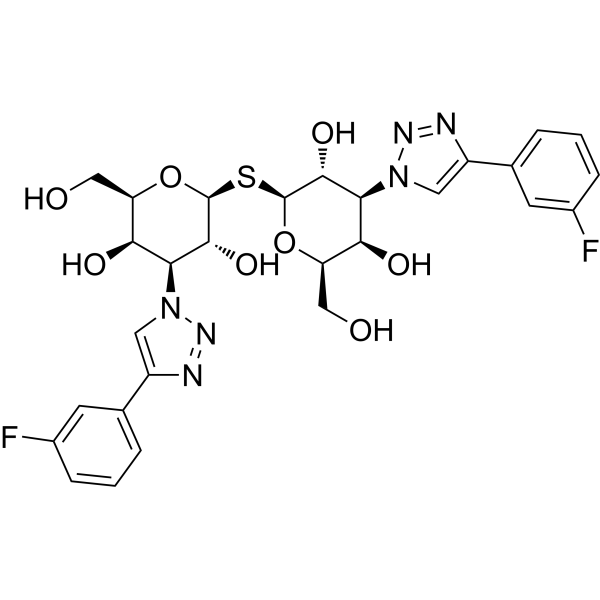
Olitigaltin (TD139) is a high-affinity Galectin-3 inhibitor with a Kd value of 14 nM. Olitigaltin inhibits the activity of the AKT/β-catenin pathway, induces Apoptosis, and downregulates SREBP1 expression. Olitigaltin enhances the phosphorylation level of ERK. Olitigaltin alleviates bleomycin (HY-17565A)-induced advanced pulmonary fibrosis in mice. Olitigaltin delays the onset of diabetes, and improves glucose tolerance and serum insulin levels. Olitigaltin alleviates liver injury. Olitigaltin maintains the structure of hippocampal excitatory synapses, restores γ-wave power in the hippocampal CA1 region, inhibits hippocampal neuroinflammation, and improves cognitive function in neuroinflammation models. Olitigaltin can be used in research related to thyroid cancer, idiopathic pulmonary fibrosis, type 1 diabetes, hepatitis, and cognitive dysfunction induced by neuroinflammation.
For research use only. We do not sell to patients.
- Purity : 99.74%
- CAS No.: 1450824-22-2
- Formula: C28H30F2N6O8S
- Molecular Weight:648.64
-
Storage:Powder -20°C, 3 years , 4°C, 2 years ; In solvent -80°C, 6 months , -20°C, 1 month

To place orders, for customer services and technical support, please contact: MedChemExpress USA
Tel: 609-228-6898 E-mail: [email protected] [email protected]


-
 Biological Activity
-
Chemical Information
-
Solvent & Solubility
- Protocols
- Purity & Documentation
- References
-
 Help & FAQs


-
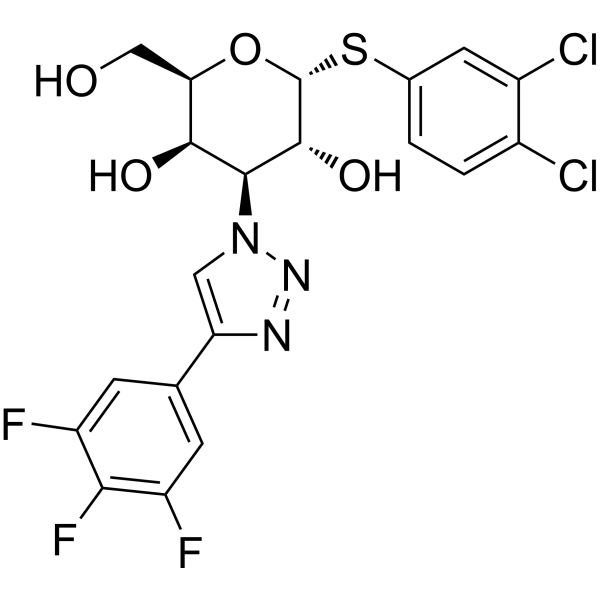
HY-114409
GB1107Galectin-3 Inhibitor -
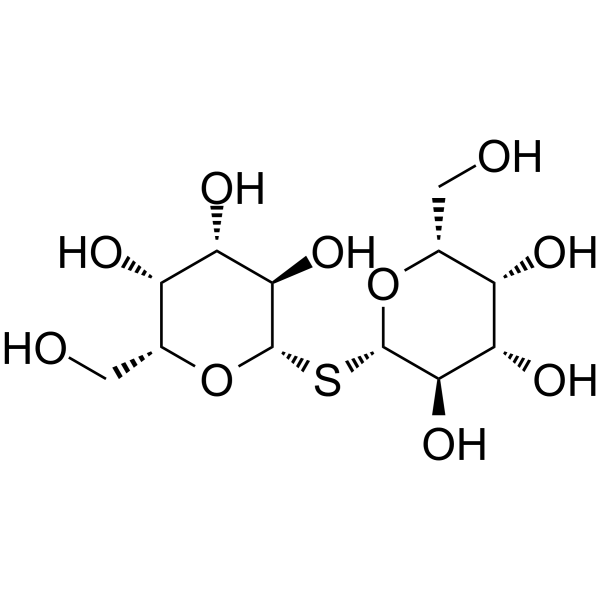
HY-130208
ThiodigalactosideGalectin Inhibitor -
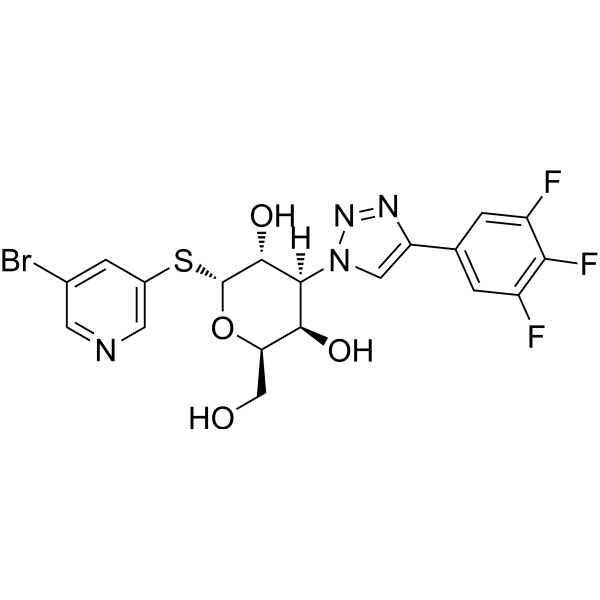
HY-147041
SelvigaltinGal-3 Inhibitor -
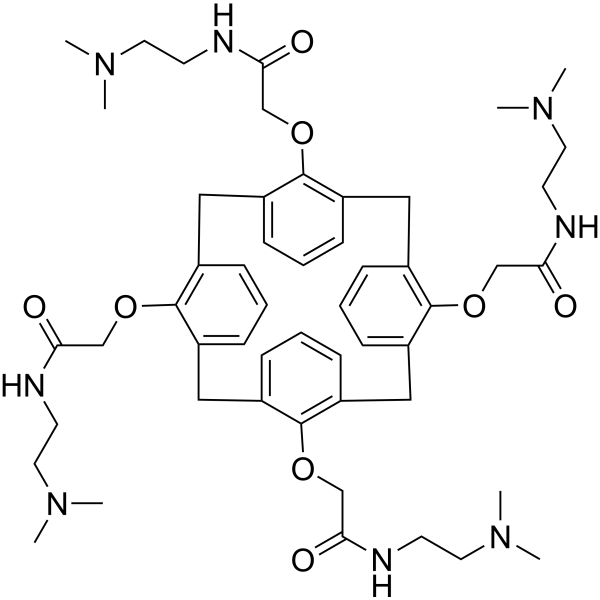
HY-19756
OTX008Galectin Inhibitor -
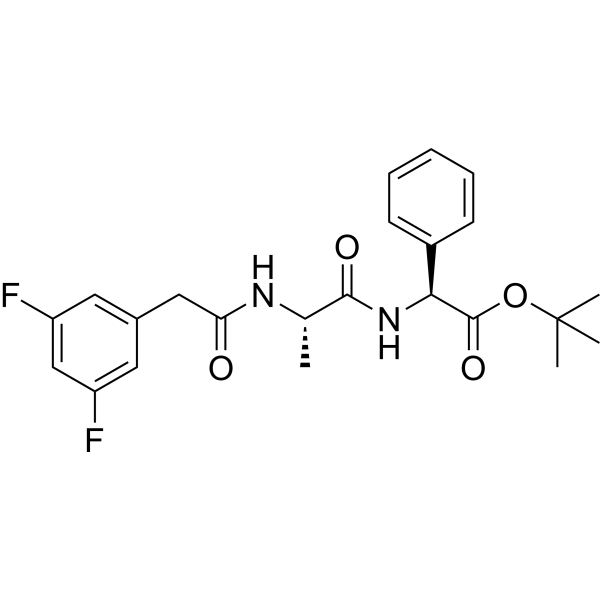
HY-13027
DAPTγ-secretase Inhibitor -
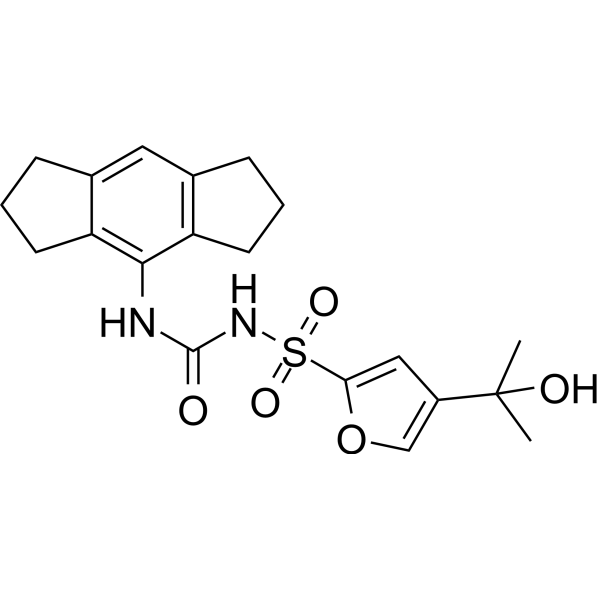
HY-12815
MCC950NLRP3 Inhibitor -
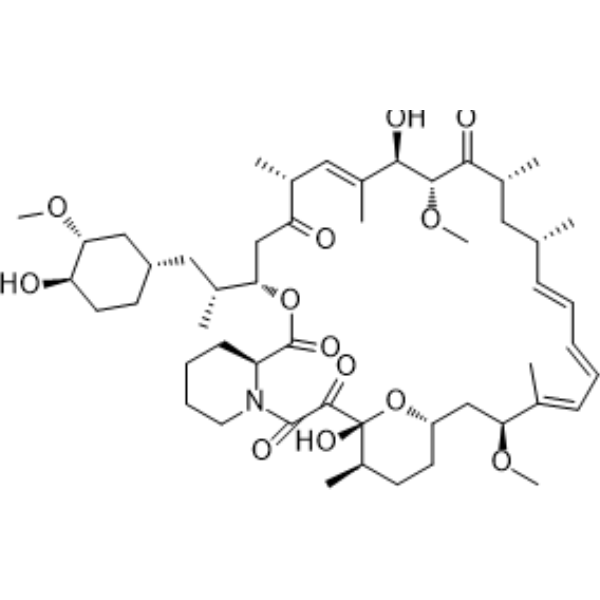
HY-10219
RapamycinmTOR Inhibitor -
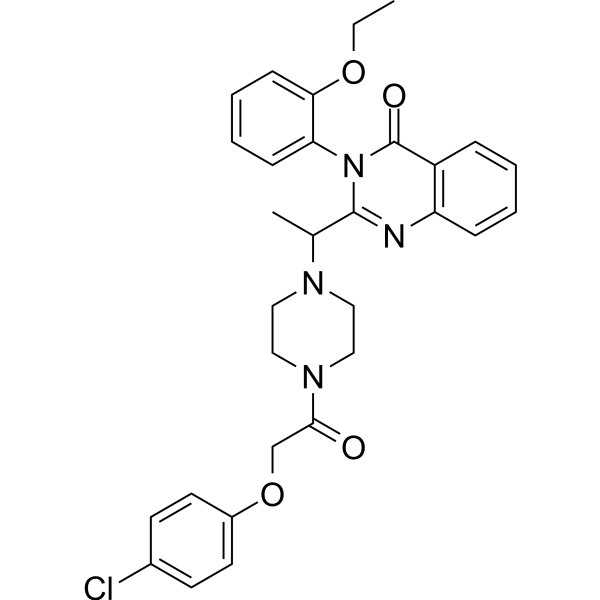
HY-15763
ErastinFerroptosis Inducer -
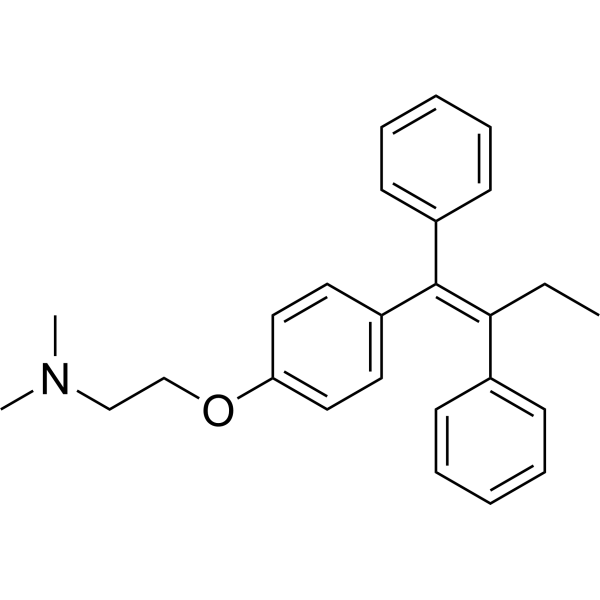
HY-13757A
TamoxifenEstrogen Receptor Modulator -
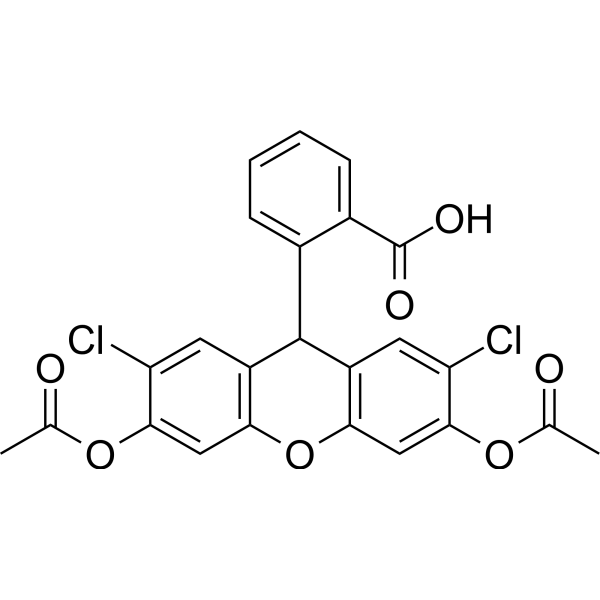
HY-D0940
H2DCFDAROS-Sensitive Probe -
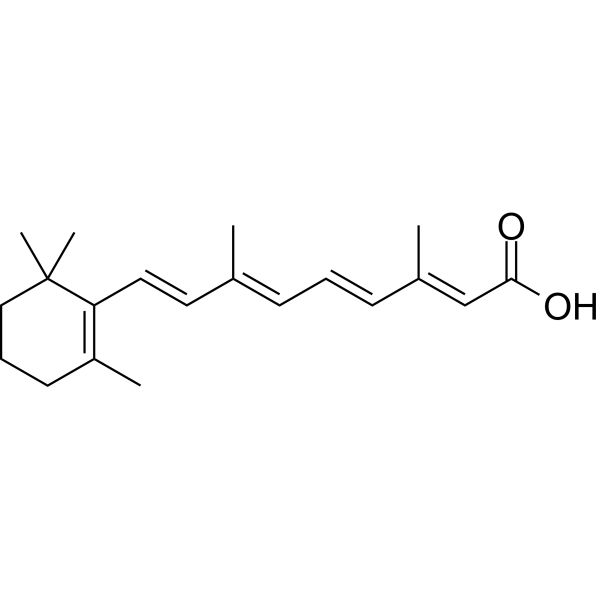
HY-14649
Retinoic acidRAR Agonist -
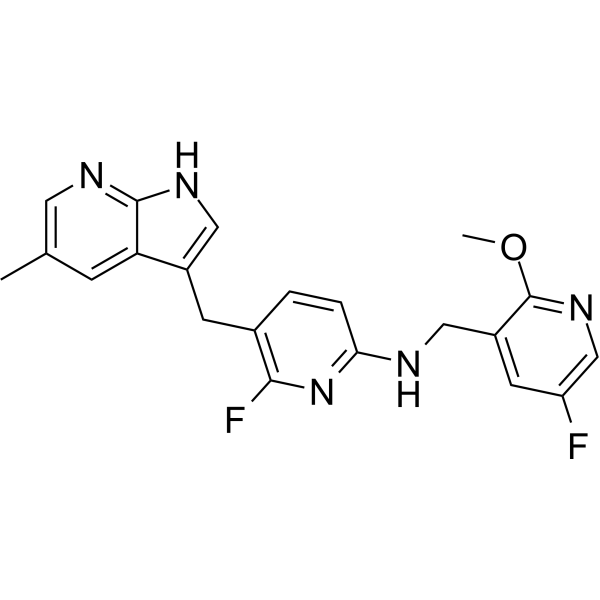
HY-114153
PLX5622CSF1R Inhibitor
Publications Citing Use of MedChemExpress (MCE) Olitigaltin
More- Autophagy. 2022 May;18(5):1020-1048. [Abstract]
- Nat Commun. 2026 Aug 6;17(1):9484.
- J Neuroinflammation. 2022 Sep 17;19(1):229. [Abstract]
- Stem Cell Res Ther. 2021 Jul 16;12(1):409. [Abstract]
- Chem Biol Interact. 2022 Dec 1:368:110218. [Abstract]
- Exp Neurol. 2023 Jul:365:114418. [Abstract]
- Cell Signal. 2021 Aug:84:110043. [Abstract]
- J Immunol. 2019 Nov 15;203(10):2712-2723. [Abstract]
- Glycobiology. 2025 Nov 24:cwaf081. [Abstract]
- Brain Res. 2026 Sep 15:1887:150382. [Abstract]
- Patent. US20230273213A1.
- Patent. US20220380473A1.
- Universität zu Köln. 2022 Feb 9.
- Patent. US20220002420A1.
 Customer Validation & Images

-
ELISA
-
WB
-
RT-PCR
-
IF
-
In Vivo Imaging
All Galectin Isoforms
More

Biological Activity
Description
IC50 & Target
[2]|
Galectin-3 14 nM (Kd) |
Galectin-1 10 nM (Kd) |
Cellular Effect
|
Cell Line

|
Type | Value | Description | References |
|---|---|---|---|---|
| Erythrocyte | IC50 |
0.3 μM
Compound: 6; TD139
|
Inhibition of moues Gal3-induced hemagglutination using mouse RBC incubated for overnight by hemagglutination assay
Inhibition of moues Gal3-induced hemagglutination using mouse RBC incubated for overnight by hemagglutination assay
|
[PMID: 33988358] |
| Monocyte | IC50 |
0.08 μM
Compound: 6; TD139
|
Inhibition of human Gal3-induced chemotaxis using human monocyte incubated for 4 hrs by calcein-AM dye based assay
Inhibition of human Gal3-induced chemotaxis using human monocyte incubated for 4 hrs by calcein-AM dye based assay
|
[PMID: 33988358] |
In Vitro
Olitigaltin (10-100 μM; 24-72 h) reduces cell viability in a dose-dependent manner in FTC-133 and 8505C thyroid cancer cells (inducing 41.1-49.7% viability reduction at 100 μM for 72 h) but does not affect viability in Nthy-ori 3-1 thyroid follicular epithelial cells[1].
Olitigaltin (10-100 μM; 10 days) abrogates the colony-forming ability of FTC-133 and 8505C thyroid cancer cells at 100 μM over 10 days[1].
Olitigaltin (10-100 μM; 24 h) inhibits migration and invasion in a dose-dependent manner in FTC-133 and 8505C thyroid cancer cells at 10 and 100 μM for 24 h, but stimulates invasion in Nthy-ori 3-1 thyroid follicular epithelial cells at 100 μM for 24 h[1].
Olitigaltin (10-100 μM; 24 h) induces apoptosis in FTC-133 and 8505C thyroid cancer cells, increasing sub-G1 cell populations to 31.3% and 35.0% respectively at 100 μM for 24 h[1].
Olitigaltin (10-100 μM; 24 h) modulates key signaling and apoptotic proteins in FTC-133 and 8505C thyroid cancer cells at 10 and 100 μM for 24 h, inducing apoptosis, attenuating AKT phosphorylation, reducing β-catenin and MMP2 expression, and increasing ERK phosphorylation[1].
Olitigaltin (10 μM; 24-48 h) attenuates SREBP1 mRNA expression in a time-dependent manner in both BHT-101 and FTC-133 thyroid cancer cells, likely independent of AKT phosphorylation[3].
MedChemExpress (MCE) has not independently confirmed the accuracy of these methods. They are for reference only.
-
Cell Line:FTC-133 human thyroid cancer cells, 8505C human thyroid cancer cells, Nthy-ori 3-1 human thyroid follicular epithelial cells
-
Concentration:10-100 μM
-
Incubation Time:24-72 h
-
Result:Reduced cell viability in FTC-133 and 8505C thyroid cancer cells in a dose-dependent manner.
Reduced cell viability by 41% in FTC-133 cells and 49% in 8505C cells at 100 μM for 72 h.
Did not affect cell viability in Nthy-ori 3-1 non-transformed thyroid follicular epithelial cells.
-
Cell Line:FTC-133 human thyroid cancer cells, 8505C human thyroid cancer cells
-
Concentration:10-100 μM
-
Incubation Time:24 h
-
Result:Increased the percentage of sub-G1 cells to 31% in FTC-133 cells and 35% in 8505C cells at 100 μM for 24 h.
Decreased the percentage of S-phase cells in both cell lines at 100 μM for 24 h.
-
Cell Line:FTC-133 human thyroid cancer cells, 8505C human thyroid cancer cells
-
Concentration:10-100 μM
-
Incubation Time:24 h
-
Result:Did not alter galectin-3 expression in either cell line.
Reduced cyclin D1 expression, increased cleaved caspase-3 expression, and induced PARP1 cleavage at 100 μM for 24 h.
Increased ERK phosphorylation, did not affect p38 MAPK phosphorylation, attenuated AKT phosphorylation, decreased β-catenin expression, and reduced MMP2 expression in both cell lines.
-
Cell Line:human thyroid cancer cell lines BHT-101 (BRAF V600E mutant), FTC-133 (wild-type BRAF)
-
Concentration:10 μM
-
Incubation Time:24-48 h
-
Result:Reduced SREBF1a and SREBF1c transcript levels in a time-dependent manner in both BHT-101 and FTC-133 cells.
Caused a substantial decrease in SREBF1a and SREBF1c mRNA after 48 h in BHT-101 cells.
Caused a moderate decrease in SREBF1a and SREBF1c mRNA after 48 h in FTC-133 cells.
In Vivo
Olitigaltin (15 mg/kg; i.p.; daily; 8 weeks) delays diabetes onset, reduces diabetes incidence to 20.0% by 30 weeks of age, improves glucose tolerance and pancreatic β cell function, and modulates islet immune cell populations in female NOD mice with spontaneous type 1 diabetes[4].
Olitigaltin (15 mg/kg; i.p.; once daily; 7 days) mitigates LPS-induced neuroinflammation, preserves excitatory synapses, restores hippocampal gamma oscillations, and improves cognitive function in male C57BL/6J mice[6].
MedChemExpress (MCE) has not independently confirmed the accuracy of these methods. They are for reference only.
-
Animal Model:C57/Bl6 (female; bleomycin-induced lung fibrosis model)[2]
-
Dosage:10 mg
-
Administration:i.t.; 4 doses (Days 18, 20, 22, 24 post-bleomycin instillation)
-
Result:Reduced total lung collagen content from 472 μg per lung to 304 μg per lung.
Decreased histologic fibrosis score from 3.8 to 2.6.
Reduced nuclear staining of active β-catenin in lung tissue.
Markedly reduced lung fibrosis, β-catenin activation, and galectin-3 expression compared to bleomycin-only controls.
-
Animal Model:NOD mice (female, 4 weeks old)[4]
-
Dosage:15 mg/kg
-
Administration:i.p.; daily; 8 weeks
-
Result:Delayed diabetes onset to ~21 weeks of age.
Reduced diabetes incidence to 20.0% at 30 weeks of age.
Improved glucose tolerance.
Increased serum insulin levels at 0 and 15 minutes during intraperitoneal glucose tolerance test.
Attenuated pancreatic immune cell infiltration and β cell destruction.
Increased the frequency of CD4+CD25+FOXP3+ T_reg cells in pancreatic islets.
Reduced perforin secretion capacity and Tc1 (CD8+IFN-γ+) cell frequency in islet CD8+ T cells.
-
Animal Model:C57BL/6J (male, 8-10 weeks old, LPS-induced neuroinflammation)[6]
-
Dosage:15 mg/kg
-
Administration:i.p.; once daily
-
Result:Reversed LPS-induced reduction in Y-maze spontaneous alternation percentage and restored the novel object recognition discrimination index toward control levels.
Suppressed LPS-induced elevations in hippocampal IL-6, TNF-α, and IL-1β protein levels, and reduced LPS-increased Gal-3 expression, proportion of Gal-3+/Iba1+ microglia, Manders' overlap coefficient between Gal-3 and Iba1, proportion of CD68+/Iba1+ microglia, and CD68 fluorescence intensity.
Restored LPS-reduced relative power in hippocampal CA1 low-gamma and high-gamma bands toward control levels.
Prevented LPS-induced reductions in CA1 pyramidal neuron spine density, dendritic complexity, and densities of VGLUT1+, PSD95+, and VGLUT1+/PSD95+ co-labeled excitatory synaptic puncta, while attenuating LPS-increased volumes of VGLUT1 and PSD95 within Iba1-segmented microglia.
- RNA extraction experimental
- Western Blot
- Collagen: Sirius Red Staining
- Annexin V plus membrane-impermeant dye apoptosis staining
- Connective Tissue: Masson's Trichrome/Collagen Trichrome Staining
- Protocol for Water Maze
- Research Protocol for Neurological Diseases
- Research Protocol for Metabolic Diseases
- Kinase activity and phosphorylation assays
- Fibrosis/Collagen Morphometry
- Detection of Apoptosis
- TUNEL staining for apoptotic DNA fragmentation
- Research Protocol for Endocrine Diseases
- Apoptosis Solutions
- Protocol for Kinase activity and phosphorylation assays
Clinical Trial
| NCT Number | Sponsor | Condition | Start Date |
Phase
|
|---|---|---|---|---|
| NCT01329991 | Plexxikon| | 2011-05 | PHASE1 |


Chemical Information
-
CAS No. 1450824-22-2
-
Appearance Solid
-
Molecular Weight 648.64
-
Formula C28H30F2N6O8S
-
Color White to off-white
-
SMILES
O[C@H]([C@@H](N1N=NC(C2=CC=CC(F)=C2)=C1)[C@H]([C@@H](CO)O3)O)[C@@H]3S[C@H]4[C@@H]([C@@H](N5N=NC(C6=CC=CC(F)=C6)=C5)[C@H]([C@@H](CO)O4)O)O
-
Synonyms
TD139; GB0139
-
Shipping
Room temperature in continental US; may vary elsewhere.
-
Storage
Powder -20°C 3 years 4°C 2 years In solvent -80°C 6 months -20°C 1 month


Publications (14)
-
Journal Impact Factor
-
Most Recent
-
Autophagy
LGALS3 (galectin 3) mediates an unconventional secretion of SNCA/α-synuclein in response to lysosomal membrane damage by the autophagic-lysosomal pathway in human midbrain dopamine neurons. [Abstract]2022 May;18(5):1020-1048. PMID: 34612142
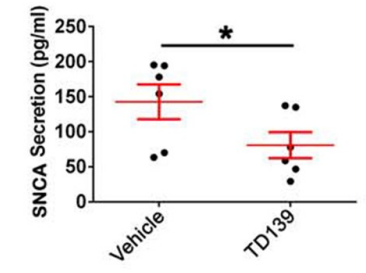
Olitigaltin purchased from MedChemExpress. Usage Cited in: Autophagy. 2022 May;18(5):1020-1048. [Abstract]
Relative fold difference in SNCA from mDA cultured media treated with Olitigaltin (TD139) (5 μM) or vehicle (0.1% DMSO) treated control after 24 h measured by ELISA. The results showed that TD139 treatment significantly reduced SNCA secretion compared to vehicle.
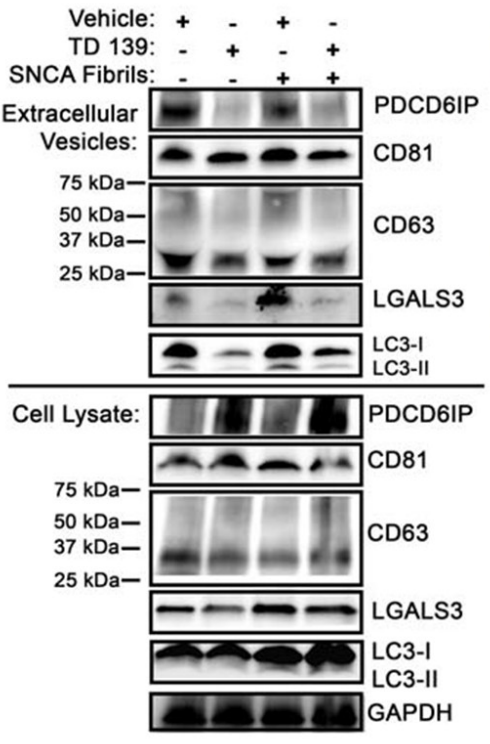
Olitigaltin purchased from MedChemExpress. Usage Cited in: Autophagy. 2022 May;18(5):1020-1048. [Abstract]
Representative non-reducing SDS-PAGE of concentrated EVs and the corresponding lysates from mDA neurons treated with vehicle, Olitigaltin (TD139, 1 µM; 24 h), SNCA fibrils, or TD139 + SNCA fibrils.
-
-
J Neuroinflammation
Genetic targeting or pharmacological inhibition of galectin-3 dampens microglia reactivity and delays retinal degeneration. [Abstract]2022 Sep 17;19(1):229. PMID: 36115971
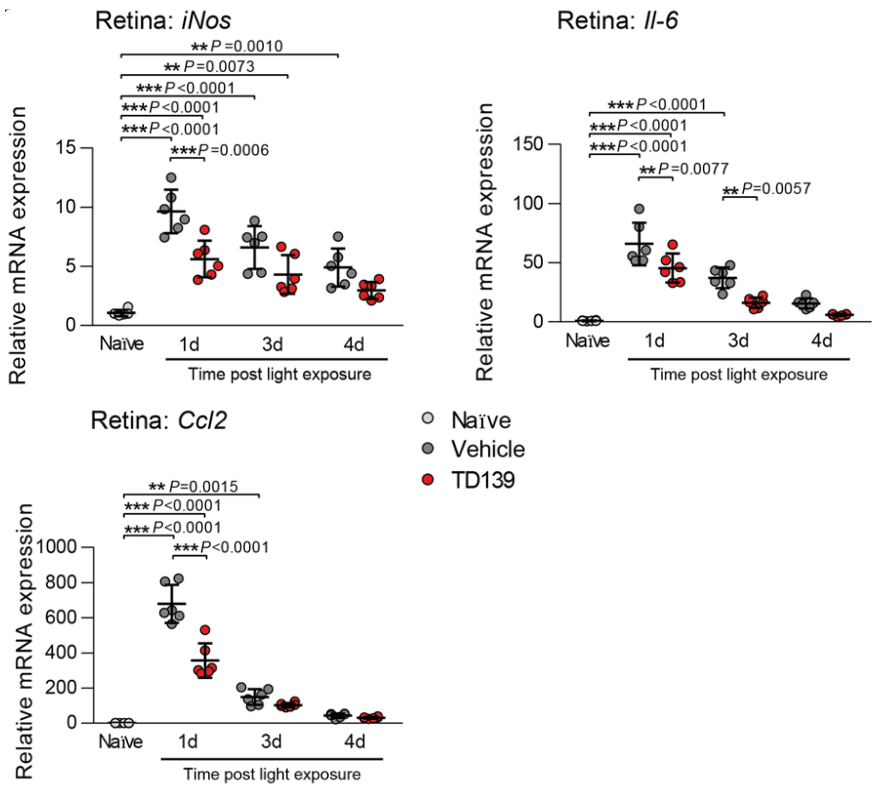
Olitigaltin purchased from MedChemExpress. Usage Cited in: J Neuroinflammation. 2022 Sep 17;19(1):229. [Abstract]
Relative mRNA expression of pro-inflammatory cytokines in retinas of naïve and light-exposed mice treated with vehicle or Olitigaltin (TD139, 15 mg/kg; i.p.; once daily) normalized to the reference gene Atp5b. The results showed that following treatment with TD139, the expression levels of iNOS, IL-6, and CCL2—induced by light damage—were also reduced.
Olitigaltin purchased from MedChemExpress. Usage Cited in: J Neuroinflammation. 2022 Sep 17;19(1):229. [Abstract]
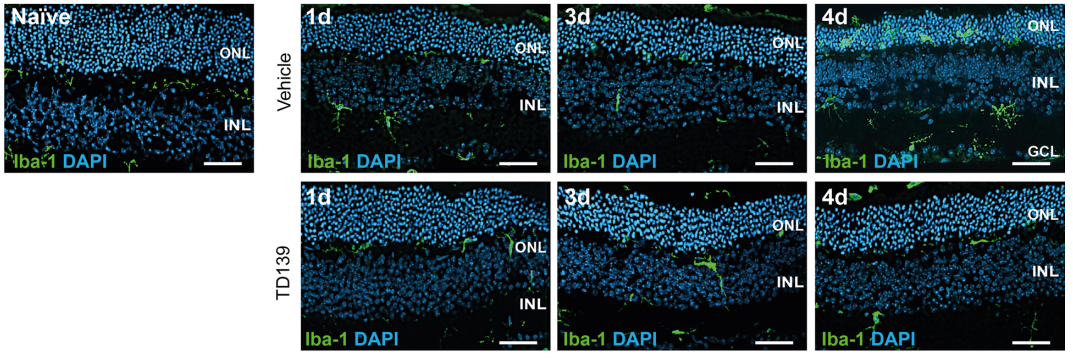
Olitigaltin (TD139, 15 mg/kg; i.p.; once daily) reduced microglia migration in light-exposed retinas. Representative images of Iba-1+ cells in naïve and light-exposed mice treated with vehicle or TD139 at the indicated time points. Scale bar: 50 µm. ONL, outer nuclear layer and INL, inner nuclear layer.
Olitigaltin purchased from MedChemExpress. Usage Cited in: J Neuroinflammation. 2022 Sep 17;19(1):229. [Abstract]
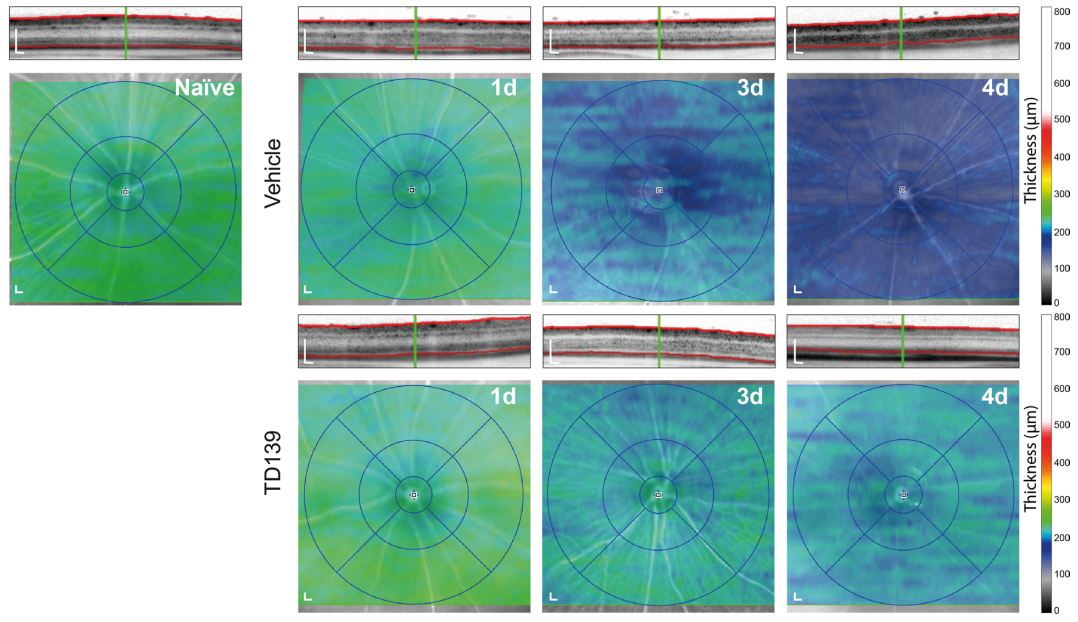
Olitigaltin (TD139, 15 mg/kg; i.p.; once daily) delayed light-induced retinal degeneration. Representative SD-OCT scans and heat maps of retinal thickness from naïve and light-exposed mice treated with vehicle or TD139. Scale bar: 200 µm.
-
Stem Cell Res Ther
Mesenchymal stem cells ameliorate renal fibrosis by galectin-3/Akt/GSK3β/Snail signaling pathway in adenine-induced nephropathy rat. [Abstract]2021 Jul 16;12(1):409. PMID: 34271976 -
Chem Biol Interact
Inhibition of Galectin-3 attenuates silica particles-induced silicosis via regulating the GSK-3β/β-catenin signal pathway-mediated epithelial-mesenchymal transition. [Abstract]2022 Dec 1:368:110218. PMID: 36223831 -
Exp Neurol
2023 Jul:365:114418. PMID: 37085003 -
Cell Signal
Secretory Galectin-3 promotes hepatic steatosis via regulation of the PPARγ/CD36 signaling pathway. [Abstract]2021 Aug:84:110043. PMID: 33991615 -
J Immunol
Gasdermin D Drives the Nonexosomal Secretion of Galectin-3, an Insulin Signal Antagonist. [Abstract]2019 Nov 15;203(10):2712-2723. PMID: 31597705 -
Glycobiology
Galectin-3 facilitates helicobacter pylori-induced apoptosis independently of sensing lysosomal damage. [Abstract]2025 Nov 24:cwaf081. PMID: 41283852 -
Brain Res
Galectin-3 in microglia mediates neuroinflammation-induced cognitive dysfunction via selective elimination of excitatory synapses in hippocampal CA1. [Abstract]2026 Sep 15:1887:150382. PMID: 42114797 -
-
-
-


Solvent & Solubility
In Vitro:
DMSO : 50 mg/mL (77.08 mM; Need ultrasonic; Hygroscopic DMSO has a significant impact on the solubility of product, please use newly opened DMSO)
H2O : < 0.1 mg/mL (insoluble)
Please refer to the solubility information to select the appropriate solvent. Once prepared, please aliquot and store the solution to prevent product inactivation from repeated freeze-thaw cycles.
Storage method and period of stock solution: -80°C, 6 months; -20°C, 1 month. When stored at -80°C, please use it within 6 months. When stored at -20°C, please use it within 1 month.
Please refer to the solubility information to select the appropriate solvent. Once prepared, please aliquot and store the solution to prevent product inactivation from repeated freeze-thaw cycles.
Storage method and period of stock solution: -80°C, 6 months; -20°C, 1 month. When stored at -80°C, please use it within 6 months. When stored at -20°C, please use it within 1 month.
Concentration (start) × Volume (start) = Concentration (final) × Volume (final)
In Vivo:
Select the appropriate dissolution method based on your experimental animal and administration route.
- For the following dissolution methods, please ensure to first prepare a clear stock solution using an In Vitro approach and then sequentially add co-solvents:
- To ensure reliable experimental results, the clarified stock solution can be appropriately stored based on storage conditions. As for the working solution for In Vivo experiments, it is recommended to prepare freshly and use it on the same day.
- The percentages shown for the solvents indicate their volumetric ratio in the final prepared solution. If precipitation or phase separation occurs during preparation, heat and/or sonication can be used to aid dissolution.
Add each solvent one by one: 10% DMSO 40% PEG300 5% Tween-80 45% Saline
Solubility: ≥ 2.5 mg/mL (3.85 mM); Clear solution
This protocol yields a clear solution of ≥ 2.5 mg/mL (saturation unknown).
Taking 1 mL working solution as an example, add 100 μL DMSO stock solution (25.0 mg/mL) to 400 μL PEG300, and mix evenly; then add 50 μL Tween-80 and mix evenly; then add 450 μL Saline to adjust the volume to 1 mL.
Preparation of Saline: Dissolve 0.9 g sodium chloride in ddH₂O and dilute to 100 mL to obtain a clear Saline solution.
Add each solvent one by one: 10% DMSO 90% (20% SBE-β-CD in Saline)
Solubility: ≥ 2.5 mg/mL (3.85 mM); Clear solution
This protocol yields a clear solution of ≥ 2.5 mg/mL (saturation unknown).
Taking 1 mL working solution as an example, add 100 μL DMSO stock solution (25.0 mg/mL) to 900 μL 20% SBE-β-CD in Saline, and mix evenly.
Preparation of 20% SBE-β-CD in Saline (4°C, storage for one week): 2 g SBE-β-CD powder is dissolved in 10 mL Saline, completely dissolve until clear.
For the following dissolution methods, please prepare the working solution directly:
It is recommended to prepare fresh solutions and use them promptly within a short period of time.
The percentages shown for the solvents indicate their volumetric ratio in the final prepared solution. If precipitation or phase separation occurs during preparation, heat and/or sonication can be used to aid dissolution.
Add each solvent one by one: 10% HP-β-CD in Saline water
Solubility: 3.33 mg/mL (5.13 mM); Clear solution; Need ultrasonic
Add each solvent one by one: 15% Cremophor EL 85% Saline
Solubility: 2 mg/mL (3.08 mM); Clear solution; Need ultrasonic
In Vivo Dissolution Calculator
Please enter the basic information of animal experiments:
-
-
-
-
Recommended: Prepare an additional quantity of animals to account for potential losses during experiments.
Please enter your animal formula composition:
-
%DMSO +
Recommended: Keep the proportion of DMSO in working solution below 2% if your animal is weak.
-
%+
-
+%Tween-80 + +
-
%Saline +
The co-solvents required include: DMSO, . All of co-solvents are available by MedChemExpress (MCE). , Tween 80. All of co-solvents are available by MedChemExpress (MCE).
Working solution concentration: 0.22 mg/mL
Method for preparing stock solution: mg drug dissolved in μL DMSO. Stock solution concentration: mg/mL.
1. Take μL DMSO stock solution;
2. Add μL .
μL , mix evenly;
3. Then add μL Tween 80, mix evenly;
4. Then add μL
Please ensure that the stock solution in the first step is dissolved to a clear state, and add co-solvents in sequence. You can use ultrasonic heating (ultrasonic cleaner, recommended frequency 20-40 kHz), vortexing, etc. to assist dissolution.


Purity & Documentation
-
Data Sheet (307 KB)
-
SDS (396 KB)
- English - EN (396 KB)
- Français - FR (396 KB)
- Deutsch - DE (396 KB)
- Norwegian - NO (396 KB)
- Español - ES (396 KB)
- Swedish - SV (396 KB)
- Italian - IT (396 KB)
- Korean - KR (396 KB)
- Portuguese - PT (396 KB)
-
Handling Instructions (2659 KB)
References
[1]. Lee JJ, et al. Galectin-3 Inhibitors Suppress Anoikis Resistance and Invasive Capacity in Thyroid Cancer Cells. International journal of endocrinology. 2021;2021:5583491. [Content Brief]
[2]. Mackinnon AC, et al. Regulation of transforming growth factor-β1-driven lung fibrosis by galectin-3. American journal of respiratory and critical care medicine. 2012 Mar 01;185(5):537-46. [Content Brief]
[3]. Huang TS, et al. Regulation of Expression of Sterol Regulatory Element-binding Protein 1 in Thyroid Cancer Cells. Anticancer research. 2022 May;42(5):2487-2493. [Content Brief]
[5]. Volarevic V, et al. Galectin-3 deficiency prevents concanavalin A-induced hepatitis in mice. Hepatology (Baltimore, Md.). 2012 Jun;55(6):1954-64. [Content Brief]
[6]. Wu HP, et al. Galectin-3 in microglia mediates neuroinflammation-induced cognitive dysfunction via selective elimination of excitatory synapses in hippocampal CA1. Brain research. 2026 Sep 15;1887:150382. [Content Brief]


Complete Stock Solution Preparation Table
Please refer to the solubility information to select the appropriate solvent. Once prepared, please aliquot and store the solution to prevent product inactivation from repeated freeze-thaw cycles.
Storage method and period of stock solution: -80°C, 6 months; -20°C, 1 month. When stored at -80°C, please use it within 6 months. When stored at -20°C, please use it within 1 month.
| Optional Solvent | Concentration Solvent Mass | 1 mg | 5 mg | 10 mg | 25 mg |
|---|---|---|---|---|---|
| DMSO | 1 mM | 1.5417 mL | 7.7084 mL | 15.4169 mL | 38.5422 mL |
| 5 mM | 0.3083 mL | 1.5417 mL | 3.0834 mL | 7.7084 mL | |
| 10 mM | 0.1542 mL | 0.7708 mL | 1.5417 mL | 3.8542 mL | |
| 15 mM | 0.1028 mL | 0.5139 mL | 1.0278 mL | 2.5695 mL | |
| 20 mM | 0.0771 mL | 0.3854 mL | 0.7708 mL | 1.9271 mL | |
| 25 mM | 0.0617 mL | 0.3083 mL | 0.6167 mL | 1.5417 mL | |
| 30 mM | 0.0514 mL | 0.2569 mL | 0.5139 mL | 1.2847 mL | |
| 40 mM | 0.0385 mL | 0.1927 mL | 0.3854 mL | 0.9636 mL | |
| 50 mM | 0.0308 mL | 0.1542 mL | 0.3083 mL | 0.7708 mL | |
| 60 mM | 0.0257 mL | 0.1285 mL | 0.2569 mL | 0.6424 mL |


Olitigaltin Related Classifications
HY-19940 Related Classifications
 Powered by Bioz
Keywords
- Olitigaltin
- 1450824-22-2
- TD139
- GB0139
- TD 139
- TD-139
- GB0139
- GB 0139
- GB-0139
- Galectin
- Akt
- β-catenin
- Apoptosis
- ERK
- carbohydrate recognition domain
- AKT/β-catenin pathway
- anoikis resistance
- pancreatic β cell
- neuroinflammation
- bleomycin-induced lung fibrosis
- galectin-3
- concanavalin A-induced hepatitis
- thyroid cancer cells
- regulatory T cell
- Inhibitor
- inhibitor
- inhibit