



MS-444
Based on 4 publication(s) in Google Scholar
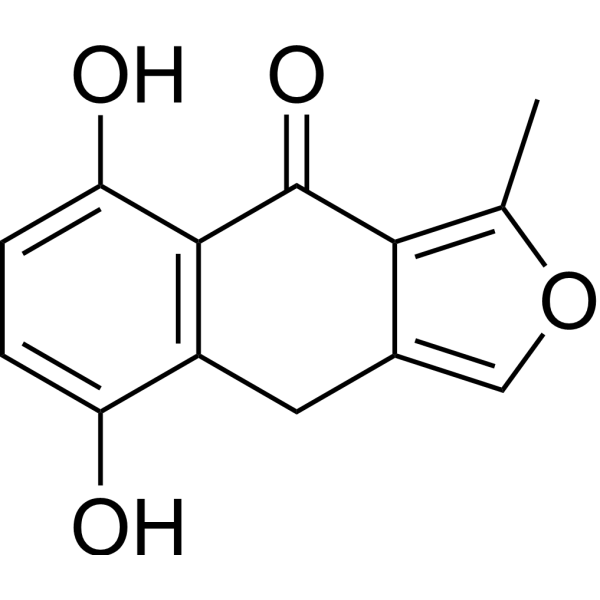
MS-444 (BE-34776) is a HuR (ELAVL1) inhibitor that blocks the cytoplasmic translocation of HuR and inhibits its dimerization. MS-444 reduces cytoplasmic HuR levels by preventing the binding of HuR to ARE-mRNA, without altering the total expression of HuR. MS-444 induces apoptosis, inhibits cell growth, angiogenesis and invasion, and also regulates immune function and microbiota. MS-444 effectively alters the number, size and invasiveness of tumors in various cancer models. MS-444 is tolerable to intraperitoneal injection in vivo and can be applied to research related to colorectal cancer, familial adenomatous polyposis, colitis-associated cancer and glioblastoma.
Nos produits utilisent uniquement pour la recherche. Nous ne vendons pas aux patients.
- Pureté : 98.75%
- CAS No.: 150045-18-4
- Formule: C13H10O4
- Masse moléculaire:230.22
-
Stockage:
-20°C, protect from light, stored under nitrogen
* In solvent : -80°C, 6 months; -20°C, 1 month (protect from light, stored under nitrogen)

To place orders, for customer services and technical support, please contact: MedChemExpress USA
Tel: 609-228-6898 E-mail: [email protected] [email protected]


-
 Activité biologique
-
Chemical Information
-
Solvant et solubilité
- Protocole
- Pureté et documentation
- Références
-
 Help & FAQs


-
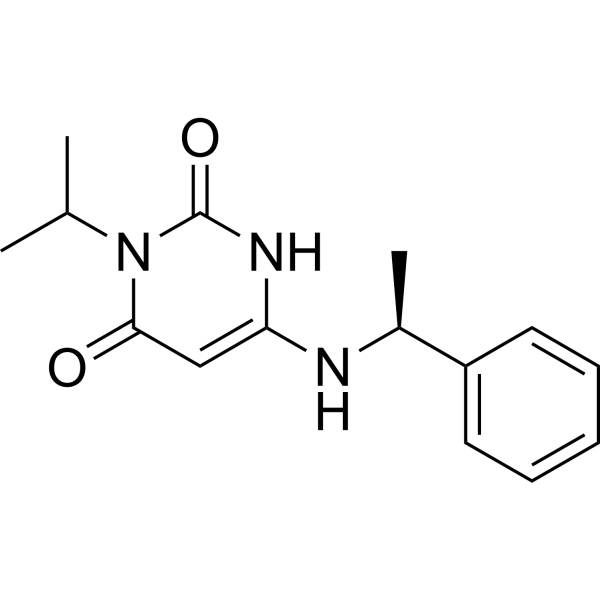
HY-109037
MavacamtenCardiac Myosin Modulator -
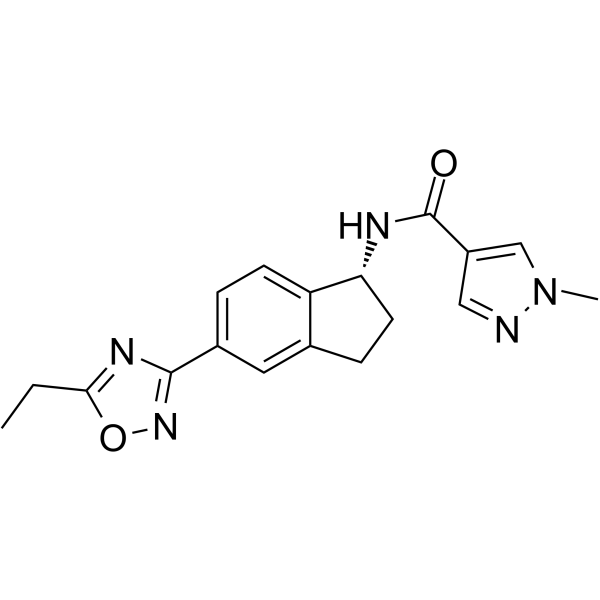
HY-139465
AficamtenCardiac Myosin Inhibitor -
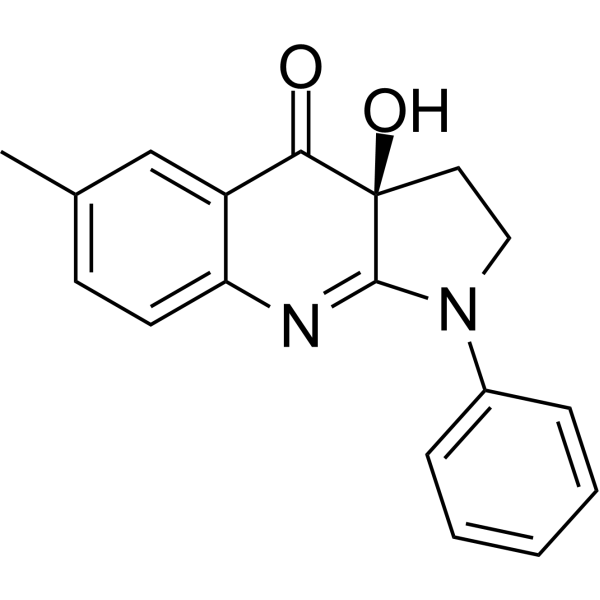
HY-13441
(-)-BlebbistatinMyosin II ATPase Inhibitor -
HY-17364
TemozolomideDNA Alkylator -
HY-13813
BlebbistatinMyosin II Inhibitor -
HY-15465
KN-93CaMK II Inhibitor -
HY-16690
BTSMyosin S1 ATPase Inhibitor -
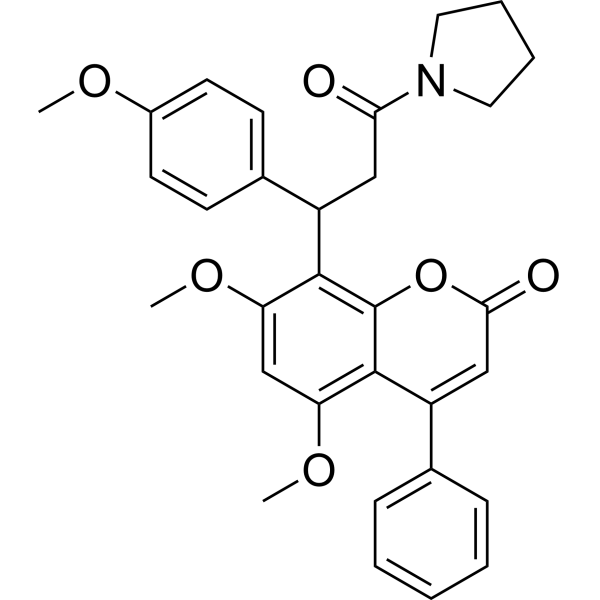
HY-124828
CMLD-2HuR-ARE Interaction Inhibitor -
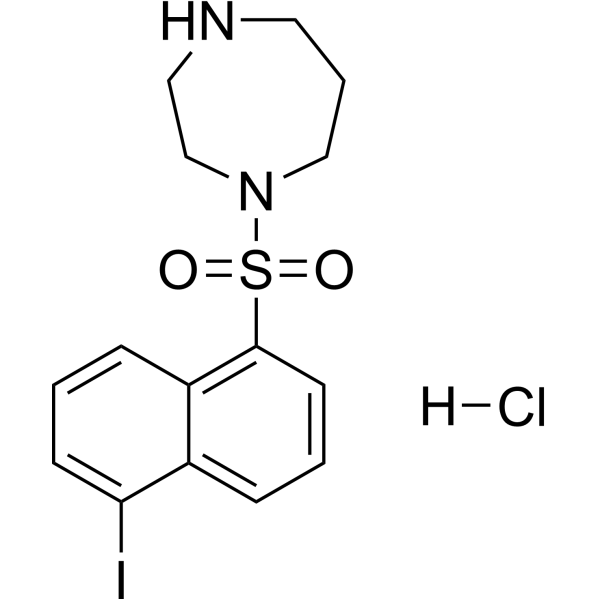
HY-15417
ML-7 hydrochlorideMLCK Inhibitor -
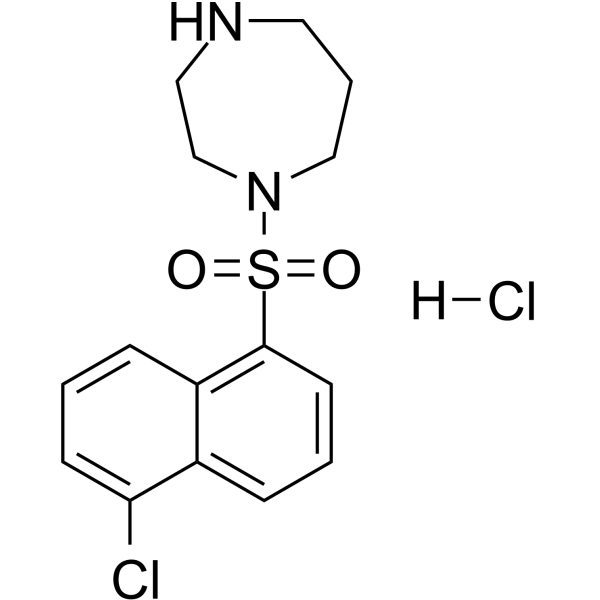
HY-100932
ML-9Akt Kinase Inhibitor -
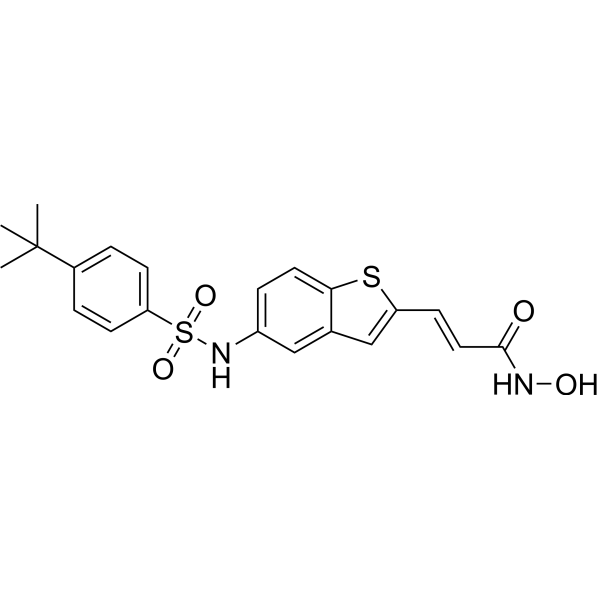
HY-134601
KH-3Hu Antigen R Inhibitor -

HY-107657
(+)-BlebbistatinMyosin II Inhibitor
Publications Citing Use of MedChemExpress (MCE) MS-444
More

Activité biologique
Description
IC50 & Target
|
COX-2 |
Cellular Effect
|
Cell Line

|
Type | Value | Description | References |
|---|---|---|---|---|
| Monocyte | IC50 |
2.1 μM
Compound: 2, MS-444
|
Inhibition of COX-2 gene expression in LPS/INF-gamma-stimulated human primary monocytes by RT-PCR analysis
Inhibition of COX-2 gene expression in LPS/INF-gamma-stimulated human primary monocytes by RT-PCR analysis
|
[PMID: 17632515] |
| Monocyte | IC50 |
2.4 μM
Compound: 2, MS-444
|
Inhibition of IL-6 gene expression in LPS/INF-gamma-stimulated human primary monocytes by RT-PCR analysis
Inhibition of IL-6 gene expression in LPS/INF-gamma-stimulated human primary monocytes by RT-PCR analysis
|
[PMID: 17632515] |
| Monocyte | IC50 |
3.7 μM
Compound: 2, MS-444
|
Inhibition of IL1-beta gene expression in LPS/INF-gamma-stimulated human primary monocytes by RT-PCR analysis
Inhibition of IL1-beta gene expression in LPS/INF-gamma-stimulated human primary monocytes by RT-PCR analysis
|
[PMID: 17632515] |
In Vitro
MS-444 (1-40.70 μM; 48 h) inhibits growth of HCT116, HCA-7, RKO, HT-29, and SW480 CRC cells with IC50 values ranging from 5.60 μM to 14.21 μM after 48 h, while non-transformed RIE-1 and YAMC intestinal cells are ~3- to 4-fold less sensitive with IC50 values of 40.70 μM and 28.16 μM, respectively[1].
MS-444 (10 μM; 48 h) induces apoptotic nuclear morphology in RKO, HCA-7, and HCT116 CRC cells after 48 h, but has no effect on non-transformed RIE-1 intestinal cells[1].
MS-444 (10 μM; 8 h) promotes nuclear localization of HuR in Ras-transformed RIE-iRas and YAMC-Ras intestinal cells after 8 h, while non-transformed RIE-1 and YAMC cells show no change in HuR localization[1].
MS-444 (1.5-25 μM; 8 h) inhibits COX-2 mRNA expression in HCA-7 CRC cells with an IC50 of 6.75 μM and reduces COX-2 protein levels in a dose-dependent manner after 8 h of treatment[1].
MS-444 (50 μM) reduces LPS-induced IL18 mRNA expression in RAW 264.7 wild-type macrophages[2].
MS-444 (5-80 μM; 24 h) dose-dependently inhibits invasion of JX12, U87, and U251 human glioblastoma cells and JX12 CD133+ BTICs in a matrigel transwell model, with maximal suppression at 20-80 μM depending on the cell type[3].
MedChemExpress (MCE) has not independently confirmed the accuracy of these methods. They are for reference only.
-
Cell Line:colorectal cancer (CRC) cell lines (HCT116, HCA-7, RKO, HT-29, SW480), non-transformed intestinal epithelial cell lines (RIE-1, YAMC)
-
Concentration:1-40.70 μM
-
Incubation Time:48 h
-
Result:Inhibited growth in all CRC cell lines with IC50 values of 5.60 μM (RKO), 12.84 μM (HCA-7), 10.98 μM (HCT116), 14.21 μM (HT-29), and 10.98 μM (SW480).
Reduced growth of non-transformed RIE-1 and YAMC cells with IC50 values of 40.70 μM and 28.16 μM, respectively (P < 0.05).
Caused observable growth inhibition at 10 μM in CRC cells.
-
Cell Line:human glioblastoma xenolines (JX12 parent, CD133+ BTICs), U87 glioma cell line, U251 glioma cell line
-
Concentration:5, 10, 20 µM (JX12 parent and CD133+ BTICs); 10, 20, 40, 80 µM (U87 and U251 cells)
-
Incubation Time:24 h
-
Result:Significantly inhibited invasion in all tested glioblastoma cells at sub-lethal doses.
Reduced invading JX12 parent cells by 95% at 20 µM.
Reduced invading CD133+ BTICs by 80% at 10 µM.
Reduced invading U87 cells by 80-90% at 80 µM.
Showed dose-dependent attenuation of invasion in U251 cells, with maximal reduction at 40 µM.
Inhibited invasion at shorter 6 and 12 h treatment intervals, confirming effects were not due to cell death.
In Vivo
MS-444 (25 mg/kg; i.p.; every 48 hr) significantly inhibits HCA-7 colorectal cancer xenograft tumor growth in athymic nude mice and reduces tumor COX-2 protein expression[1].
MS-444 (25 mg/kg; i.p.; every 72 hr for 15 days then daily for 7 days) significantly reduces established HCA-7 colorectal cancer xenograft tumor volume and COX-2 expression in athymic nude mice[1].
MS-444 (10 mg/kg; i.p.; biweekly; duration of AOM/DSS treatment cycles) increases colorectal tumor burden, size, and invasiveness in AOM/DSS-induced colorectal cancer mice, while reducing tumor cell apoptosis, serum IL18 levels, and tumor-infiltrating eosinophils[2].
MS-444 (10 mg/kg; i.p.; biweekly; 9 weeks) reduces total and small intestinal tumor numbers in APCMin mice, while altering the fecal microbiota composition and restoring spleen architecture[2].
MS-444 (10-25 mg/kg; i.p.; biweekly) promotes epithelial regeneration in acute DSS-induced colitis in mice at 10 mg/kg, while higher doses exacerbate epithelial damage[2].
MedChemExpress (MCE) has not independently confirmed the accuracy of these methods. They are for reference only.
-
Animal Model:Athymic nude (Nu/Nu)[1]
-
Dosage:25 mg/kg
-
Administration:i.p.; every 72 hr for 15 days, then daily for 7 days
-
Result:Showed no significant tumor volume change until daily dosing began on day 14.
Reduced tumor volume significantly compared to controls by day 21.
Reduced COX-2 protein expression observed via ex vivo fluorescence imaging.
Reduced COX-2 mRNA expression significantly confirmed by qPCR.
-
Animal Model:C57BL/6J (3% DSS-induced)[2]
-
Dosage:10 mg/kg; 25 mg/kg
-
Administration:i.p.; biweekly
-
Result:Resulted in only 9% loss of the epithelial lining (compared to higher loss in controls and 24% loss with 25 mg/kg MS-444) at 10 mg/kg dose.
Promoted epithelial regeneration at 10 mg/kg dose.
Shifted HuR from the nucleus to the cytoplasm in intestinal tissue in a dose-dependent manner.
Exacerbated epithelial damage at 25 mg/kg dose.
- RNA extraction experimental
- Human pluripotent stem cell endothelial-cell differentiation
- Vascular/Branching Fractal Analysis
- Annexin V plus membrane-impermeant dye apoptosis staining
- Somatic Cell Culture
- Research Protocol for Microbiome Analysis
- CCK-8/WST-8 Cell Proliferation Assay
- Cell Counting-Based Growth Curve Assay
- Cell Viability Determination by MTT Colorimetric Assay
- How to Select the Route of Administration for Mammals
- Detection of Apoptosis
- TUNEL staining for apoptotic DNA fragmentation
- Protocol for Cell Counting and Cell Density Analysis
- DSS-Induced Colitis
- TNBS-Induced Colitis
- Endothelial Tube Formation Assay
- Apoptosis Solutions
- Cell invasion
- MTT Cell Proliferation Assay
- Endothelial Cell Migration/Angiogenic Sprouting Assay


Chemical Information
-
CAS No. 150045-18-4
-
Appearance Solid
-
Masse moléculaire 230.22
-
Formule C13H10O4
-
Color Light yellow to brown
-
SMILES
O=C(C1=C(C)OC=C1C2)C3=C2C(O)=CC=C3O
-
Synonyms
BE-34776
-
Livraison
Room temperature in continental US; may vary elsewhere.
-
Stockage
-20°C, protect from light, stored under nitrogen
* In solvent : -80°C, 6 months; -20°C, 1 month (protect from light, stored under nitrogen)


Publications (4)
-
Journal Impact Factor
-
Most Recent
-
EMBO J
RNA-binding proteins hnRNPM and ELAVL1 promote type-I interferon induction downstream of the nucleic acid sensors cGAS and RIG-I. [Abstract]2025 Feb;44(3):824-853. PMID: 39707025 -
JCI Insight
Targeting HuR-Vav3 mRNA interaction prevents Pseudomonas aeruginosa adhesion to the cystic fibrosis airway epithelium. [Abstract]2023 Feb 8;8(3):e161961. PMID: 36602863 -
RSC Adv
An approach for the systematic profiling of drug-induced remodeling of RNA-RBP (RNA-binding protein) interactions. [Abstract]2026 May 19;16(29):27057-27068. PMID: 42170088 -
bioRxiv
2026 Apr 9:2026.04.07.716919. PMID: 41993498


Solvant et solubilité
In Vitro:
DMSO : 50 mg/mL (217.18 mM; Need ultrasonic; Hygroscopic DMSO has a significant impact on the solubility of product, please use newly opened DMSO)
N-Methylpyrrolidone (NMP) : 20 mg/mL (86.87 mM; Need ultrasonic)
Please refer to the solubility information to select the appropriate solvent. Once prepared, please aliquot and store the solution to prevent product inactivation from repeated freeze-thaw cycles.
Storage method and period of stock solution: -80°C, 6 months; -20°C, 1 month (protect from light, stored under nitrogen). When stored at -80°C, please use it within 6 months. When stored at -20°C, please use it within 1 month.
Please refer to the solubility information to select the appropriate solvent. Once prepared, please aliquot and store the solution to prevent product inactivation from repeated freeze-thaw cycles.
Storage method and period of stock solution: -80°C, 6 months; -20°C, 1 month (protect from light, stored under nitrogen). When stored at -80°C, please use it within 6 months. When stored at -20°C, please use it within 1 month.
Concentration (start) × Volume (start) = Concentration (final) × Volume (final)
In Vivo:
Select the appropriate dissolution method based on your experimental animal and administration route.
- For the following dissolution methods, please ensure to first prepare a clear stock solution using an In Vitro approach and then sequentially add co-solvents:
- To ensure reliable experimental results, the clarified stock solution can be appropriately stored based on storage conditions. As for the working solution for In Vivo experiments, it is recommended to prepare freshly and use it on the same day.
- The percentages shown for the solvents indicate their volumetric ratio in the final prepared solution. If precipitation or phase separation occurs during preparation, heat and/or sonication can be used to aid dissolution.
Add each solvent one by one: 10% DMSO 40% PEG300 5% Tween-80 45% Saline
Solubility: 2 mg/mL (8.69 mM); Suspended solution; Need ultrasonic
This protocol yields a suspended solution of 2 mg/mL. Suspended solution can be used for oral and intraperitoneal injection.
Taking 1 mL working solution as an example, add 100 μL DMSO stock solution (20.0 mg/mL) to 400 μL PEG300, and mix evenly; then add 50 μL Tween-80 and mix evenly; then add 450 μL Saline to adjust the volume to 1 mL.
Preparation of Saline: Dissolve 0.9 g sodium chloride in ddH₂O and dilute to 100 mL to obtain a clear Saline solution.
Add each solvent one by one: 10% DMSO 90% (20% SBE-β-CD in Saline)
Solubility: 2 mg/mL (8.69 mM); Suspended solution; Need ultrasonic
This protocol yields a suspended solution of 2 mg/mL. Suspended solution can be used for oral and intraperitoneal injection.
Taking 1 mL working solution as an example, add 100 μL DMSO stock solution (20.0 mg/mL) to 900 μL 20% SBE-β-CD in Saline, and mix evenly.
Preparation of 20% SBE-β-CD in Saline (4°C, storage for one week): 2 g SBE-β-CD powder is dissolved in 10 mL Saline, completely dissolve until clear.
For the following dissolution methods, please prepare the working solution directly:
It is recommended to prepare fresh solutions and use them promptly within a short period of time.
The percentages shown for the solvents indicate their volumetric ratio in the final prepared solution. If precipitation or phase separation occurs during preparation, heat and/or sonication can be used to aid dissolution.
Add each solvent one by one: Corn Oil
Solubility: 5 mg/mL (21.72 mM); Suspended solution; Need ultrasonic
Add each solvent one by one: 10% NMP 90% PBS
Solubility: 2 mg/mL (8.69 mM); Suspended solution; Need ultrasonic and warming and heat to 50°C
In Vivo Dissolution Calculator
Please enter the basic information of animal experiments:
-
-
-
-
Recommended: Prepare an additional quantity of animals to account for potential losses during experiments.
Please enter your animal formula composition:
-
%DMSO +
Recommended: Keep the proportion of DMSO in working solution below 2% if your animal is weak.
-
%+
-
+%Tween-80 + +
-
%Saline +
The co-solvents required include: DMSO, . All of co-solvents are available by MedChemExpress (MCE). , Tween 80. All of co-solvents are available by MedChemExpress (MCE).
Working solution concentration: 0.22 mg/mL
Method for preparing stock solution: mg drug dissolved in μL DMSO. Stock solution concentration: mg/mL. * In solvent : -80°C, 6 months; -20°C, 1 month (protect from light, stored under nitrogen)
1. Take μL DMSO stock solution;
2. Add μL .
μL , mix evenly;
3. Then add μL Tween 80, mix evenly;
4. Then add μL
Please ensure that the stock solution in the first step is dissolved to a clear state, and add co-solvents in sequence. You can use ultrasonic heating (ultrasonic cleaner, recommended frequency 20-40 kHz), vortexing, etc. to assist dissolution.


Pureté et documentation
-
Fiche technique (290 KB)
-
SDS (393 KB)
- English - EN (393 KB)
- Français - FR (393 KB)
- Deutsch - DE (393 KB)
- Norwegian - NO (393 KB)
- Español - ES (393 KB)
- Swedish - SV (393 KB)
- Italian - IT (393 KB)
- Korean - KR (393 KB)
- Portuguese - PT (393 KB)
-
Instruction de manipulation (2659 KB)
Références
[1]. Blanco FF, et al. Impact of HuR inhibition by the small molecule MS-444 on colorectal cancer cell tumorigenesis. Oncotarget. 2016;7(45):74043-74058. [Content Brief]
[2]. Lang M, et al. HuR Small-Molecule Inhibitor Elicits Differential Effects in Adenomatosis Polyposis and Colorectal Carcinogenesis. Cancer Res. 2017;77(9):2424-2438. [Content Brief]
[3]. Wang J, et al. Anti-cancer effects of the HuR inhibitor, MS-444, in malignant glioma cells. Cancer Biol Ther. 2019;20(7):979-988. [Content Brief]


Complete Stock Solution Preparation Table
Please refer to the solubility information to select the appropriate solvent. Once prepared, please aliquot and store the solution to prevent product inactivation from repeated freeze-thaw cycles.
Storage method and period of stock solution: -80°C, 6 months; -20°C, 1 month (protect from light, stored under nitrogen). When stored at -80°C, please use it within 6 months. When stored at -20°C, please use it within 1 month.
| Optional Solvent | Concentration Solvent Mass | 1 mg | 5 mg | 10 mg | 25 mg |
|---|---|---|---|---|---|
| N-Methylpyrrolidone (NMP) / DMSO | 1 mM | 4.3437 mL | 21.7184 mL | 43.4367 mL | 108.5918 mL |
| 5 mM | 0.8687 mL | 4.3437 mL | 8.6873 mL | 21.7184 mL | |
| 10 mM | 0.4344 mL | 2.1718 mL | 4.3437 mL | 10.8592 mL | |
| 15 mM | 0.2896 mL | 1.4479 mL | 2.8958 mL | 7.2395 mL | |
| 20 mM | 0.2172 mL | 1.0859 mL | 2.1718 mL | 5.4296 mL | |
| 25 mM | 0.1737 mL | 0.8687 mL | 1.7375 mL | 4.3437 mL | |
| 30 mM | 0.1448 mL | 0.7239 mL | 1.4479 mL | 3.6197 mL | |
| 40 mM | 0.1086 mL | 0.5430 mL | 1.0859 mL | 2.7148 mL | |
| 50 mM | 0.0869 mL | 0.4344 mL | 0.8687 mL | 2.1718 mL | |
| 60 mM | 0.0724 mL | 0.3620 mL | 0.7239 mL | 1.8099 mL | |
| 80 mM | 0.0543 mL | 0.2715 mL | 0.5430 mL | 1.3574 mL | |
| DMSO | 100 mM | 0.0434 mL | 0.2172 mL | 0.4344 mL | 1.0859 mL |


MS-444 Related Classifications
HY-100685 Related Classifications
 Powered by Bioz