



GNE-7883
Based on 9 publication(s) in Google Scholar
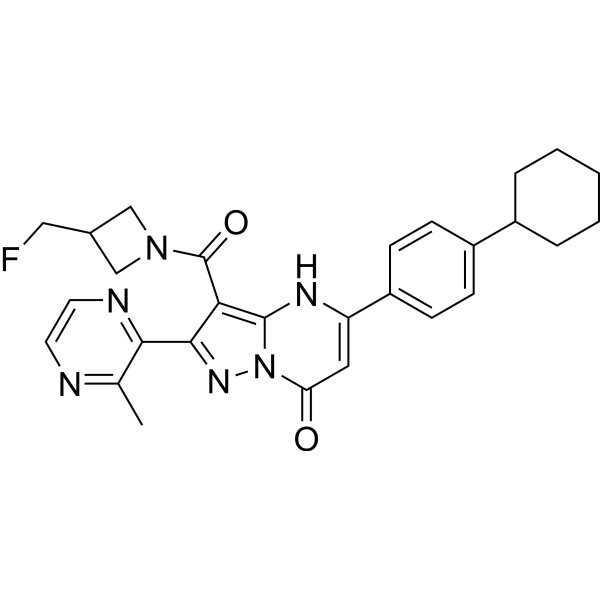
GNE-7883 is a pan-TEAD inhibitor that blocks the association of YAP/TAZ with TEAD. GNE-7883 effectively reduces chromatin accessibility at TEAD motifs, inhibits cell proliferation in multiple cell line models, and achieves strong anti-tumor efficacy in vivo. In addition, GNE-7883 effectively overcomes intrinsic and acquired resistance to KRAS (Kirsten rat sarcoma viral oncogene homolog) G12C inhibitors in multiple preclinical models by inhibiting YAP/TAZ activation.
Nos produits utilisent uniquement pour la recherche. Nous ne vendons pas aux patients.
- Pureté : 99.54%
- CAS No.: 2648450-42-2
- Formule: C28H29FN6O2
- Masse moléculaire:500.57
-
Stockage:Powder -20°C, 3 years , 4°C, 2 years ; In solvent -80°C, 6 months , -20°C, 1 month

To place orders, for customer services and technical support, please contact: MedChemExpress USA
Tel: 609-228-6898 E-mail: [email protected] [email protected]


-
 Activité biologique
-
Chemical Information
-
Solvant et solubilité
- Protocole
- Pureté et documentation
- Références
-
 Help & FAQs


-
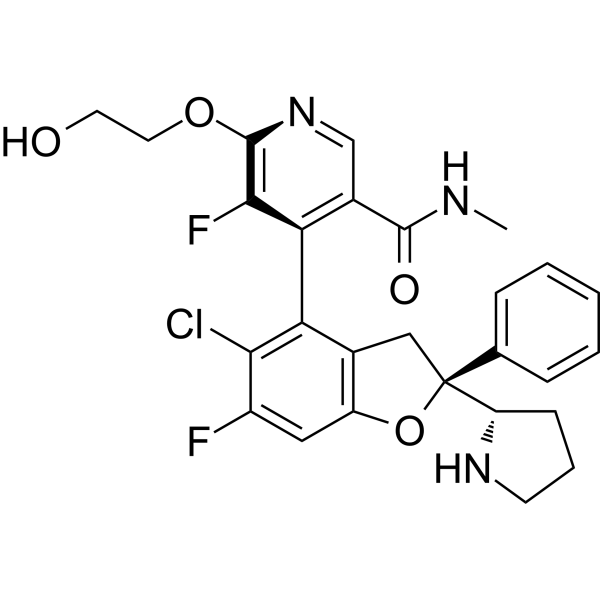
HY-153811
IAG933YAP-TEAD Inhibitor -
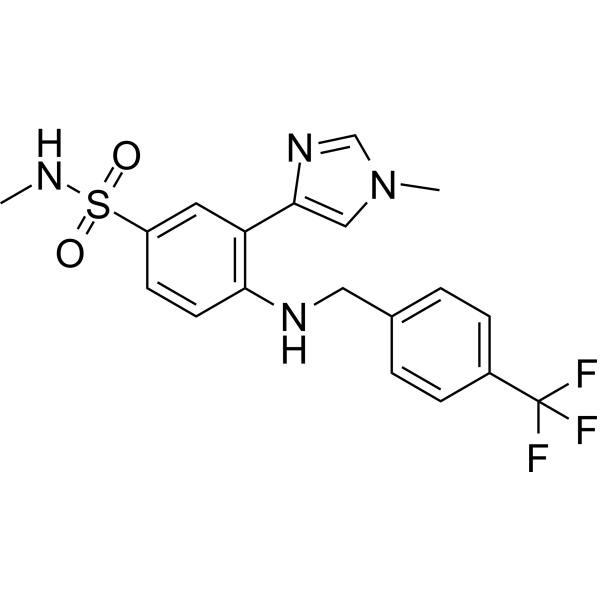
HY-153585
IK-930TEAD Inhibitor -
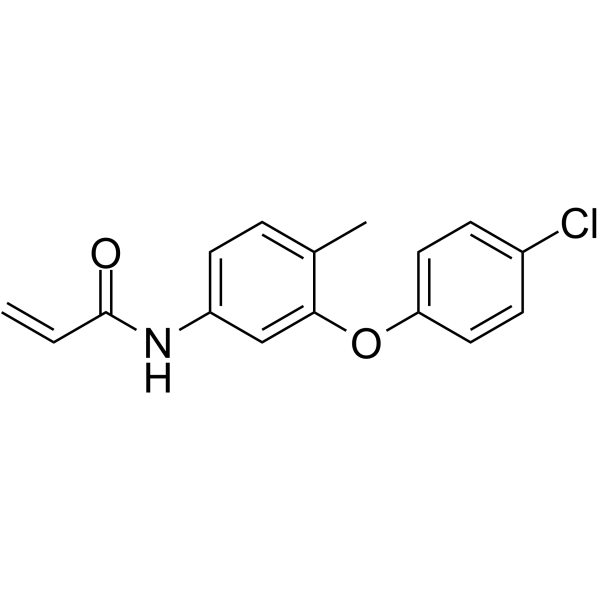
HY-138565
K-975YAP1/TAZ-TEAD Inhibitor -
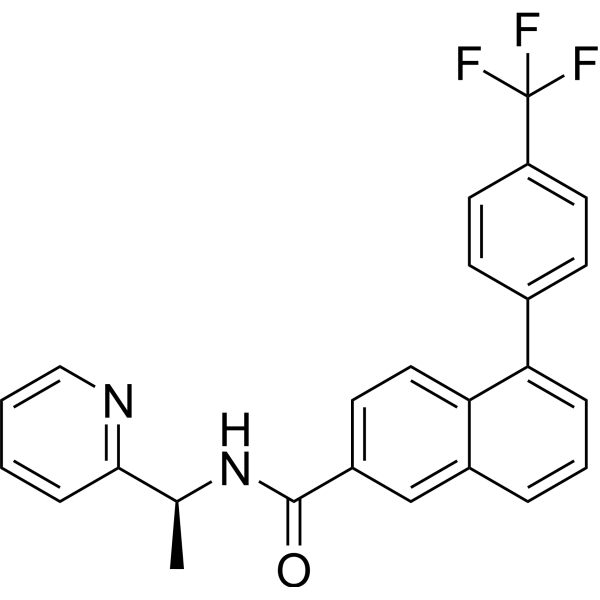
HY-134956
VT104YAP/TAZ Inhibitor -
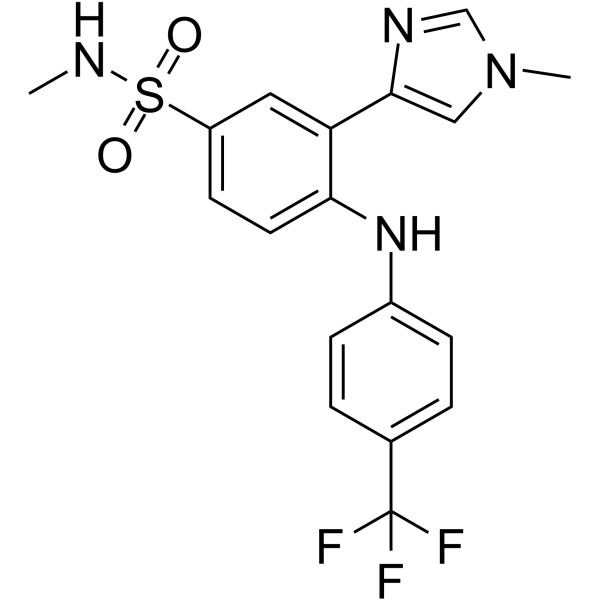
HY-134955
VT103TEAD1 Palmitoylation Inhibitor -
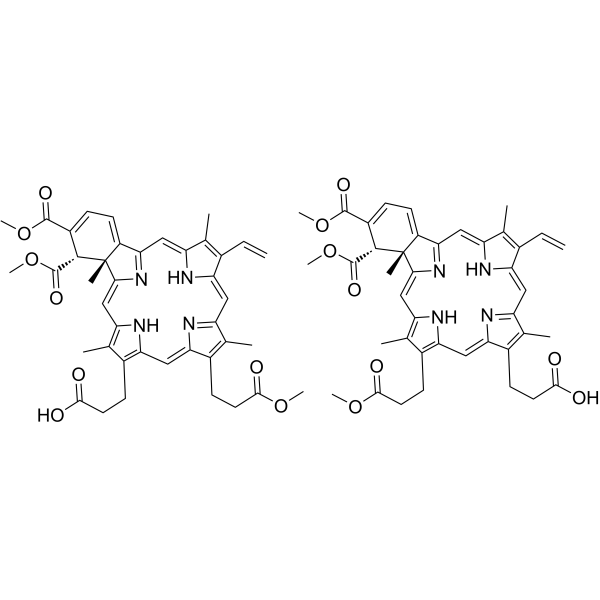
HY-B0146
VerteporfinYAP Inhibitor -
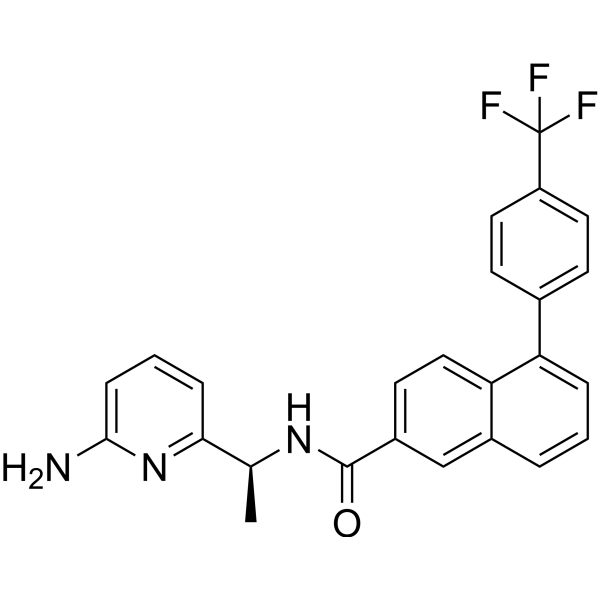
HY-134957
VT107pan-TEAD Auto-Palmitoylation Inhibitor -
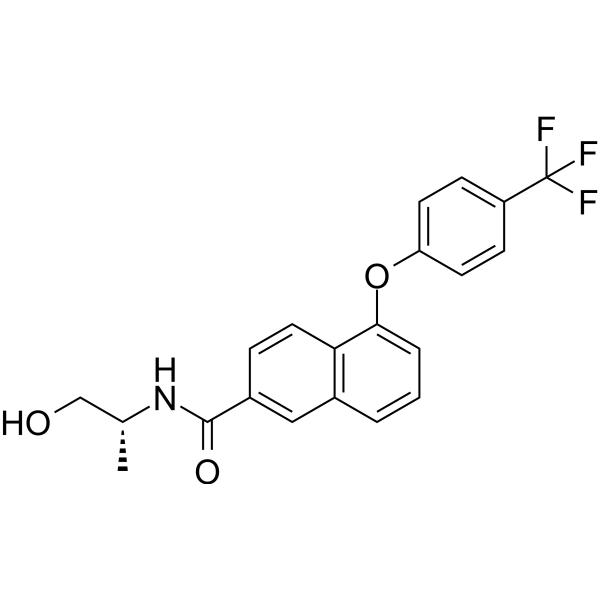
HY-400902
VT3989TEAD Inhibitor -
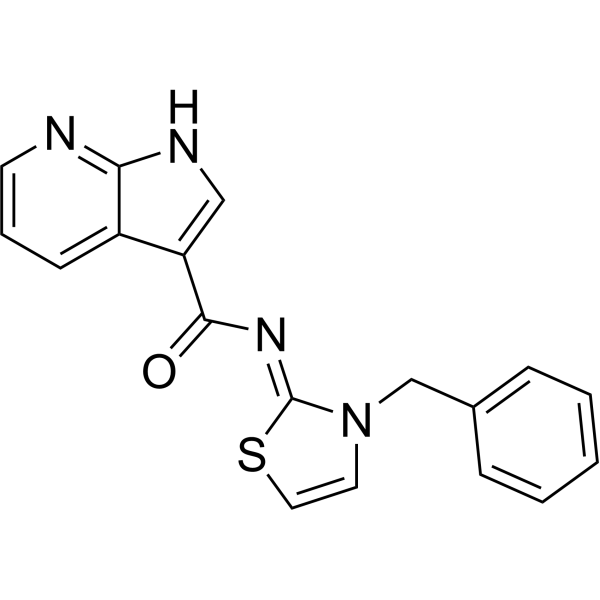
HY-138489
TRULILat1/2 kinases Inhibitor -
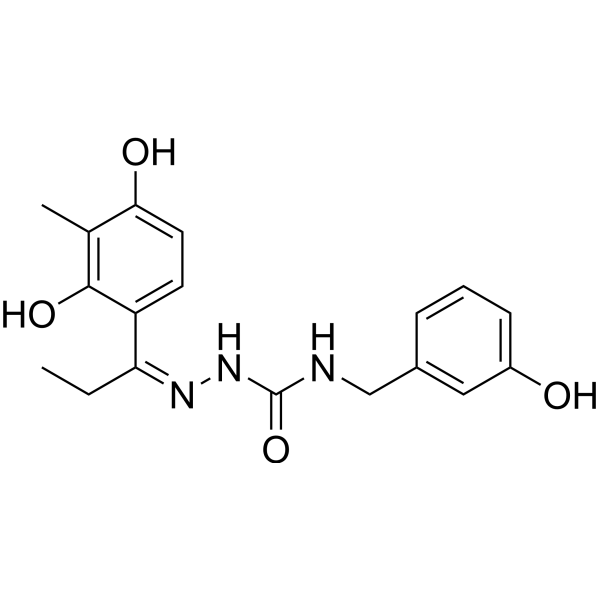
HY-147082
GA-017LATS1/2 Inhibitor -
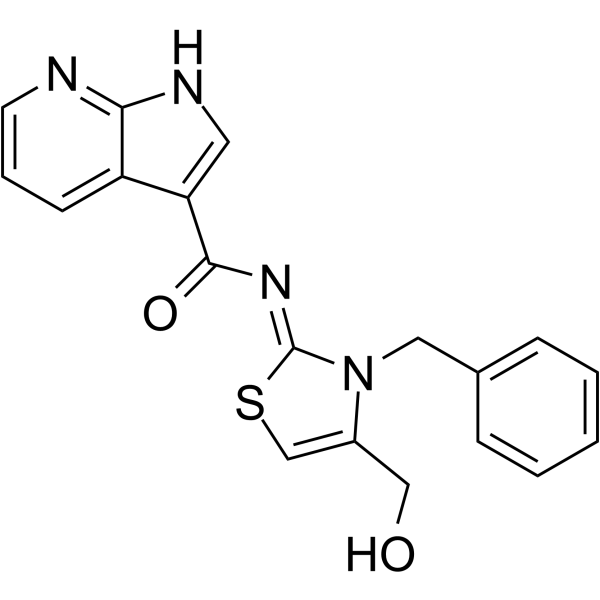
HY-150042
TDI-011536Lats Kinase Inhibitor -
HY-10999
TrametinibMEK Inhibitor
Publications Citing Use of MedChemExpress (MCE) GNE-7883
More- Nat Cell Biol. 2026 Aug;28(8):1728-1741. [Abstract]
- Mol Cell. 2025 Sep 18;85(18):3425-3442.e10. [Abstract]
- Cell Rep. 2026 May 26;45(5):117351. [Abstract]
- Differentiation. 2025 Jan-Feb:141:100835. [Abstract]
- Biomed Pharmacother. 2026 Sep:202:119803.
- University of Turku. 2026.
- bioRxiv. 2026 Mar 25.
- bioRxiv. 2025 Jun 27:2025.06.26.661609. [Abstract]
- bioRxiv. 2025 Mar 15:2025.03.13.643008. [Abstract]
 Customer Validation & Images

-
Cell Imaging/Staining
-
RT-PCR
-
Cell Proliferation/Viability Assay
Voir tous les produits spécifiques à Isoform YAP
More

Activité biologique
Description
IC50 & Target
|
YAP/TAZ-TEAD |
Cellular Effect
|
Cell Line

|
Type | Value | Description | References |
|---|---|---|---|---|
| NCI-H226 | IC50 |
0.082 μM
Compound: GNE-7883
|
Cytotoxicity against human NCI-H226 cells assessed as cell viability at 10 uM measured for 7 days by celltiter-glo assay
Cytotoxicity against human NCI-H226 cells assessed as cell viability at 10 uM measured for 7 days by celltiter-glo assay
|
[PMID: 35763499] |
In Vitro
GNE-7883 exhibits strong dose-dependent antiproliferative effects in both OVCAR-8 and NCI-H226 cells, with EC50 values of 115 nM and 333 nM, respectively[3].
MedChemExpress (MCE) has not independently confirmed the accuracy of these methods. They are for reference only.
In Vivo
MedChemExpress (MCE) has not independently confirmed the accuracy of these methods. They are for reference only.
-
Animal Model:Mesothelioma NCIH226 xenograft mouse model[3]
-
Dosage:250 mg/kg
-
Administration:Subcutaneous injection (s.c.); Once a day for 4 days
-
Result:Had a strong inhibitory effect on tumor growth in vivo, with an inhibition rate of 102%.
- Research Protocol for Epigenomic Data Analysis
- BrdU Incorporation Assay
- Somatic Cell Culture
- CFSE Dye Dilution Proliferation Assay
- Dye-dilution cell tracking and proliferation staining
- CCK-8/WST-8 Cell Proliferation Assay
- Protocol for Cell Cycle
- Cell Counting-Based Growth Curve Assay
- Colony Formation (Clonogenic) Assay
- Cell Viability Determination by MTT Colorimetric Assay
- EdU Incorporation Assay (Click Chemistry-Based DNA Synthesis Measurement)
- Ki-67 Immunostaining Proliferation Assay
- PCNA Immunodetection Proliferation Assay
- Protocol for Cell Counting and Cell Density Analysis
- MTT Cell Proliferation Assay


Chemical Information
-
CAS No. 2648450-42-2
-
Appearance Solid
-
Masse moléculaire 500.57
-
Formule C28H29FN6O2
-
Color White to light yellow
-
SMILES
O=C(C=C(C1=CC=C(C2CCCCC2)C=C1)N3)N4C3=C(C(N5CC(CF)C5)=O)C(C6=NC=CN=C6C)=N4
-
Livraison
Room temperature in continental US; may vary elsewhere.
-
Stockage
Powder -20°C 3 years 4°C 2 years In solvent -80°C 6 months -20°C 1 month


Publications (9)
-
Journal Impact Factor
-
Most Recent
-
Nat Cell Biol
Cancer stem cells are hyper-responsive sensors of the tumour microenvironment and regulate metastasis dynamics through YAP/TAZ. [Abstract]2026 Aug;28(8):1728-1741. PMID: 42509263 -
Mol Cell
2025 Sep 18;85(18):3425-3442.e10. PMID: 40914169 -
Cell Rep
A regulatory circuitry driving a noradrenergic to mesenchymal transition highlights YAP/TAZ as critical players in neuroblastoma plasticity. [Abstract]2026 May 26;45(5):117351. PMID: 42149714 -
Differentiation
Regulation of trophectoderm morphogenesis by small GTPase RHOA through HIPPO signaling-dependent and -independent mechanisms in mouse preimplantation development. [Abstract]2025 Jan-Feb:141:100835. PMID: 39874642
GNE-7883 purchased from MedChemExpress. Usage Cited in: Differentiation. 2025 Jan-Feb:141:100835. [Abstract]
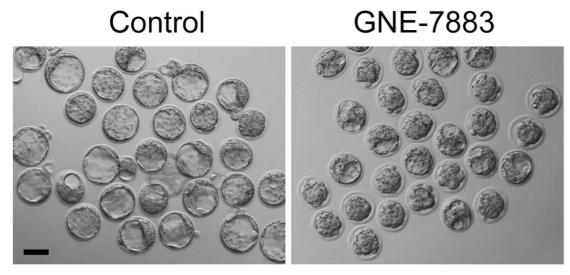
Bright-field images of E3.5 embryos treated with vehicle only (Control) or with the pan-TEAD inhibitor GNE-7883 (40 μM) from E2.5.
GNE-7883 purchased from MedChemExpress. Usage Cited in: Differentiation. 2025 Jan-Feb:141:100835. [Abstract]
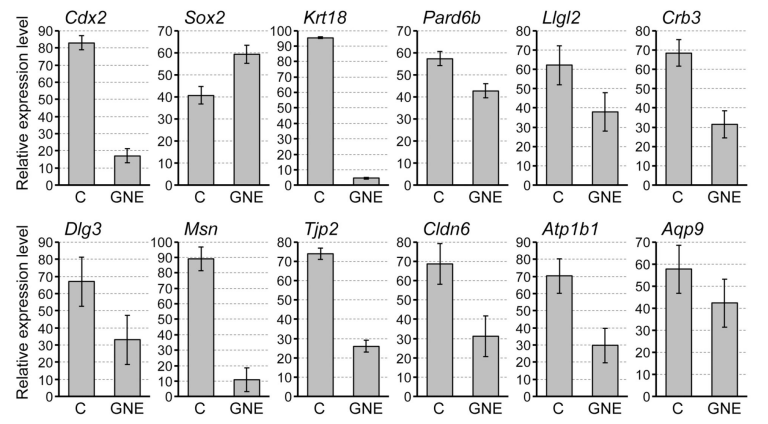
GNE-7883 (40 μM; E2.5 to E3.5) treatment down-regulated the TE marker genes (Cdx2, Krt18) and up-regulated the ICM marker gene (Sox2). Comparison of transcript levels between control (C) and GNE-7883 (GNE) treatment groups, as measured by quantitative RT-PCR.
-
-
-
-
bioRxiv
CRISPR-Based Gene Dependency Screens reveal Mechanism of BRAF Inhibitor Resistance in Anaplastic Thyroid Cancer. [Abstract]2025 Jun 27:2025.06.26.661609. PMID: 40667288 -
bioRxiv
Hyper-responsiveness of cancer stem cells to microenvironmental cues controls metastasis and therapy response through YAP/TAZ/TEAD. [Abstract]2025 Mar 15:2025.03.13.643008. PMID: 40568150
GNE-7883 purchased from MedChemExpress. Usage Cited in: bioRxiv. 2025 Mar 15:2025.03.13.643008. [Abstract]
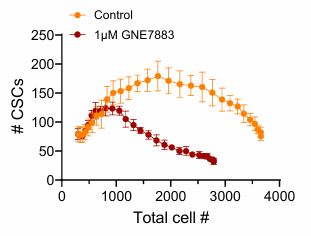
GNE-7883 (1 μM) effectively reduced cancer stem cells (CSCs) number.


Solvant et solubilité
In Vitro:
DMSO : 50 mg/mL (99.89 mM; Need ultrasonic; Hygroscopic DMSO has a significant impact on the solubility of product, please use newly opened DMSO)
Please refer to the solubility information to select the appropriate solvent. Once prepared, please aliquot and store the solution to prevent product inactivation from repeated freeze-thaw cycles.
Storage method and period of stock solution: -80°C, 6 months; -20°C, 1 month. When stored at -80°C, please use it within 6 months. When stored at -20°C, please use it within 1 month.
Please refer to the solubility information to select the appropriate solvent. Once prepared, please aliquot and store the solution to prevent product inactivation from repeated freeze-thaw cycles.
Storage method and period of stock solution: -80°C, 6 months; -20°C, 1 month. When stored at -80°C, please use it within 6 months. When stored at -20°C, please use it within 1 month.
Concentration (start) × Volume (start) = Concentration (final) × Volume (final)
In Vivo:
Select the appropriate dissolution method based on your experimental animal and administration route.
- For the following dissolution methods, please ensure to first prepare a clear stock solution using an In Vitro approach and then sequentially add co-solvents:
- To ensure reliable experimental results, the clarified stock solution can be appropriately stored based on storage conditions. As for the working solution for In Vivo experiments, it is recommended to prepare freshly and use it on the same day.
- The percentages shown for the solvents indicate their volumetric ratio in the final prepared solution. If precipitation or phase separation occurs during preparation, heat and/or sonication can be used to aid dissolution.
Add each solvent one by one: 10% DMSO 40% PEG300 5% Tween-80 45% Saline
Solubility: 2.5 mg/mL (4.99 mM); Clear solution; Need ultrasonic
This protocol yields a clear solution of 2.5 mg/mL.
Taking 1 mL working solution as an example, add 100 μL DMSO stock solution (25.0 mg/mL) to 400 μL PEG300, and mix evenly; then add 50 μL Tween-80 and mix evenly; then add 450 μL Saline to adjust the volume to 1 mL.
Preparation of Saline: Dissolve 0.9 g sodium chloride in ddH₂O and dilute to 100 mL to obtain a clear Saline solution.
Add each solvent one by one: 10% DMSO 90% (20% SBE-β-CD in Saline)
Solubility: 2.5 mg/mL (4.99 mM); Clear solution; Need ultrasonic
This protocol yields a clear solution of 2.5 mg/mL.
Taking 1 mL working solution as an example, add 100 μL DMSO stock solution (25.0 mg/mL) to 900 μL 20% SBE-β-CD in Saline, and mix evenly.
Preparation of 20% SBE-β-CD in Saline (4°C, storage for one week): 2 g SBE-β-CD powder is dissolved in 10 mL Saline, completely dissolve until clear.
In Vivo Dissolution Calculator
Please enter the basic information of animal experiments:
-
-
-
-
Recommended: Prepare an additional quantity of animals to account for potential losses during experiments.
Please enter your animal formula composition:
-
%DMSO +
Recommended: Keep the proportion of DMSO in working solution below 2% if your animal is weak.
-
%+
-
+%Tween-80 + +
-
%Saline +
The co-solvents required include: DMSO, . All of co-solvents are available by MedChemExpress (MCE). , Tween 80. All of co-solvents are available by MedChemExpress (MCE).
Working solution concentration: 0.22 mg/mL
Method for preparing stock solution: mg drug dissolved in μL DMSO. Stock solution concentration: mg/mL.
1. Take μL DMSO stock solution;
2. Add μL .
μL , mix evenly;
3. Then add μL Tween 80, mix evenly;
4. Then add μL
Please ensure that the stock solution in the first step is dissolved to a clear state, and add co-solvents in sequence. You can use ultrasonic heating (ultrasonic cleaner, recommended frequency 20-40 kHz), vortexing, etc. to assist dissolution.


Pureté et documentation
-
Fiche technique (276 KB)
-
SDS (254 KB)
- English - EN (254 KB)
- Français - FR (254 KB)
- Deutsch - DE (254 KB)
- Norwegian - NO (254 KB)
- Español - ES (254 KB)
- Swedish - SV (254 KB)
- Italian - IT (254 KB)
- Korean - KR (254 KB)
- Portuguese - PT (254 KB)
-
Instruction de manipulation (2659 KB)
Références
[1]. Hagenbeek TJ, et al. An allosteric pan-TEAD inhibitor blocks oncogenic YAP/TAZ signaling and overcomes KRAS G12C inhibitor resistance. Nat Cancer. 2023 Jun;4(6):812-828. [Content Brief]
[3]. Barry E R, et al. Recent therapeutic approaches to modulate the Hippo pathway in oncology and regenerative medicine[J]. Cells, 2021, 10(10): 2715. [Content Brief]


Complete Stock Solution Preparation Table
Please refer to the solubility information to select the appropriate solvent. Once prepared, please aliquot and store the solution to prevent product inactivation from repeated freeze-thaw cycles.
Storage method and period of stock solution: -80°C, 6 months; -20°C, 1 month. When stored at -80°C, please use it within 6 months. When stored at -20°C, please use it within 1 month.
| Optional Solvent | Concentration Solvent Mass | 1 mg | 5 mg | 10 mg | 25 mg |
|---|---|---|---|---|---|
| DMSO | 1 mM | 1.9977 mL | 9.9886 mL | 19.9772 mL | 49.9431 mL |
| 5 mM | 0.3995 mL | 1.9977 mL | 3.9954 mL | 9.9886 mL | |
| 10 mM | 0.1998 mL | 0.9989 mL | 1.9977 mL | 4.9943 mL | |
| 15 mM | 0.1332 mL | 0.6659 mL | 1.3318 mL | 3.3295 mL | |
| 20 mM | 0.0999 mL | 0.4994 mL | 0.9989 mL | 2.4972 mL | |
| 25 mM | 0.0799 mL | 0.3995 mL | 0.7991 mL | 1.9977 mL | |
| 30 mM | 0.0666 mL | 0.3330 mL | 0.6659 mL | 1.6648 mL | |
| 40 mM | 0.0499 mL | 0.2497 mL | 0.4994 mL | 1.2486 mL | |
| 50 mM | 0.0400 mL | 0.1998 mL | 0.3995 mL | 0.9989 mL | |
| 60 mM | 0.0333 mL | 0.1665 mL | 0.3330 mL | 0.8324 mL | |
| 80 mM | 0.0250 mL | 0.1249 mL | 0.2497 mL | 0.6243 mL |


GNE-7883 Related Classifications
HY-147214 Related Classifications
 Powered by Bioz