



Glycerol-13C

Based on 1 Customer Validation
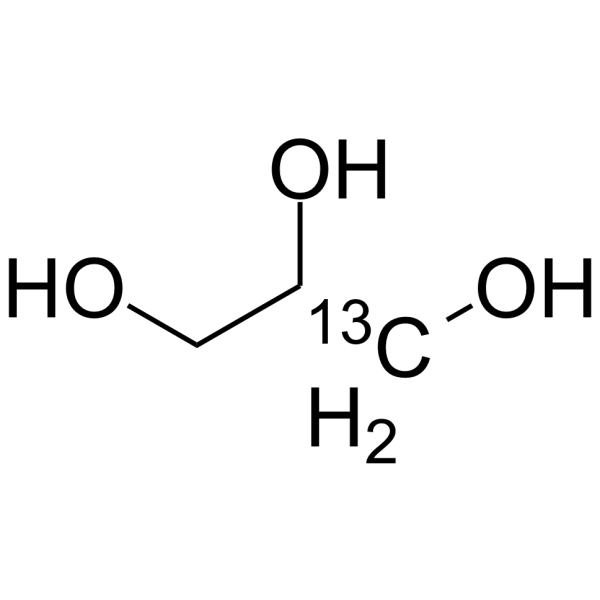
Glycerol-13C is the 13C labeled Glycerol. Glycerol is used in sample preparation and gel formation for polyacrylamide gel electrophoresis.
Nos produits utilisent uniquement pour la recherche. Nous ne vendons pas aux patients.
- Pureté : 99.29%
- CAS No.: 98292-00-3
- Formule: C213CH8O3
- Masse moléculaire:93.09
-
Stockage:
Solution, -20°C, 2 years

To place orders, for customer services and technical support, please contact: MedChemExpress USA
Tel: 609-228-6898 E-mail: [email protected] [email protected]


-
 Activité biologique
-
Chemical Information
- Protocole
- Pureté et documentation
- Références
-
 Help & FAQs


Voir tous les produits spécifiques à Isoform Endogenous Metabolite
More

Activité biologique
Description
In Vitro
Stable heavy isotopes of hydrogen, carbon, and other elements have been incorporated into drug molecules, largely as tracers for quantitation during the drug development process. Deuteration has gained attention because of its potential to affect the pharmacokinetic and metabolic profiles of drugs[1].
MedChemExpress (MCE) has not independently confirmed the accuracy of these methods. They are for reference only. Further protocols information, click here.
Application
1. This compound can be used as a tracer
2. This compound can be used as an internal standard for quantitative analysis by NMR, GC-MS, or LC-MS.


Chemical Information
-
CAS No. 98292-00-3
-
Unlabeled CAS 56-81-5
-
Appearance Liquid
-
Masse moléculaire 93.09
-
Formule C213CH8O3
-
Color Colorless to light yellow
-
SMILES
O[13CH2]C(O)CO
-
Synonyms
Trihydroxypropane-13C
-
Livraison
Room temperature in continental US; may vary elsewhere.
-
Stockage
Solution, -20°C, 2 years

Protocole
-
Polyacrylamide gel electrophoresis (PAGE) (<1 kb)
Gel electrophoresis is a method for separating biological macromolecules (such as nucleic acids or proteins) by forcing them through a gel matrix under an electric field.
-
Protocol for Protein Electrophoresis
Protein electrophoresis separates proteins in a polyacrylamide gel under an electric field; in SDS-PAGE, sodium dodecyl sulfate denatures proteins and gives them a broadly similar negative charge-to-mass ratio, so migration mainly reflects apparent molecular mass through the gel matrix. The readout is a stained protein band pattern: band position estimates apparent molecular mass using protein standards, band intensity reflects relative protein abundance within the linear range of staining/detection, and changes in band pattern can reflect protein expression, degradation, purification, or sample composition.


Pureté et documentation
-
Fiche technique (266 KB)
-
SDS (251 KB)
- English - EN (251 KB)
- Français - FR (251 KB)
- Deutsch - DE (251 KB)
- Norwegian - NO (251 KB)
- Español - ES (251 KB)
- Swedish - SV (251 KB)
- Italian - IT (251 KB)
- Korean - KR (251 KB)
- Portuguese - PT (251 KB)
-
Instruction de manipulation (2659 KB)
Références
[1]. Russak EM, et al. Impact of Deuterium Substitution on the Pharmacokinetics of Pharmaceuticals. Ann Pharmacother. 2019 Feb;53(2):211-216. [Content Brief]
[2]. Pennings S, et al. Effect of glycerol on the separation of nucleosomes and bent DNA in low ionic strengthpolyacrylamide gel electrophoresis. Nucleic Acids Res. 1992 Dec 25;20(24):6667-72.;Yazdani SS, et al. Anaerobic fermentation of glycerol: a path to ec [Content Brief]

Calculators
Concentration (start) × Volume (start) = Concentration (final) × Volume (final)


Glycerol-13C Related Classifications
HY-B1659S1 Related Classifications
 Powered by Bioz