



Antitumor agent-122
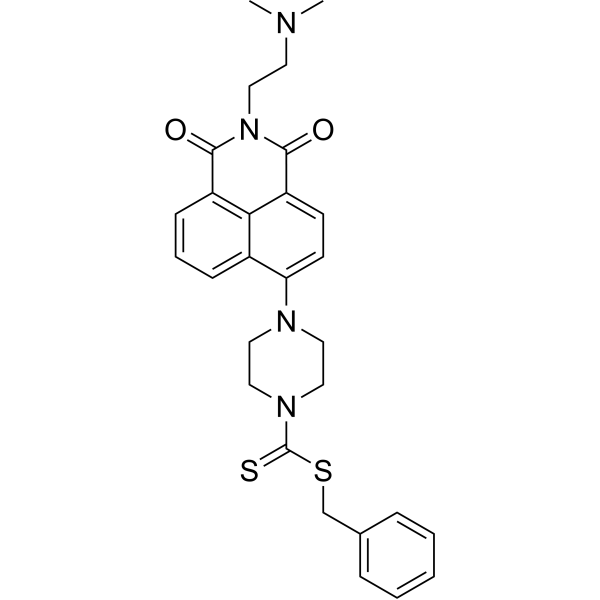
Antitumor agent-122 is a potent multi-target antitumor agent that exerts its effects through the induction of ferroptosis, autophagy, apoptosis, and cell cycle arrest. In the ferroptosis pathway, Antitumor agent-122 inhibits GPX4 expression and upregulates FACL4 expression, increasing intracellular lipid peroxidation and ferrous ion levels. In the autophagy pathway, Antitumor agent-122 induces autophagy by inhibiting the AKT/mTOR signaling pathway. In the apoptosis and cell cycle pathways, Antitumor agent-122 arrests cells at the G1/S phase and subsequently promots mitochondrial pathway-mediated apoptosis. Antitumor agent-122 can be used in the research of solid tumors including gastric, liver, ovarian, and bladder cancers.
For research use only. We do not sell to patients.
- CAS No.: 2378641-43-9
- Formula: C28H30N4O2S2
- Molecular Weight:518.69
-
Storage:
Please store the product under the recommended conditions in the Certificate of Analysis.

To place orders, for customer services and technical support, please contact: MedChemExpress USA
Tel: 609-228-6898 E-mail: [email protected] [email protected]


-
 Biological Activity
-
Chemical Information
- Protocols
- Purity & Documentation
- References
-
 Help & FAQs




Biological Activity
Description
IC50 & Target
[1]|
GPX4 |
ACSL4 |
Cellular Effect
|
Cell Line

|
Type | Value | Description | References |
|---|---|---|---|---|
| HepG2 | IC50 |
3.6 μM
Compound: 5j
|
Antiproliferative activity against human HepG2 cells incubated for 48 hrs by MTT assay
Antiproliferative activity against human HepG2 cells incubated for 48 hrs by MTT assay
|
[PMID: 37972528] |
| HK-2 | IC50 |
14.92 μM
Compound: 5j
|
Antiproliferative activity against human HK-2 cells incubated for 48 hrs by MTT assay
Antiproliferative activity against human HK-2 cells incubated for 48 hrs by MTT assay
|
[PMID: 37972528] |
| HUVEC | IC50 |
16.74 μM
Compound: 5j
|
Antiproliferative activity against HUVEC cells incubated for 48 hrs by MTT assay
Antiproliferative activity against HUVEC cells incubated for 48 hrs by MTT assay
|
[PMID: 37972528] |
| MGC-803 | IC50 |
5.23 μM
Compound: 5j
|
Antiproliferative activity against human MGC-803 cells incubated for 48 hrs by MTT assay
Antiproliferative activity against human MGC-803 cells incubated for 48 hrs by MTT assay
|
[PMID: 37972528] |
| SK-OV-3 | IC50 |
1.43 μM
Compound: 5j
|
Antiproliferative activity against human SK-OV-3 cells incubated for 48 hrs by MTT assay
Antiproliferative activity against human SK-OV-3 cells incubated for 48 hrs by MTT assay
|
[PMID: 37972528] |
| T-24 | IC50 |
3.03 μM
Compound: 5j
|
Antiproliferative activity against human T24 cells incubated for 48 hrs by MTT assay
Antiproliferative activity against human T24 cells incubated for 48 hrs by MTT assay
|
[PMID: 37972528] |
In Vitro
Antitumor agent-122 (compound 5j) inhibits the proliferation of MGC-803, HepG-2, SKOV-3, and T24 cells, with IC50 values of 5.23, 3.60, 1.43, and 3.03 μM, respectively[1].
Antitumor agent-122 exhibits low cytotoxicity in HK2 and HUVEC cells, with IC50 values of 14.92 and 16.74 μM, respectively[1].
Antitumor agent-122 inhibits the proliferation of cisplatin-resistant A549/DDP cells[1].
Antitumor agent-122 (5 μM; 24 h) induces ferroptosis in T24 cells by downregulating GPX4 expression, upregulating ACSL4 expression, and promoting the accumulation of lipid peroxides, ferrous ions, superoxide anions, and ROS[1].
Antitumor agent-122 (5 μM; 24 h and 48 h) induces ferroptosis-like mitochondrial morphological changes and autophagosome formation in T24 cells[1].
Antitumor agent-122 (2, 5, 8 μM; 24 h) induces autophagy in T24 cells by upregulating LC3B, downregulating P62, inhibiting AKT/mTOR-related signaling, and activating ERK signaling[1].
Antitumor agent-122 (1–5 μM; 7 days) reduces colony formation in T24 cells[1].
Antitumor agent-122 (1–10 μM; 0, 24, 48 h) inhibits T24 cell migration, and its anti-migratory effect is attenuated by the ERK inhibitor FR180204 (HY-12275)[1].
Antitumor agent-122 (2, 5, 8 μM; 24 h) promotes mitochondrial pathway-mediated apoptosis in T24 cells by upregulating the expression of cleaved-caspase 3, cleaved-PARP, Bax, Bak, and Bad[1].
Antitumor agent-122 (2, 5, and 8 μM; 24 h) upregulates p21 and downregulates MCM5 in T24 cells, inducing G1/S phase cell cycle arrest[1].
MedChemExpress (MCE) has not independently confirmed the accuracy of these methods. They are for reference only.
-
Cell Line:T24
-
Concentration:5 μM
-
Incubation Time:24 h
-
Result:Markedly decreased intracellular GPX4 levels and increased FACL4 expression.
-
Cell Line:T24
-
Concentration:2, 5, 8 μM
-
Incubation Time:24 h
-
Result:Upregulated LC3B and decreased P62, confirming autophagy induction. Decreased phosphorylated AKT1, AKT1 and mTOR expression, and induced ERK1/2 phosphorylation in a dose-dependent manner.
Upregulated cleaved-caspase 3, cleaved-PARP, Bax, Bak and Bad.
-
Cell Line:T24
-
Concentration:1, 2, 3, 4, 5 μM
-
Incubation Time:7 days
-
Result:Reduced colony formation at different concentrations.
-
Cell Line:T24
-
Concentration:1, 5, 7, 10 μM; FR180204 at 1, 2, 3 μM
-
Incubation Time:0, 24, 48 h
-
Result:Inhibited T24 cell migration in a time- and concentration-dependent manner. Co-incubation with ERK inhibitor FR180204 (HY-12275) reduced the antimigratory effect.
-
Cell Line:T24
-
Concentration:2, 5, 8 μM
-
Incubation Time:24 h
-
Result:Induced G1/S cell cycle arrest in a concentration-dependent manner. The result was consistent with omics analysis and indicated cell cycle blockade after treatment.
Upregulated p21 and downregulated MCM5.
In Vivo
Antitumor agent-122 (5, 15 mg/kg; intraperitoneal injection; once every two days; for 21 days) has antitumor activity with limited toxicity in HepG-2 xenograft nude mouse model[1].
Antitumor agent-122 (5, 15 mg/kg; i.p.; once every two days; for 21 days) exhibits antitumor activity in SKOV-3 xenograft nude mouse model[1].
MedChemExpress (MCE) has not independently confirmed the accuracy of these methods. They are for reference only.
-
Animal Model:T24 xenograft nude mouse model[1]
-
Dosage:5, 15 mg/kg
-
Administration:Intraperitoneal injection (i.p.); once every two days; for 21 days
-
Result:Suppressed T24 xenograft tumor growth. At 15 mg/kg, achieved a tumor inhibition ratio (TIR) of 56.3%, exceeding the effective antitumor threshold of 40%.
Showed lower antitumor activity in the low-dose group than in the high-dose group, indicating a dose-dependent effect.
Did not cause obvious severe body weight loss during treatment, suggesting acceptable tolerability.
-
Animal Model:HepG-2 xenograft nude mouse model[1]
-
Dosage:5, 15 mg/kg
-
Administration:Intraperitoneal injection (i.p.); once every two days; for 21 days
-
Result:Suppressed HepG-2 xenograft tumor growth. At 15 mg/kg, achieved a TIR of 50.0%, indicating effective in vivo antitumor activity.
Showed lower antitumor activity in the low-dose group than in the high-dose group.
Reduced tumor volume and tumor weight compared with vehicle group.
Showed less tissue toxicity than amonafide in heart, liver, spleen and lung pathological sections.
-
Animal Model:SKOV-3 xenograft nude mouse model[1]
-
Dosage:5, 15 mg/kg
-
Administration:Intraperitoneal injection (i.p.); once every two days; for 21 days
-
Result:Exhibited antitumor activity in SKOV-3 xenograft model.
Showed significantly less toxicity than amonafide in heart, liver, spleen and lung pathological sections, with the lowest comprehensive toxicity among all tested compounds, and was thus selected for further mechanistic investigation.
- RNA extraction experimental
- Annexin V plus membrane-impermeant dye apoptosis staining
- BrdU Incorporation Assay
- Protocol for Cell Cycle
- EdU Incorporation Assay (Click Chemistry-Based DNA Synthesis Measurement)
- Detection of Apoptosis
- TUNEL staining for apoptotic DNA fragmentation
- Flow cytometric DNA-content cell-cycle staining
- Autophagy
- Apoptosis Solutions
- Ferroptosis Solutions
- Lysosome and acidic-vesicle live-cell staining
- Macroautophagy Solutions


Chemical Information
-
CAS No. 2378641-43-9
-
Molecular Weight 518.69
-
Formula C28H30N4O2S2
-
SMILES
S=C(N1CCN(C2=CC=C(C3=C4C=CC=C32)C(N(CCN(C)C)C4=O)=O)CC1)SCC5=CC=CC=C5
-
Shipping
Room temperature in continental US; may vary elsewhere.
-
Storage
Please store the product under the recommended conditions in the Certificate of Analysis.


Purity & Documentation
References

Calculators
Concentration (start) × Volume (start) = Concentration (final) × Volume (final)


Antitumor agent-122 Related Classifications
HY-149717 Related Classifications
 Powered by Bioz
Keywords
- Antitumor agent-122
- 2378641-43-9
- Antitumor agent122
- Antitumor agent 122
- Ferroptosis
- Autophagy
- Apoptosis
- Glutathione Peroxidase
- Akt
- mTOR
- ERK
- ACSL Family
- multi-target antitumor drug
- HepG-2
- SKOV-3
- MGC -803
- T24
- A549/DDP
- T24 xenograft
- HepG-2 xenograft
- SKOV-3 xenograft
- gastric cancer
- hepatocellular carcinoma
- ovarian cancer
- bladder cancer
- Inhibitor
- inhibitor
- inhibit