



HDAC-IN-56
Based on 1 publication(s) in Google Scholar
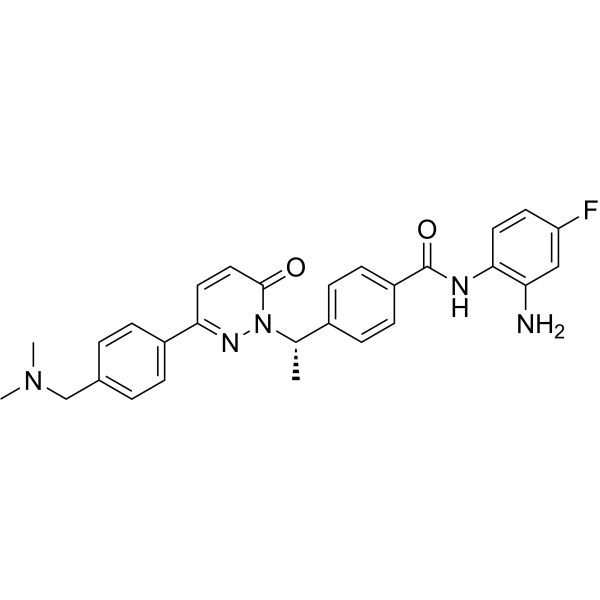
HDAC-IN-56 ((S)-17b) is an orally active class I histone deacetylase (HDAC) inhibitor with IC50 values of 56.0 ± 6.0, 90.0 ± 5.9, 422.2 ± 105.1, >10000 nM for HDAC1, HDAC2, HDAC3, and HDAC4-11, respectively. HDAC-IN-56 has potent inhibitory activity while strongly increasing intracellular levels of acetylhistone H3 and P21 and effectively inducing G1 cell cycle arrest and apoptosis.HDAC-IN-56 has antitumor activity .
Nur für Forschungszwecke. Wir verkaufen nicht an Patienten.
- CAS. Nr.: 2814571-89-4
- Formel: C28H28FN5O2
- Molecular Weight:485.55
-
Speicherung:
Please store the product under the recommended conditions in the Certificate of Analysis.

To place orders, for customer services and technical support, please contact: MedChemExpress USA
Tel: 609-228-6898 E-mail: [email protected] [email protected]


-
 Biologische Aktivität
-
Chemical Information
- Protokoll
- Reinheit & Dokumentation
- Verweise
-
 Help & FAQs


Publications Citing Use of MedChemExpress (MCE) HDAC-IN-56
More

Biologische Aktivität
Beschreibung
IC50 & Target
|
HDAC1 56.0 nM (IC50) |
HDAC2 90.0 nM (IC50) |
HDAC3 422.2 nM (IC50) |
Cellular Effect
|
Cell Line

|
Type | Value | Description | References |
|---|---|---|---|---|
| SKM-1 | IC50 |
139 nM
Compound: (S)-17b
|
Cytotoxicity against human SKM-1 cells assessed as viable cells incubated for 72 hrs by CCK8 assay
Cytotoxicity against human SKM-1 cells assessed as viable cells incubated for 72 hrs by CCK8 assay
|
[PMID: 37184921] |
In Vitro
HDAC-IN-56 shows potent and selective inhibition against Class I HDACs 1, 2, and 3, better than that of MS-275 (HY-12163)[1].
HDAC-IN-56 (0.1 μM, 2 h) is metabolized in human, monkey, dog, rat and mouse hepatocytes with significant species differences and was stable in five species of hepatocytes[1].
HDAC-IN-56 (0.01-1 μM, 72 h) effectively induces G1 cell cycle arrest and apoptosis[1].
HDAC-IN-56 (0.01-1 μM, 72 h) treatment increases the intracellular level of acetyl-histone H3 and p21 simultaneously better than that of Tucidinostat (HY-109015) or MS-275 (HY-12163), which implied its strong class I histone deacetylase inhibition[1].
HDAC-IN-56 has an IC50 of 139.0 ± 8.0 nM for SKM-1[1].
HDAC-IN-56 shows potent and selective inhibition against Class I HDACs 1, 2, and 3, better than that of MS-275 (HY-12163)[1].
HDAC-IN-56 (0.1 μM, 2 h) is metabolized in human, monkey, dog, rat and mouse hepatocytes with significant species differences and was stable in five species of hepatocytes[1].
HDAC-IN-56 (0.01-1 μM, 72 h) effectively induces G1 cell cycle arrest and apoptosis[1].
HDAC-IN-56 (0.01-1 μM, 72 h) treatment increases the intracellular level of acetyl-histone H3 and p21 simultaneously better than that of Tucidinostat (HY-109015) or MS-275 (HY-12163), which implied its strong class I histone deacetylase inhibition[1].
HDAC-IN-56 has an IC50 of 139.0 ± 8.0 nM for SKM-1[1].
HDAC-IN-56 (compuond (S)-17b) Metabolic Stability in Hepatocytes of Five Species (mass spectrum peak area)[1]
HDAC-IN-56 (compuond (S)-17b) Metabolic stability in hepatocytes of five species (mass spectrometry peak area)[1]
| no. | human | monkey | dog | rat | mouse |
| (S)-17b-120 min | 132390 (299) | 118399 (300) | 133963 (347) | 133098 (347) | 143377 (349) |
| (S)-17b-0 h | 129174 (293) | 107142 (267) | 150514 (395) | 136550 (350) | 156075 (392) |
MedChemExpress (MCE) has not independently confirmed the accuracy of these methods. They are for reference only.
-
Cell Line:SKM-1
-
Concentration:0.01, 0.1, 1 μM
-
Incubation Time:72 h
-
Result:Downregulated the expression of c-Myc and CDK4 at 0.1 μM, which is better than MS-275 (HY-12163) or Tucidinostat (HY-109015).
-
Cell Line:SKM-1
-
Concentration:0.01, 0.1, 1 μM
-
Incubation Time:72 h
-
Result:Triggered strong apoptosis as determined by Annexin V/PI staining, stronger than MS-275 (HY-12163) or Tucidinostat (HY-109015).
-
Cell Line:SKM-1
-
Concentration:0.01, 0.1, 1 μM
-
Incubation Time:72 h
-
Result:Increased the intracellular level of acetyl-histone H3 and p21 simultaneously better than that of Tucidinostat (HY-109015) or MS-275 (HY-12163).
In Vivo
HDAC-IN-56 (SD: 10, 20 mg/kg ; ICR: 20, 40 mg/kg, p.o.) represent a favorable pharmacokinetic profile with an oral bioavailability of 47.7% in ICR mice and 39.5% in SD rat, respectively[1].
HDAC-IN-56 (20-60 mg/kg, p.o.) inhibit the tumor growth of MC38 cells in nude mice as expected, when inoculate in immunocompetent C57BL/6 mice show more significant tumor growth inhibition at the same doses, which implie that the immune system may be engaged and somehow activated gain stronger antitumor effect[1].
In vivo pharmacokinetics of HDAC-IN-56 (compuond (S)-17b) in ICR mice and SD rat[1]
| ICR mice | SD rat | |||||||||||||||
| (S)-17b | dose (mg/kg) | CL (mL/min/kg) | Vss (L/kg) | T1/2(h) | AUC0-t(h x ng/mL) | Cmax (ng/mL) | Tmax (h) | F (%) | dose (mg/kg) | CL (mL/min/kg) | Vss (L/kg) | T1/2(h) | AUC0-t(h x ng/mL) | Cmax (ng/mL) | Tmax (h) | F (%) |
| iv | 20 | 64.4 ± 10.3 | 5.3 ± 1.2 | 3.6 ± 0.3 | 5269 ± 924 | 10 | 34.3 ± 8.6 | 4.1 ± 0.8 | 1.5 ± 0.2 | 4935 ± 1068 | ||||||
| po | 40 | 2.5 ± 0.3 | 5031 ± 441 | 1963 ± 335 | 0.83 ± 0.29 | 47.7 | 20 | 2.3 ± 0.6 | 3895 ± 141 | 1086 ± 16 | 2.00 | 39.5 |
MedChemExpress (MCE) has not independently confirmed the accuracy of these methods. They are for reference only.
-
Animal Model:Male SD rats or ICR mice[1]
-
Dosage:10, 20 mg/kg ; ICR: 20, 40 mg/kg
-
Administration:Male SD rats or ICR mice (n = 6) were fasted for 12 h before administration and remained fasting for 2 h. SD rats were received 10 and 20 mg/kg via intravenously injection (iv) and oral administration (po), respectively, and ICR mice were received 20 and 40 mg/kg via intravenously injection (iv) and oral administration (po), respectively.
-
Result:Epresented a favorable pharmacokinetic profile with an oral bioavailability of 47.7% in ICR mice and 39.5% in SD rat, respectively
-
Animal Model:SKM-1 or MC-38 cells xenograft model[1]
-
Dosage:20, 40, 60 mg/kg
-
Administration:Oral gavage (p.o.).
-
Result:Inhibited the tumor growth of MC38 cells in nude mice.
Showed more significant tumor growth inhibition at the same doses, which implie that the immune system may be engaged and somehow activated HDAC-IN-56 to gain stronger antitumor effect.


Chemical Information
-
CAS. Nr. 2814571-89-4
-
Molecular Weight 485.55
-
Formel C28H28FN5O2
-
SMILES
O=C1C=CC(C2=CC=C(C=C2)CN(C)C)=NN1[C@H](C3=CC=C(C=C3)C(NC4=C(N)C=C(C=C4)F)=O)C
-
Versand
Room temperature in continental US; may vary elsewhere.
-
Speicherung
Please store the product under the recommended conditions in the Certificate of Analysis.


Publications (1)
-
Journal Impact Factor
-
Most Recent


Reinheit & Dokumentation
Verweise

Calculators
Konzentration (Stammlösung) × Volumen (Stammlösung) = Konzentration (Ziellösung) × Volumen (Ziellösung)


HDAC-IN-56 Related Classifications
HY-154855 Related Classifications
 Powered by Bioz