



GIP, rat TFA

Based on 1 Customer Validation
GIP, rat TFA is a bioactive peptide derived from rats. GIP, rat TFA inhibits GIP-mediated postprandial insulin release as well as GIP-promoted glucose uptake in the upper small intestine. GIP, rat TFA can be used in research related to insulin resistance, glucose intolerance, and type 2 diabetes.
Nos produits utilisent uniquement pour la recherche. Nous ne vendons pas aux patients.
- Pureté : 99.81%
- Formule: C226H343N61O66S.xC2HF3O2
- Masse moléculaire:5002.58 (free base)
-
Stockage:
Sealed storage, away from moisture and light, under nitrogen.
Powder -80°C, 2 years , -20°C, 1 year* In solvent : -80°C, 6 months; -20°C, 1 month (sealed storage, away from moisture and light, under nitrogen)

To place orders, for customer services and technical support, please contact: MedChemExpress USA
Tel: 609-228-6898 E-mail: [email protected] [email protected]


-
 Activité biologique
-
Chemical Information
-
Solvant et solubilité
- Protocole
- Pureté et documentation
- Références
-
 Help & FAQs





Activité biologique
Description
In Vitro
MedChemExpress (MCE) has not independently confirmed the accuracy of these methods. They are for reference only.
In Vivo
MedChemExpress (MCE) has not independently confirmed the accuracy of these methods. They are for reference only.
-
Animal Model:Wistar (male, 250-350 g, fasted for 20 h prior to experimentation, anesthetized with sodium pentobarbital)[3]
-
Dosage:0.9 μg immunoreactive rat GIP·kg-1·h-1
-
Administration:i.v.; continuous infusion; 90 minutes
-
Result:Nearly doubled glucose-induced insulin release, with plasma insulin reaching 178 mU/l at 30 minutes and 171 mU/l at 90 minutes.
Trebled integrated 90-minute insulin response (13.67 mU/mL vs. 4.52 mU/mL for glucose alone).
Significantly reduced integrated 90-minute glucose response (0.28 mol/l vs. 0.53 mol/l for glucose alone).
Raised peak plasma immunoreactive GIP from a basal level of 239 pg/mL to 983 pg/mL at 30 minutes.


Chemical Information
-
Appearance Solid
-
Masse moléculaire 5002.58 (free base)
-
Formule C226H343N61O66S.xC2HF3O2
-
Color White to off-white
-
Sequence
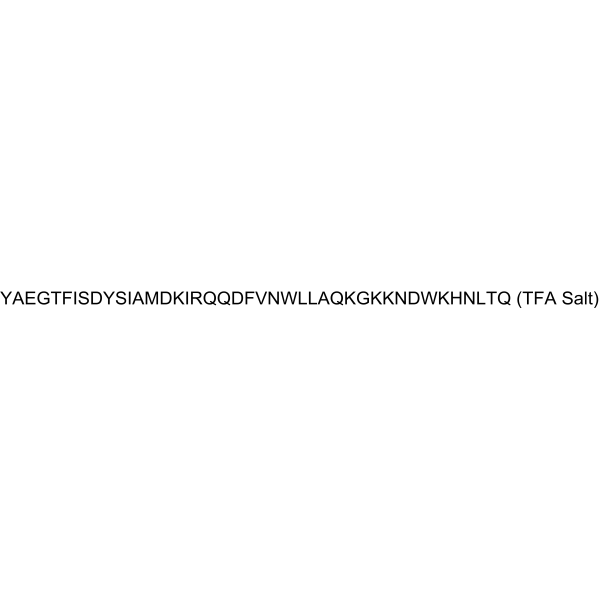
Tyr-Ala-Glu-Gly-Thr-Phe-Ile-Ser-Asp-Tyr-Ser-Ile-Ala-Met-Asp-Lys-Ile-Arg-Gln-Gln-Asp-Phe-Val-Asn-Trp-Leu-Leu-Ala-Gln-Lys-Gly-Lys-Lys-Asn-Asp-Trp-Lys-His-Asn-Leu-Thr-Gln
-
Sequence Shortening
YAEGTFISDYSIAMDKIRQQDFVNWLLAQKGKKNDWKHNLTQ
-
Livraison
Room temperature in continental US; may vary elsewhere.
-
Stockage
Sealed storage, away from moisture and light, under nitrogen
Powder -80°C 2 years -20°C 1 year * In solvent : -80°C, 6 months; -20°C, 1 month (sealed storage, away from moisture and light, under nitrogen)


Solvant et solubilité
In Vitro:
DMSO : 100 mg/mL (Need ultrasonic; Hygroscopic DMSO has a significant impact on the solubility of product, please use newly opened DMSO)


Pureté et documentation
-
Fiche technique (271 KB)
-
SDS (252 KB)
- English - EN (252 KB)
- Français - FR (252 KB)
- Deutsch - DE (252 KB)
- Norwegian - NO (252 KB)
- Español - ES (252 KB)
- Swedish - SV (252 KB)
- Italian - IT (252 KB)
- Korean - KR (252 KB)
- Portuguese - PT (252 KB)
-
Instruction de manipulation (2659 KB)
Références
[1]. Tseng CC, et al. Effect of GIP and GLP-1 antagonists on insulin release in the rat. The American journal of physiology. 1999 Jun;276(6):E1049-54. [Content Brief]
[2]. Wewer Albrechtsen NJ, et al. The intestinal distribution pattern of appetite- and glucose regulatory peptides in mice, rats and pigs. BMC research notes. 2016 Feb 02;9:60. [Content Brief]
[3]. Ebert R, et al. Preservation of incretin activity after removal of gastric inhibitory polypeptide (GIP) from rat gut extracts by immunoadsorption. Diabetologia. 1983 Jun;24(6):449-54. [Content Brief]
[4]. Gniuli D, et al. High-fat feeding stimulates endocrine, glucose-dependent insulinotropic polypeptide (GIP)-expressing cell hyperplasia in the duodenum of Wistar rats. Diabetologia. 2010 Oct;53(10):2233-40. [Content Brief]
[5]. Tseng CC, et al. Postprandial stimulation of insulin release by glucose-dependent insulinotropic polypeptide (GIP). Effect of a specific glucose-dependent insulinotropic polypeptide receptor antagonist in the rat. J Clin Invest. 1996 Dec 1;98(11):2440-5. [Content Brief]
[6]. Widenmaier SB, et al. A GIP receptor agonist exhibits beta-cell anti-apoptotic actions in rat models of diabetes resulting in improved beta-cell function and glycemic control. PloS one. 2010 Mar 09;5(3):e9590. [Content Brief]

Calculators
Concentration (start) × Volume (start) = Concentration (final) × Volume (final)


GIP, rat TFA Related Classifications
HY-P5390A Related Classifications
 Powered by Bioz