
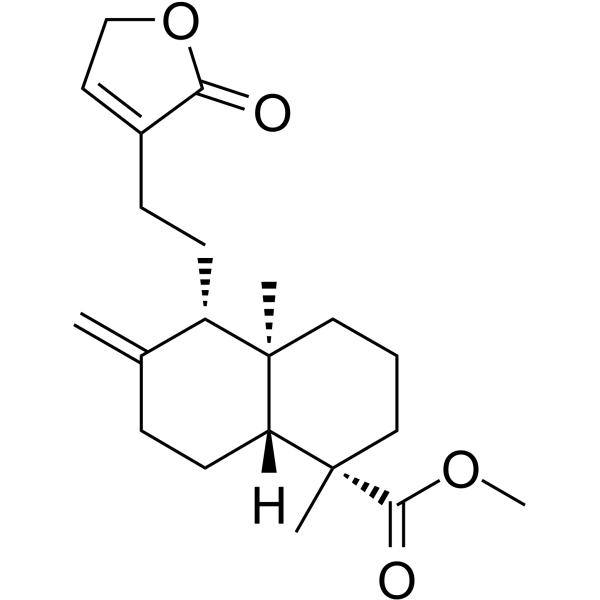
Pinusolide
Based on 1 Customer Validation
Pinusolide is an AMPK activator and PAF receptor antagonist. Pinusolide activates AMPK, phosphorylates ACC, enhances IRS-1 tyrosine phosphorylation, boosts glucose uptake, and modulates insulin signaling. Pinusolide inhibits caspase-3/7 activation, intracellular calcium elevation, reactive oxygen species overproduction, lipid peroxidation, and tumor cell proliferation. Pinusolide stabilizes superoxide dismutase activity, reduces apoptotic hallmarks, induces mitochondrial pathway apoptosis, and triggers DNA fragmentation. Pinusolide can be used for the research of type 2 diabetes, neurodegenerative diseases, acute lymphoblastic leukemia, acute myeloid leukemia, and Burkitt lymphoma.
商品は「研究用試薬」です。人や動物の医療用・臨床診断用・食品用の製品ではありません。
研究用途以外に使用した場合、当社は一切の責任を負いかねます。
- 純度 : 99.93%
- CAS 番号: 31685-80-0
- 分子式: C21H30O4
- 分子量:346.46
-
保管条件:
4°C, protect from light
* In solvent : -80°C, 6 months; -20°C, 1 month (protect from light)
生物活性
製品説明
IC50 & Target
[1]|
Caspase 3 |
Caspase-7 |
AMPK |
体外実験
Pinusolide (10-100 μM; 24 h) is non-cytotoxic to L6 myotubes at concentrations up to 100 μM[1].
Pinusolide (10-20 μM; 0.5-24 h) dose-dependently and time-dependently increases AMPK and ACC phosphorylation in L6 myotubes, with peak effects at 20 μM for 2 h and 10 μM at 2 h respectively[1].
Pinusolide (10-20 μM; 2 h) significantly increases glucose uptake in L6 myotubes, with 72% and 78% induction at 10 μM and 20 μM respectively after 2 h incubation[1].
Pinusolide (10 μM; 2 h) has its induced AMPK/ACC phosphorylation blocked and mediated glucose uptake reduced by Compound C (HY-13418A) in L6 myotubes, confirming AMPK dependence[1].
Pinusolide (10 μM; 2 h) requires LKB1 for induced AMPK activation and glucose uptake in L6 myotubes[1].
Pinusolide (10 μM; 2 h) improves high glucose-induced insulin resistance in L6 myotubes by restoring AMPK activation, reducing JNK phosphorylation, and reinstating insulin-stimulated IRS-1/Akt phosphorylation and glucose uptake[1].
Pinusolide (10 μM; 2 h) improves high glucose-induced insulin resistance in L6 myotubes via an AMPK-dependent mechanism, as AMPKα2 knockdown abolishes all beneficial effects[1].
Pinusolide (5.0 μM; 1 h pretreatment, 18 h STS exposure) protects primary mixed rat cortical cells from staurosporine-induced apoptotic morphological changes[2].
Pinusolide (1.0-5.0 μM; 1 h pretreatment, 18 h STS exposure) preserves superoxide dismutase activity reduced by staurosporine in primary rat cortical cells, with greater preservation at 5.0 μM[2].
Pinusolide (1.0-5.0 μM; 1 h pretreatment, 12 h STS exposure) reduces staurosporine-induced caspase-3/7 activation in primary rat cortical cells[2].
Pinusolide (5-100 μM; 24-48 h) inhibits the proliferation of Burkitt lymphoma BJAB cells in a concentration-dependent manner, with up to 44% inhibition after 24 h and up to 86% inhibition after 48 h of treatment[3].
Pinusolide (50-100 μM; 48 h) induces mitochondrial permeability transition in Burkitt lymphoma BJAB cells, with 86.36% of cells exhibiting low mitochondrial membrane potential after 48 h treatment with 100 μM pinusolide[3].
Pinusolide (50-100 μM; 72 h) induces apoptosis in Burkitt lymphoma BJAB cells, with 69.52% of cells showing DNA fragmentation after 72 h treatment with 100 μM pinusolide, accompanied by characteristic apoptotic morphological changes[3].
MedChemExpress (MCE) has not independently confirmed the accuracy of these methods. They are for reference only. Further protocols information, click here.
-
Cell Line:L6 myotubes
-
Concentration:10 μM; 20 μM
-
Incubation Time:0.5 h; 1 h; 2 h; 4 h; 8 h; 24 h
-
Result:Increased the phosphorylation of AMPK and ACC in a dose-dependent manner, with maximal increases observed at 20 μM after 2 h incubation.
Increased AMPK and ACC phosphorylation in a time-dependent manner, with peak phosphorylation observed at 2 h after treatment with 10 μM pinusolide, and elevated phosphorylation sustained up to 24 h.
-
Cell Line:compound C-pretreated L6 myotubes
-
Concentration:10 μM; 10 μM plus 10 μM Compound C
-
Incubation Time:2 h
-
Result:Induced phosphorylation of AMPK and ACC which was completely abrogated by compound C pretreatment.
Increased glucose uptake to 3.3 pmol/mg/min (1.7-fold induction, P < 0.05) versus untreated cells (1.9 pmol/mg/min), but compound C pretreatment reduced this uptake to 2.0 pmol/mg/min (40% of pinusolide-only levels, P < 0.05).
-
Cell Line:LKB1 siRNA-transfected L6 myotubes
-
Concentration:10 μM
-
Incubation Time:2 h
-
Result:Robustly increased AMPK and ACC phosphorylation and significantly increased glucose uptake in control siRNA-transfected cells.
Failed to increase AMPK and ACC phosphorylation and had no significant effect on glucose uptake in LKB1 siRNA-transfected cells.
-
Cell Line:high glucose-exposed L6 myotubes
-
Concentration:10 μM; 10 μM plus 30 mM glucose plus 100 nM
-
Incubation Time:2 h
-
Result:Increased AMPK and ACC phosphorylation in high glucose-exposed L6 myotubes.
Reduced high glucose-induced JNK phosphorylation.
Restored insulin-stimulated tyrosine phosphorylation of IRS-1 and Akt.
Improved insulin-stimulated glucose uptake.
-
Cell Line:Burkitt lymphoma BJAB cells
-
Concentration:5 μM; 10 μM; 20 μM; 30 μM; 50 μM; 100 μM
-
Incubation Time:24 h; 48 h
-
Result:Inhibited BJAB cell proliferation in a concentration-dependent manner.
Reduced cell count from 4.14 x10⁵/mL (control) to 2.24 x10⁵/mL at 50 μM and 2.46 x10⁵/mL at 100 μM after 24 h, reaching 44% maximum proliferation inhibition.
Reduced cell count from 13.35 x10⁵/mL (control) to 1.72 x10⁵/mL at 100 μM after 48 h, reaching up to 86% proliferation inhibition.
-
Cell Line:Burkitt lymphoma BJAB cells
-
Concentration:50 μM; 100 μM
-
Incubation Time:72 h
-
Result:Induced apoptosis in BJAB cells in a concentration-dependent manner.
Caused 0.06% of cells to be apoptotic at 50 μM after 72 h.
Caused 69.52% of cells to be apoptotic at 100 μM after 72 h.
Triggered characteristic apoptotic morphological changes including cell shrinking, fragmentation, and formation of apoptotic bodies containing chromatin bits in nearly all cells treated with 100 μM for 72 h.
化学情報
-
CAS 番号 31685-80-0
-
性状 Solid
-
分子量 346.46
-
分子式 C21H30O4
-
Color White to off-white
-
SMILES
C[C@@]1([C@H]2CCC3=CCOC3=O)[C@](CCC2=C)([H])[C@](C)(CCC1)C(OC)=O
-
Structure Classification
-
Initial Source
-
輸送条件
Room temperature in continental US; may vary elsewhere.
-
保管条件
4°C, protect from light
* In solvent : -80°C, 6 months; -20°C, 1 month (protect from light)
プロトコル
-
Somatic Cell Culture
A method of simulating the in vivo environment in vitro to maintain the cell growth, differentation and main functions.
-
Apoptosis
Apoptosis, also called programmed cell death, is generally characterized by distinct morphological characteristics.
-
TUNEL staining for apoptotic DNA fragmentation
TUNEL staining detects DNA strand breaks by using terminal deoxynucleotidyl transferase to add labeled nucleotides to exposed 3′-OH DNA termini, generating either microscopic staining in fixed cells or tissue sections, or fluorescence/cytometric signal in cell suspensions. TUNEL positivity reflects DNA fragmentation but should not be interpreted alone as definitive apoptosis, because TUNEL can also label necrotic, autolytic, mechanically damaged, or DNA-repair-associated DNA breaks.
-
Research Protocol for Endocrine Diseases
Endocrine diseases often arise from disrupted hormone production, hormone signaling, or target-tissue responsiveness; for diabetes-focused endocrine disease models, insulin signaling regulates glucose uptake, hepatic glucose output, lipid metabolism, and β-cell compensation. Type 2 diabetes develops through interacting defects in insulin resistance, β-cell dysfunction, adipose inflammation, hepatic glucose overproduction, altered incretin signaling, and ectopic lipid metabolism. A major unresolved question is whether endocrine dysfunction is driven primarily by target-tissue insulin resistance, intrinsic β-cell failure, immune/inflammatory stress, or combined multi-organ failure that differs by disease stage.
-
Apoptosis Solutions
Apoptosis is a regulated, generally non-lytic cell-death pathway that removes unwanted, damaged, infected, or abnormal cells through coordinated morphological changes, caspase activation, DNA fragmentation, and membrane remodeling. The intrinsic apoptosis pathway is controlled mainly by mitochondrial outer membrane permeabilization, BCL-2 family proteins, cytochrome c release, apoptosome formation, caspase-9 activation, and downstream executioner caspase-3/7 activation. The extrinsic apoptosis pathway is initiated by death receptors such as Fas, TNFR, and TRAIL receptors, which recruit adaptor proteins and activate caspase-8 before engaging executioner caspases or mitochondrial amplification through BID cleavage. Apoptosis is linked to many phenotypes, including cancer cell killing, tissue homeostasis, immune regulation, neurodegeneration, infection response, and treatment-induced cytotoxicity; unresolved questions include how apoptosis interacts with necroptosis, pyroptosis, ferroptos
-
Ferroptosis Solutions
Ferroptosis is an iron-dependent, non-apoptotic form of regulated cell death characterized by lethal lipid peroxidation and sensitivity to suppression by iron chelators or lipophilic radical-trapping antioxidants. The core pathway links cystine uptake through system Xc−, glutathione availability, GPX4-dependent detoxification of phospholipid hydroperoxides, iron-dependent oxidative reactions, and polyunsaturated-phospholipid metabolism into a cell-death program that is biochemically and morphologically distinct from apoptosis, necrosis, and autophagy. The ferroptosis pathway is experimentally linked to phenotype through chemical and genetic perturbation. Erastin induces ferroptosis by inhibiting cystine uptake through system Xc− and weakening antioxidant defenses, while GPX4 inhibition or depletion causes lipid peroxide accumulation and ferroptotic cancer-cell death. ACSL4 and oxidizable arachidonoyl- or adrenoyl-containing phosphatidylethanolamines shape ferroptosis sensitivity by con
-
MTT Cell Proliferation Assay
The MTT assay is a colorimetric endpoint assay for estimating viable cell number, cell growth, cytotoxicity, or cell activation in cultured mammalian cells. Living cells reduce the yellow tetrazolium salt MTT into purple/blue formazan, while dead cells do not generate the same signal; the resulting color can be quantified with a multiwell spectrophotometer. MTT reduction is commonly interpreted as a readout of metabolic activity that often correlates with viable cell number, but it should not be treated as a direct cell-counting method unless the assay is optimized for the cell type and experimental condition. Studies show that MTT reduction can involve mitochondrial and non-mitochondrial reducing systems, and formazan may accumulate in intracellular lipid droplets rather than simply marking mitochondria.
-
Western Blot
Western blotting (WB) is a commonly used experimental method in molecular biology, biochemistry, and immunogenetics for identifying and quantifying target proteins. It combines gel electrophoresis with immunoassay, enabling researchers to analyze protein expression, post-translational modifications, and molecular weight.
-
Annexin V plus membrane-impermeant dye apoptosis staining
Annexin V-based apoptosis assays rely on the detection of phosphatidylserine (PS) externalization from the inner leaflet of the plasma membrane to the outer leaflet, an early biochemical hallmark of apoptosis. Fluorescently labeled Annexin V binds PS in a calcium-dependent manner, enabling identification of early apoptotic cells by flow cytometry or fluorescence microscopy. When combined with a membrane-impermeant DNA-binding dye (e. g. , propidium iodide), this approach allows discrimination between viable (Annexin V−/dye−), early apoptotic (Annexin V+/dye−), and late apoptotic or necrotic (Annexin V+/dye+) cell populations by assessing membrane integrity and PS exposure.
-
ROS/oxidative-stress fluorescent staining
ROS/oxidative-stress fluorescent staining uses cell-permeant fluorogenic probes that become fluorescent after oxidation inside cells or tissues; commonly used examples include DCFH-DA/DCFDA for broad cellular oxidant detection, DHE for superoxide-related signal detection, MitoSOX for mitochondrial superoxide-related signal detection, and CellROX probes for oxidative-stress-associated fluorescence readouts. The assay detects probe oxidation rather than a single ROS species unless the probe and analysis method have been chemically validated for that species. DCFH-DA enters cells, is deacetylated by intracellular esterases to DCFH, and produces fluorescent DCF after oxidation, so the readout is used as an operational measure of total cellular oxidative stress rather than a species-specific ROS measurement. DHE and MitoSOX can report superoxide-related oxidation, but red fluorescence alone can include non-specific ethidium-like oxidation products; HPLC or optimized spectral approaches are
-
BrdU Incorporation Assay
Bromodeoxyuridine (BrdU) incorporation assay is based on the principle that BrdU, a thymidine analog, is incorporated into newly synthesized DNA during the S phase of the cell cycle, thereby serving as a marker of DNA replication and cellular proliferation. Incorporated BrdU can be detected using anti-BrdU antibodies following DNA denaturation, enabling visualization or quantification of proliferating cells through immunochemical detection methods such as immunofluorescence or immunohistochemistry.
-
CFSE Dye Dilution Proliferation Assay
The CFSE (carboxyfluorescein diacetate succinimidyl ester) dye dilution proliferation assay is based on the covalent labeling of intracellular proteins by a cell-permeant fluorescent dye that becomes fluorescent upon intracellular ester cleavage and then is stably retained within cells. As labeled cells divide, the dye is partitioned equally between daughter cells, resulting in a stepwise halving of fluorescence intensity that can be quantified by flow cytometry to determine the number of cell divisions undergone by each cell population. This fluorescence dilution approach enables quantitative tracking of lymphocyte proliferation at the single-cell level over multiple rounds of division. CFSE-based proliferation analysis has been widely applied to measure antigen-driven lymphocyte expansion in vitro, where discrete fluorescence peaks correspond to successive cell divisions and allow reconstruction of proliferative history within heterogeneous populations.
-
Dye-dilution cell tracking and proliferation staining
Dye-dilution cell tracking assays quantify cell proliferation by covalently labeling intracellular proteins with a stable fluorescent dye that is equally partitioned between daughter cells during mitosis, resulting in stepwise halving of fluorescence intensity with each cell division as measured by flow cytometry histograms. Carboxyfluorescein diacetate succinimidyl ester (CFSE) is a prototypical dye that diffuses into cells, is enzymatically converted into a fluorescent compound, and then covalently binds intracellular amine groups, producing long-lived fluorescence suitable for tracking multiple rounds of division in vitro and in vivo. Successive generations of dividing cells form discrete peaks of decreasing fluorescence intensity, enabling estimation of proliferation history, precursor frequency, and division index within heterogeneous populations. Alternative dyes such as CellTrace Violet (CTV) and far-red membrane dyes (e. g. , PKH26) follow the same dilution principle but differ
-
CCK-8/WST-8 Cell Proliferation Assay
The CCK-8/WST-8 assay is based on the reduction of the water-soluble tetrazolium salt WST-8 to a water-soluble formazan product by cellular dehydrogenases in metabolically active cells, where the generated formazan amount is proportional to the number of living cells and is quantified by measuring absorbance in the visible range, providing a colorimetric readout for cell viability and proliferation assessment. This class of tetrazolium-based assays improves upon earlier MTT-based systems by producing a water-soluble formazan, eliminating the need for organic solubilization steps and enabling direct spectrophotometric measurement in culture medium.
-
Protocol for Cell Cycle
Cell-cycle analysis by flow cytometry measures DNA content in single cells to estimate the fraction of cells in G0/G1, S, and G2/M phases. Propidium iodide intercalates into DNA, and after RNA removal with RNase, fluorescence intensity reflects cellular DNA content: 2N cells are assigned to G0/G1, cells between 2N and 4N to S phase, and 4N cells to G2/M. DNA-content analysis alone cannot reliably separate G0 from G1 or G2 from M. Ki-67 can distinguish quiescent G0 cells from cycling cells, EdU or BrdU incorporation marks active DNA synthesis in S phase, and phospho-histone H3 staining identifies mitotic cells within the 4N population.
-
Ca2+ Staining Technique
Ca2+ staining is an experimental technique that utilizes specific fluorescent probes (such as Fluo-4 AM, Fura-2, etc.) to qualitatively or quantitatively detect dynamic changes in intracellular Ca2+ concentrations; this is achieved by monitoring the changes in fluorescent signals generated when these probes bind to free intracellular calcium ions. The underlying principle relies primarily on the presence of chelating groups within the probe's molecular structure that possess high affinity for calcium ions.
-
Cell Counting-Based Growth Curve Assay
Cell counting-based growth curve assays quantify cell proliferation by directly measuring changes in viable cell number over time using manual or automated counting methods such as hemocytometer-based counting or instrument-assisted cell enumeration, enabling construction of growth curves that reflect population expansion dynamics in response to culture conditions. A widely used approach is trypan blue exclusion with hemocytometer counting, where membrane-compromised (non-viable) cells take up the dye, allowing discrimination between viable and non-viable cells while simultaneously enabling total cell number quantification. Repeated sampling across time points allows estimation of proliferation rate, growth phases, and comparative growth kinetics between experimental conditions.
-
Colony Formation (Clonogenic) Assay
The clonogenic (colony formation) assay measures the ability of a single cell to retain reproductive viability and form a macroscopic colony, typically defined as a cluster derived from one progenitor cell after a defined growth period. This assay is widely used to evaluate cell survival after exposure to ionizing radiation or cytotoxic treatments and is considered a standard method in radiation biology for generating dose-response relationships of reproductive cell death. Colony formation reflects long-term proliferative capacity rather than short-term metabolic activity, and survival is quantified by comparing treated versus untreated conditions based on colony number and derived survival fractions.
-
Research Protocol for Metabolic Diseases
AMP-activated protein kinase, AMPK, is a conserved cellular energy sensor that responds to reduced cellular energy status and coordinates metabolism by increasing ATP-generating catabolic pathways while suppressing ATP-consuming anabolic processes. In metabolic disease research, the AMPK pathway is experimentally relevant because it regulates hepatic lipid synthesis, fatty acid oxidation, glucose production, skeletal-muscle glucose disposal, mTORC1-linked biosynthesis, autophagy, mitochondrial homeostasis, and whole-body energy balance. The central pathway logic is that energy stress, metformin, exercise-like stimulation, or direct AMPK activators increase AMPKα Thr172 phosphorylation and downstream substrate phosphorylation, including ACC and RAPTOR. Phosphorylation of ACC suppresses lipogenesis and supports fatty acid oxidation, whereas phosphorylation of RAPTOR suppresses mTORC1 signaling and links cellular energy status to growth and protein synthesis control. The pathway is linked
-
Cell Viability Determination by MTT Colorimetric Assay
The following protocol uses the MTT colorimetric assay as a classic literature-established method for assessing cell viability/metabolic activity in cultured mammalian cells. MTT[3-(4,5-dimethylthiazol-2-yl)-2,5-diphenyltetrazolium bromide] is reduced by metabolically active cells to a colored formazan product; the amount of formazan is quantified spectrophotometrically and provides an indirect measure of metabolically active viable cells. Importantly, MTT reduction reflects cellular oxidoreductase/metabolic activity rather than an absolute direct count of living cells, so changes in cellular metabolism can alter the signal independently of cell number.
-
Kinase activity and phosphorylation assays
Kinase activity assays measure the ability of kinases to transfer phosphate groups from ATP to specific substrates, while phosphorylation assays detect the presence and levels of phosphorylated proteins. Common methods include radiolabeled ATP incorporation (e. g. ,), ADP release detection via bioluminescence (e. g. ,[3]), enzyme-linked immunosorbent assays (ELISA) for phospho-specific epitopes (e. g. ,[6]), and microtiter-based formats for high-throughput screening (e. g. ,[8]). The ADP-Glo assay quantifies kinase activity by measuring ADP produced during phosphorylation using a luciferase-based system. Radiometric assays involve autoradiography or scintillation counting after incorporation of 32P-labeled ATP into substrate proteins. ELISA-based approaches rely on phospho-specific antibodies to detect activated kinases in cell lysates or purified samples.
-
EdU Incorporation Assay (Click Chemistry-Based DNA Synthesis Measurement)
The EdU incorporation assay measures DNA synthesis by adding the thymidine analog 5-ethynyl-2′-deoxyuridine to cells or tissues, where it is incorporated into newly synthesized DNA during S phase. Incorporated EdU is detected by copper-catalyzed azide-alkyne cycloaddition, in which a fluorescent azide covalently reacts with the ethynyl group on EdU, allowing S-phase cells to be detected by fluorescence microscopy, flow cytometry, or high-content imaging. EdU detection does not require DNA denaturation or anti-BrdU antibody access, which preserves sample structure and improves compatibility with immunostaining and multiparameter cytometry compared with BrdU-based detection. EdU can be cytotoxic in a cell-type- and exposure-dependent manner, so pulse duration, concentration, and continuous-labeling designs should be validated for each cell type.
-
Ki-67 Immunostaining Proliferation Assay
Ki-67 immunostaining measures the growth fraction of a cell population by detecting Ki-67, a nuclear antigen present in proliferating cells and absent in quiescent G0 cells. The readout is the percentage of Ki-67-positive nuclei among total counted cells, commonly called the Ki-67 labeling index or proliferation index.
-
PCNA Immunodetection Proliferation Assay
PCNA immunodetection measures proliferative activity by detecting proliferating cell nuclear antigen, a nuclear protein associated with DNA polymerase δ function and DNA replication. The assay readout is the proportion of PCNA-positive nuclei among total counted cells, but PCNA labeling is not identical to BrdU labeling because PCNA can mark late G1/early S-associated replication competence and may persist beyond active DNA synthesis depending on fixation and extraction conditions.
-
Protocol for Cell Counting and Cell Density Analysis
Cell counting and cell-density analysis estimate the number of cells in a known volume or field area. Manual hemocytometer counting uses a chamber of defined geometry to convert counted cells into cells/mL, while automated counters and image-analysis workflows detect cell objects from optical, brightfield, fluorescence, impedance, or digital-image features. Trypan blue viability counting is based on dye exclusion: viable cells with intact membranes exclude dye, while non-viable cells with compromised membranes stain blue. The readout is total cell density, viable-cell density, dead-cell density, and percent viability. Cell density can also be estimated from microscopy images by counting objects per image area, from flow cytometry using calibrated volume or reference particles, or from in situ microscopy in bioreactors after calibration against reference methods such as hemocytometer or flow cytometry.
-
Calcium Spark Assay
Calcium sparks are localized, transient increases in intracellular calcium concentration ([Ca2+]i) that occur in cardiac myocytes and represent elementary events underlying excitation-contraction coupling. These events are generated by the coordinated opening of clusters of ryanodine receptors (RyRs) on the sarcoplasmic reticulum membrane, leading to a brief release of Ca2+ into the cytosol. The detection and analysis of calcium sparks provide insights into the mechanisms of calcium handling and signaling in cardiac cells. Imaging techniques using fluorescent calcium indicators such as Fluo-3 are employed to visualize these subcellular calcium transients with high spatial and temporal resolution. The protocol is based on established methodologies described in primary literature for both experimental measurement and automated analysis of calcium sparks.
-
Protocol for Kinase activity and phosphorylation assays
Kinase activity assays measure transfer of phosphate from ATP to a protein or peptide substrate, generating phosphorylated substrate, ADP, or incorporated radiolabeled phosphate as the readout; phosphorylation assays measure site-specific phosphorylation in cells or tissues as a proxy for kinase-pathway activation, inhibition, or substrate regulation. Phosphorylation can be detected by phospho-specific Western blot, immunoprecipitation kinase assay, phospho-immunofluorescence, phospho-flow cytometry, luminescent ADP detection, radiolabeled ATP incorporation, or reporter-based pathway assays, and these readouts can be applied to cancer cells, primary neurons, mouse tumors, organoids, inflammatory macrophages, ferroptosis studies, and mitophagy studies when the kinase target is biologically relevant.
純度とドキュメンテーション
-
データシート (282 KB)
-
SDS (394 KB)
- English - EN (394 KB)
- Français - FR (394 KB)
- Deutsch - DE (394 KB)
- Norwegian - NO (394 KB)
- Español - ES (394 KB)
- Swedish - SV (394 KB)
- Italian - IT (394 KB)
- Korean - KR (394 KB)
- Portuguese - PT (394 KB)
-
取扱説明書 (2659 KB)
参考文献
[1]. Hwang SL, et al. Pinusolide improves high glucose-induced insulin resistance via activation of AMP-activated protein kinase. Biochem Biophys Res Commun. 2013;437(3):374-379. [Content Brief]
[2]. Koo KA, et al. Pinusolide and 15-methoxypinusolidic acid attenuate the neurotoxic effect of staurosporine in primary cultures of rat cortical cells. Br J Pharmacol. 2007;150(1):65-71. [Content Brief]
[3]. Shults EE, et al. Gram-scale synthesis of pinusolide and evaluation of its antileukemic potential. Bioorg Med Chem Lett. 2006;16(16):4228-4232. [Content Brief]
Calculators
濃度 (開始) × 体積 (開始) = 濃度 (終了) × 体積 (終了)

