
BDS-I
BDS-I known as blood depressing substance, is a marine toxin which can be extracted from Anemonia sulcata. BDS-I is a specific inhibitor of Potassium Channel, targeting to Kv3.4. BDS-I inhibits Aβ1-42-induced enhancement of KV3.4 activity, caspase-3 activation, and abnormal nuclear morphology of NGF-differentiated PC-12 cells. BDS-I reverts the Aβ peptide-induced cell death.
For research use only. We do not sell to patients.
- CAS No.: 207621-38-3
- Formula: C210H297N57O56S6
- Molecular Weight:4708.34
-
Storage:
Please store the product under the recommended conditions in the Certificate of Analysis.
Biological Activity
Description
IC50 & Target
Kv3.4[1]
Chemical Information
-
CAS No. 207621-38-3
-
Molecular Weight 4708.34
-
Formula C210H297N57O56S6
-
Sequence
Ala-Ala-Pro-Cys-Phe-Cys-Ser-Gly-Lys-Pro-Gly-Arg-Gly-Asp-Leu-Trp-Ile-Leu-Arg-Gly-Thr-Cys-Pro-Gly-Gly-Tyr-Gly-Tyr-Thr-Ser-Asn-Cys-Tyr-Lys-Trp-Pro-Asn-Ile-Cys-Cys-Tyr-Pro-His (Disulfide bonds:Cys4-Cys39, Cys6-Cys32, Cys22-Cys40)
-
Sequence Shortening
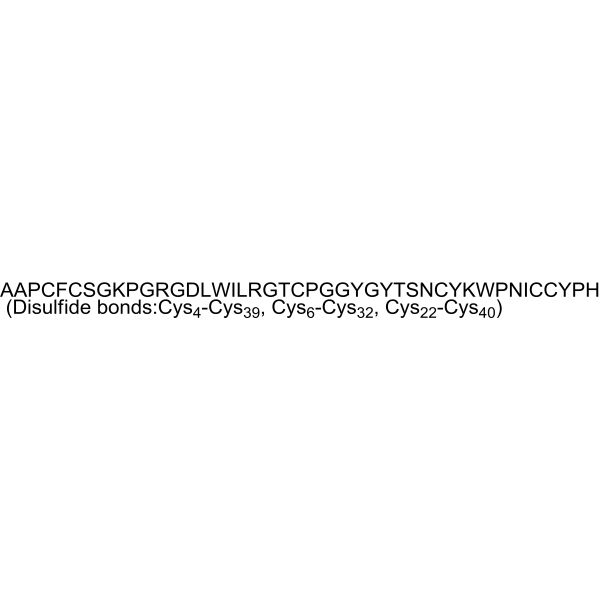
AAPCFCSGKPGRGDLWILRGTCPGGYGYTSNCYKWPNICCYPH (Disulfide bonds:Cys4-Cys39, Cys6-Cys32, Cys22-Cys40)
-
Shipping
Room temperature in continental US; may vary elsewhere.
-
Storage
Please store the product under the recommended conditions in the Certificate of Analysis.
Protocols
-
PC12 NGF-Induced Neuronal Differentiation Culture
PC12 cells are a rat adrenal pheochromocytoma clonal line that responds to NGF by stopping proliferation and extending branching neurite-like processes; after longer NGF exposure, cells develop long processes and neuronal-like ultrastructural and functional features. NGF-induced differentiation is read out mainly by neurite outgrowth, reduced proliferation, microtubule assembly, and neuronal differentiation-associated proteins such as MAPs, tau, GAP-43, and synapsin-1.
-
Cell Cytotoxicity Assay
Cytotoxicity assays are usually based on the assessment of cell membrane damage, which can also be indirectly detected by measuring cell viability. Detection methods include MTT assay, CKK-8 assay, LDH assay and ATP assay, etc.
-
Mammalian live/dead viability and cytotoxicity staining
Live/dead viability and cytotoxicity staining assays are based on the simultaneous detection of intracellular esterase activity in metabolically active (viable) cells and membrane integrity loss in non-viable cells. In commonly used dual-staining approaches, membrane-permeant fluorogenic substrates are converted by intracellular esterases into fluorescent products in live cells, while impermeant DNA-binding dyes selectively enter cells with compromised plasma membranes and label nucleic acids in dead or dying cells, enabling discrimination between viable and non-viable populations by fluorescence microscopy or flow cytometry.
-
Nuclear DNA counterstaining and nuclear morphology staining
Nuclear DNA counterstaining uses DNA-binding fluorescent dyes to visualize nuclei and chromatin so that nuclei can be located, counted, segmented, and evaluated for morphology; Hoechst 33342, DAPI, propidium iodide, and DRAQ5 are commonly reported nuclear stains, while live-cell DNA labeling is better supported for Hoechst dyes and DRAQ5 than for propidium iodide in intact viable cells. Nuclear morphology staining can detect apoptosis-associated nuclear changes, including chromatin condensation, nuclear shrinkage, nuclear fragmentation, reduced nuclear area/perimeter/axis length, and increased nuclear fluorescence intensity; these morphology readouts have been compared with apoptosis markers such as TUNEL and caspase-3 immunofluorescence.
-
Nuclear Morphometry and Analysis
Nuclear morphometry quantifies nuclear size, shape, staining intensity, and chromatin texture from microscopy images to convert visual nuclear morphology into reproducible numerical features. Common readouts include nuclear area, perimeter, Feret diameter, circularity, aspect ratio, mean gray value, fractal dimension, and chromatin texture features.
-
Apoptosis Solutions
Apoptosis is a regulated, generally non-lytic cell-death pathway that removes unwanted, damaged, infected, or abnormal cells through coordinated morphological changes, caspase activation, DNA fragmentation, and membrane remodeling. The intrinsic apoptosis pathway is controlled mainly by mitochondrial outer membrane permeabilization, BCL-2 family proteins, cytochrome c release, apoptosome formation, caspase-9 activation, and downstream executioner caspase-3/7 activation. The extrinsic apoptosis pathway is initiated by death receptors such as Fas, TNFR, and TRAIL receptors, which recruit adaptor proteins and activate caspase-8 before engaging executioner caspases or mitochondrial amplification through BID cleavage. Apoptosis is linked to many phenotypes, including cancer cell killing, tissue homeostasis, immune regulation, neurodegeneration, infection response, and treatment-induced cytotoxicity; unresolved questions include how apoptosis interacts with necroptosis, pyroptosis, ferroptos
-
PC12 NGF-induced neuronal-like differentiation
PC12 cells are a rat adrenal pheochromocytoma-derived clonal cell line that responds to nerve growth factor by stopping proliferation and extending neurites, producing a sympathetic neuron-like phenotype used to study neuronal differentiation and neurite outgrowth. NGF acts through TrkA-dependent signaling, and neurite outgrowth is associated with ERK/Akt signaling, microtubule organization, neuronal-marker expression, and increased electrophysiological neuronal features such as sodium-channel density. The main assay readout is morphological differentiation, usually measured as the percentage of neurite-bearing cells, neurite length, neurite number, or total neurite length per cell. Additional readouts include GAP-43, tyrosine hydroxylase, βIII-tubulin, neurofilament, synapsin I, synaptophysin, ERK phosphorylation, Akt phosphorylation, and sodium-channel current density.
-
Alzheimer’s Disease Modeling
Alzheimer’s Disease (AD) is a neurodegenerative disorder characterized by a progressive decline in cognitive functions and loss of specific types of neurons and synapses. Alzheimer's symptoms can be simulated in mice by injecting drugs (such as Aβ) or genetically modified.
Purity & Documentation
References
Calculators
Concentration (start) × Volume (start) = Concentration (final) × Volume (final)

