



Rosolic acid
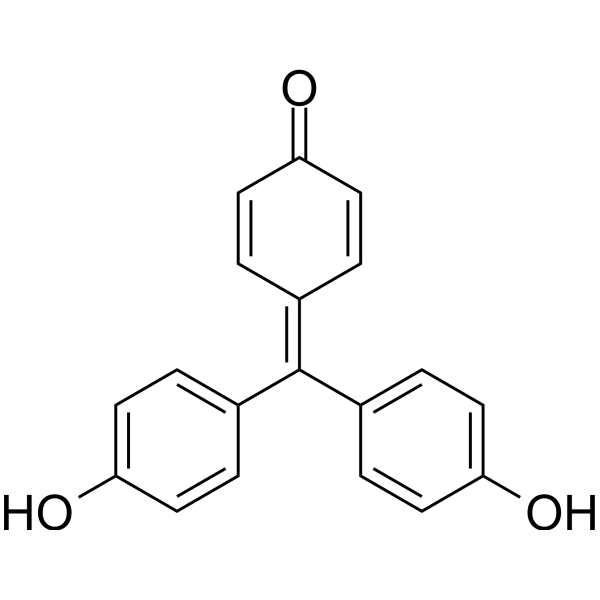
Rosolic acid is a Michael acceptor molecule isolated from the rhizomes of Plantago asiatica L. Rosolic acid inhibits Keap1, promotes Nrf2 nuclear translocation, and upregulates HO-1 and NQO-1. Rosolic acid reduces ER stress markers PERK, ATF-6, GRP78, and CHOP, as well as oxidative stress, ROS production, inflammation, and apoptosis. Rosolic acid upregulates SOD, CAT, and GPx activities, induces angiogenesis and insulin secretion, and restores endothelial function and pancreatic beta cell protection under ER stress. Rosolic acid can be used in research on diabetes and endothelial dysfunction.
Para uso exclusivo en investigación. No vendemos a pacientes.
- No. CAS: 603-45-2
- Fòrmula: C19H14O3
- Peso molecular:290.31
-
Almacenamiento:
Please store the product under the recommended conditions in the Certificate of Analysis.

To place orders, for customer services and technical support, please contact: MedChemExpress USA
Tel: 609-228-6898 E-mail: [email protected] [email protected]


-
 Actividad biológica
-
Chemical Information
- Protocolo
- Pureza y Documentación
- Referencias
-
 Help & FAQs


-
HY-B0324A
Crystal VioletFluorochrome -
HY-W267364
Coumarin 343Fluorescent Probe -
HY-123630
Allura Red ACFood Colourant -

HY-DY2001
Crystal Violet (solution)Fluorochrome -
HY-W110794
Crystal violet, IND (0.0-2.0)Biochemical Assay Reagent -
HY-112675
4-Octyl itaconateNrf2 Activator -
HY-D0958
Methylene blue hydratesGC Inhibitor -

HY-W110909
Thiazole Yellow G, for microscopyBiochemical Reagent -

HY-123630R
Allura Red AC (Standard)Food Colourant -
HY-D0252
m-Cresol purplepH Indicator Dye -
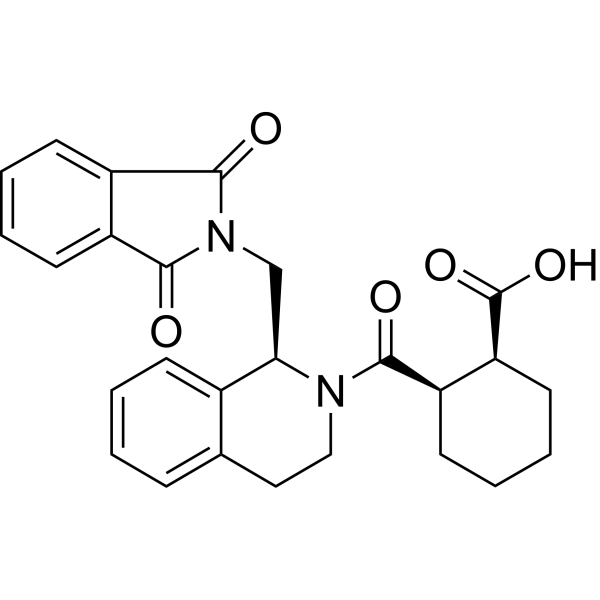
HY-110258
ML334NRF2 Activator -
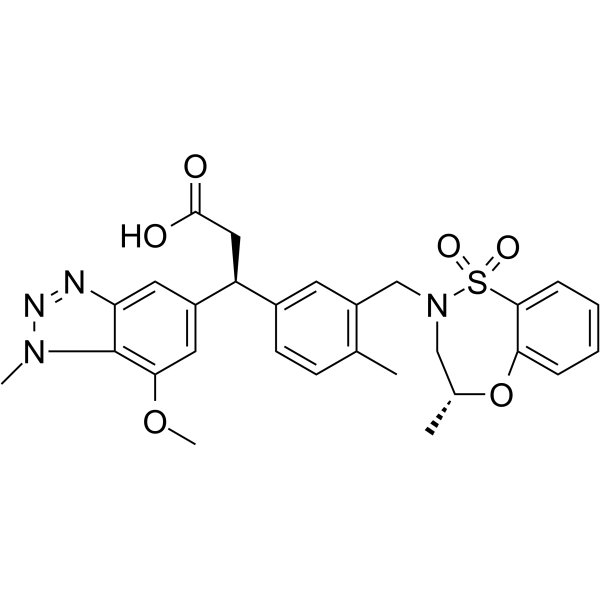
HY-101140
KI696KEAP1/NRF2 Protein-protein Interaction Inhibitor


Actividad biológica
Descripciòn
In Vitro
Rosolic acid (2.5-25 μM; 24 h) does not exhibit cytotoxicity in EA.hy926 cells at concentrations up to 25 μM[1].
Rosolic acid (15 μM; 24-48 h) is well tolerated by bovine aortic endothelial cells with no cytotoxicity up to 48 h[3].
Rosolic acid (2.5-25 μM; 24 h) protects EA.hy926 cells against Thapsigargin (HY-13433)-induced ER stress cytotoxicity at 5 and 10 μM[1].
Rosolic acid pretreatment (10 μM; 24 h) reduces Thapsigargin-induced ER stress markers GRP78 and CHOP in EA.hy926 cells in the co-culture setup[1].
Rosolic acid pretreatment (10 μM; 24 h) decreases GRP-78 and CHOP protein levels in EA.hy926 cells under Thapsigargin-induced ER stress in the co-culture setup[1].
Rosolic acid pretreatment (10 μM; 24 h) of EA.hy926 cells restores BCL2 expression in MIN6 pancreatic beta cells under Thapsigargin-induced ER stress in the co-culture setup[1].
Rosolic acid pretreatment (10 μM; 24 h) of EA.hy926 cells rescues PDX1 expression in MIN6 pancreatic beta cells under Thapsigargin-induced ER stress in the co-culture setup[1].
Rosolic acid pretreatment (10 μM; 24 h) of EA.hy926 cells normalizes GRP78 and CHOP expression in MIN6 pancreatic beta cells under Thapsigargin-induced ER stress in the co-culture setup[1].
Rosolic acid pretreatment (10 μM; 24 h) of EA.hy926 cells restores intracellular insulin levels in MIN6 pancreatic beta cells under Thapsigargin-induced ER stress in the co-culture setup[1].
Rosolic acid treatment (10 μM; 24 h) upregulates Nrf2, HO-1, and NQO-1 expression in EA.hy926 cells under ER stress in the co-culture setup[1].
Rosolic acid pretreatment (10 μM; 24 h) of EA.hy926 cells upregulates Nrf2 and NQO-1 expression in MIN6 pancreatic beta cells under Thapsigargin-induced ER stress in the co-culture setup[1].
Rosolic acid pretreatment (10 μM; 24 h) of EA.hy926 cells suppresses increased MDA levels in MIN6 pancreatic beta cells under Thapsigargin-induced ER stress in the co-culture setup[1].
Rosolic acid pretreatment (10 μM; 24 h) reduces Thapsigargin-induced inflammatory cytokines and chemokines in EA.hy926 cells in the co-culture setup[1].
Rosolic acid pretreatment (10 μM; 24 h) of EA.hy926 cells protects MIN6 pancreatic beta cells against Thapsigargin-induced reduction in viability in the co-culture setup[1].
Rosolic acid (15 μM; 6-18 h) induces sustained HO-1 protein expression in bovine aortic endothelial cells, with continued up-regulation at 18 h[3].
Rosolic acid (15 μM; 6 h) protects bovine aortic endothelial cells against hydrogen peroxide-induced oxidative stress[3].
MedChemExpress (MCE) has not independently confirmed the accuracy of these methods. They are for reference only. Further protocols information, click here.
-
Cell Line:EA.hy926 endothelial cells
-
Concentration:2.5 μM; 5 μM; 10 μM; 25 μM
-
Incubation Time:24 h
-
Result:Observed cytotoxicity at doses higher than 25 μM.\n
Protected cells against aThapsigargin-induced cytotoxicity at 5 and 10 μM in a dose-dependent manner.
-
Cell Line:EA.hy926 endothelial cells
-
Concentration:10 μM
-
Incubation Time:24 h
-
Result:Significantly repressed Thapsigargin-induced GRP78 and CHOP expression to levels comparable to control.\nUpregulated Nrf2, HO-1, and NQO-1 expression.
-
Cell Line:EA.hy926 endothelial cells
-
Concentration:10 μM
-
Incubation Time:24 h
-
Result:Decreased GRP-78 and CHOP protein levels compared to Thapsigargin-exposed cells.
-
Cell Line:MIN6 pancreatic beta cells
-
Concentration:10 μM
-
Incubation Time:24 h
-
Result:Restored BCL2 expression to control level.\nRescued PDX1 expression.\nUpregulated Nrf2 and NQO-1 gene expression.\nNormalized GRP78 and CHOP expression.
-
Cell Line:MIN6 pancreatic beta cells
-
Concentration:10 μM
-
Incubation Time:24 h
-
Result:Showed an intracellular insulin level comparable to control.
-
Cell Line:MIN6 pancreatic beta cells
-
Concentration:10 μM
-
Incubation Time:24 h
-
Result:Protected MIN6 pancreatic beta cells from Thapsigargin-induced loss of viability in a co-culture system.
-
Cell Line:Bovine aortic endothelial cells
-
Concentration:15 μM
-
Incubation Time:6 h
-
Result:Increased heme oxygenase activity to 2676 pmol bilirubin/mg protein/h compared to 453 pmol bilirubin/mg protein/h in control cells.
Achieved cell viability of 94% of control.
-
Cell Line:Bovine aortic endothelial cells
-
Concentration:15 μM
-
Incubation Time:6 h; 18 h
-
Result:Was the most potent inducer of HO-1 at 6 h among the compounds tested.
Further enhanced HO-1 expression at 18 h, whereas it was gradually decreasing with curcumin, CAPE, or 2'-hydroxychalcone.
-
Cell Line:Bovine aortic endothelial cells
-
Concentration:15 μM
-
Incubation Time:24 h; 48 h
-
Result:Did not produce any evident cytotoxicity at 24 or 48 h, unlike curcumin or CAPE, which caused a time-dependent decrease in cell viability.
-
Cell Line:Bovine aortic endothelial cells
-
Concentration:15 μM
-
Incubation Time:6 h pretreatment; 2 h
-
Result:Significantly attenuated hydrogen peroxide-mediated cytotoxicity in endothelial cells.
In Vivo
Rosolic acid (1-30 mg/kg b.w.; i.p.; daily; 21 days) is safe at doses up to 10 mg/kg b.w., but doses of 30 mg/kg b.w. cause mild hepatic and renal toxicity in rats[2].
MedChemExpress (MCE) has not independently confirmed the accuracy of these methods. They are for reference only.
-
Animal Model:Wistar Albino rats (male, 100-150 g, 5-7 weeks old, high-fat diet-fed and streptozotocin-induced type-2 diabetic model)[2]
-
Dosage:5 mg/kg b.w.; 10 mg/kg b.w.
-
Administration:i.p.; once daily; 21 days
-
Result:Reduced cholesterol to 255.36 ± 6.83 mg/dL, triglycerides to 56.82 ± 5.63 mg/dL, VLDL to 11.38 ± 2.27 mg/dL, and LDL to 181.35 ± 11.25 mg/dL, and increased HDL to 61.28 ± 5.19 mg/dL at 10 mg/kg.
Decreased blood glucose levels starting from Day 7 at 10 mg/kg.
Improved glucose tolerance in OGTT starting from 60 minutes with peak reduction at 180 minutes.
Restored aortic tissue architecture at 5 and 10 mg/kg.
Increased NRF2 and downstream targets NQO1 and HO-1 gene expression, with a 1.8-fold increase in NRF2 protein levels at 10 mg/kg.
Dose-dependently reduced ER stress markers GRP78 and CHOP, inflammatory markers ICAM-1 and VCAM-1, and endothelin-1 expression with 5- and 2-fold reductions at 5 and 10 mg/kg, respectively.
-
Animal Model:Wistar rats (female)[2]
-
Dosage:1 mg/kg b.w.; 3 mg/kg b.w.; 10 mg/kg b.w.; 30 mg/kg b.w.
-
Administration:i.p.; daily; 21 days
-
Result:Induced hepatic toxicity characterized by cellular damage and structural alterations in liver tissues and significant impairment of serum liver function parameters at 30 mg/kg b.w.
Induced pronounced renal cell damage including structural alterations in renal tubules and glomeruli and a significant increase in blood urea nitrogen (BUN) levels at 30 mg/kg b.w.
No toxicity or functional impairments were observed at 1, 3, and 10 mg/kg.


Chemical Information
-
No. CAS 603-45-2
-
Appearance Solid
-
Peso molecular 290.31
-
Fòrmula C19H14O3
-
Color White to off-white
-
SMILES
C1=C(C=CC(=C1)O)C(=C2C=CC(=O)C=C2)C3=CC=C(C=C3)O
-
Envío
Room temperature in continental US; may vary elsewhere.
-
Almacenamiento
Please store the product under the recommended conditions in the Certificate of Analysis.

Protocolo
-
Human pluripotent stem cell endothelial-cell differentiation
Human pluripotent stem cell endothelial differentiation is based on stepwise developmental patterning: early activation of WNT/GSK3β inhibition promotes mesodermal or vascular progenitor entry, followed by endothelial specification using VEGF-related signaling, BMP4, FGF2, Notch modulation, or cAMP depending on the published protocol. Endothelial differentiation is read out by acquisition of CD31, CD34, VE-cadherin/CD144, KDR/VEGFR2, vWF, Tie2, NOS3, acetylated LDL uptake, tube/network formation, barrier function, and in vivo vessel-forming capacity where tested.
-
Vascular/Branching Fractal Analysis
Vascular/branching fractal analysis quantifies the geometric complexity of vessel trees or vascular networks from segmented 2D images, commonly by converting vessels into binary and/or skeletonized maps and estimating fractal dimension using box-counting or related approaches. Fractal dimension is interpreted as an image-derived readout of vascular branching complexity, space filling, or density, and has been applied to retinal photographs, fluorescein angiography, OCT angiography, capillary perfusion maps, and in vitro Matrigel angiogenesis networks. The assay readout is generated from vessel-positive pixels after image preprocessing, vessel segmentation, binarization, and optional skeletonization; reported outputs include fractal dimension, vessel density, branchpoint density, endpoint density, vessel length density, tortuosity, and generation-based branching metrics when VESGEN-style analysis is used. The biological interpretation is limited to quantitative vascular patterning and s
-
Annexin V plus membrane-impermeant dye apoptosis staining
Annexin V-based apoptosis assays rely on the detection of phosphatidylserine (PS) externalization from the inner leaflet of the plasma membrane to the outer leaflet, an early biochemical hallmark of apoptosis. Fluorescently labeled Annexin V binds PS in a calcium-dependent manner, enabling identification of early apoptotic cells by flow cytometry or fluorescence microscopy. When combined with a membrane-impermeant DNA-binding dye (e. g. , propidium iodide), this approach allows discrimination between viable (Annexin V−/dye−), early apoptotic (Annexin V+/dye−), and late apoptotic or necrotic (Annexin V+/dye+) cell populations by assessing membrane integrity and PS exposure.
-
ROS/oxidative-stress fluorescent staining
ROS/oxidative-stress fluorescent staining uses cell-permeant fluorogenic probes that become fluorescent after oxidation inside cells or tissues; commonly used examples include DCFH-DA/DCFDA for broad cellular oxidant detection, DHE for superoxide-related signal detection, MitoSOX for mitochondrial superoxide-related signal detection, and CellROX probes for oxidative-stress-associated fluorescence readouts. The assay detects probe oxidation rather than a single ROS species unless the probe and analysis method have been chemically validated for that species. DCFH-DA enters cells, is deacetylated by intracellular esterases to DCFH, and produces fluorescent DCF after oxidation, so the readout is used as an operational measure of total cellular oxidative stress rather than a species-specific ROS measurement. DHE and MitoSOX can report superoxide-related oxidation, but red fluorescence alone can include non-specific ethidium-like oxidation products; HPLC or optimized spectral approaches are
-
Human Islet Cell Culture
The method of preserving islets in vitro, with purified reduced immunogenicity. The steps are islet isolation, islet cell purification, in vitro determination of islet function and islet cell culture.
-
Research Protocol for Inflammation-related Diseases
The NLRP3 inflammasome is a cytosolic innate immune signaling platform that integrates priming signals and danger-signal activation to promote caspase-1 activation, maturation of IL-1β and IL-18, and gasdermin D-mediated pyroptotic cell death. The core experimental logic is to determine whether inflammatory disease phenotypes are driven by increased NLRP3 expression, ASC-containing inflammasome assembly, caspase-1 cleavage, GSDMD cleavage, and extracellular release of IL-1β/IL-18 rather than by nonspecific cell injury alone. The pathway is strongly linked to inflammation-related disease phenotypes because monosodium urate crystals activate NALP3/NLRP3 inflammasome signaling in gout-like crystal inflammation, cholesterol crystals activate NLRP3 inflammasomes in atherogenesis models, and DSS-induced intestinal inflammation has been reported to involve NLRP3 inflammasome activity. However, experimental colitis studies also show context-dependent protective effects of NLRP3 inflammasome co
-
Research Protocol for Metabolic Diseases
AMP-activated protein kinase, AMPK, is a conserved cellular energy sensor that responds to reduced cellular energy status and coordinates metabolism by increasing ATP-generating catabolic pathways while suppressing ATP-consuming anabolic processes. In metabolic disease research, the AMPK pathway is experimentally relevant because it regulates hepatic lipid synthesis, fatty acid oxidation, glucose production, skeletal-muscle glucose disposal, mTORC1-linked biosynthesis, autophagy, mitochondrial homeostasis, and whole-body energy balance. The central pathway logic is that energy stress, metformin, exercise-like stimulation, or direct AMPK activators increase AMPKα Thr172 phosphorylation and downstream substrate phosphorylation, including ACC and RAPTOR. Phosphorylation of ACC suppresses lipogenesis and supports fatty acid oxidation, whereas phosphorylation of RAPTOR suppresses mTORC1 signaling and links cellular energy status to growth and protein synthesis control. The pathway is linked
-
Cytoplasmic-Nuclear Fractionated Protein Extraction
Cytoplasmic-nuclear fractionated protein extraction separates soluble cytoplasmic proteins from nuclear-enriched proteins by mild plasma-membrane permeabilization, differential centrifugation, washing of nuclei, and extraction of nuclear proteins for downstream immunoblotting or related molecular analysis. The readout is the relative abundance of a protein in cytoplasmic and nuclear fractions, commonly assessed by western blotting together with compartment markers such as tubulin or pyruvate kinase for cytoplasm and lamin, nucleoporin, hnRNP, H2AX, or Lamin B for nuclear fractions.
-
Apoptosis
Apoptosis, also called programmed cell death, is generally characterized by distinct morphological characteristics.
-
TUNEL staining for apoptotic DNA fragmentation
TUNEL staining detects DNA strand breaks by using terminal deoxynucleotidyl transferase to add labeled nucleotides to exposed 3′-OH DNA termini, generating either microscopic staining in fixed cells or tissue sections, or fluorescence/cytometric signal in cell suspensions. TUNEL positivity reflects DNA fragmentation but should not be interpreted alone as definitive apoptosis, because TUNEL can also label necrotic, autolytic, mechanically damaged, or DNA-repair-associated DNA breaks.
-
Research Protocol for Endocrine Diseases
Endocrine diseases often arise from disrupted hormone production, hormone signaling, or target-tissue responsiveness; for diabetes-focused endocrine disease models, insulin signaling regulates glucose uptake, hepatic glucose output, lipid metabolism, and β-cell compensation. Type 2 diabetes develops through interacting defects in insulin resistance, β-cell dysfunction, adipose inflammation, hepatic glucose overproduction, altered incretin signaling, and ectopic lipid metabolism. A major unresolved question is whether endocrine dysfunction is driven primarily by target-tissue insulin resistance, intrinsic β-cell failure, immune/inflammatory stress, or combined multi-organ failure that differs by disease stage.
-
Endothelial Tube Formation Assay
Endothelial tube formation assay evaluates the ability of endothelial cells to attach, migrate, align, and organize into capillary-like networks when cultured on gelled basement membrane extract or Matrigel; the readout is the morphology and quantity of tube-like networks, which reflects an in vitro endothelial morphogenesis step related to angiogenesis. Basement membrane extract/Matrigel provides laminin-rich extracellular matrix cues that support endothelial differentiation into capillary-like structures, but it can contain biologically active growth factors, so growth-factor-reduced matrix is preferred when testing defined angiogenic stimulators or inhibitors.
-
Apoptosis Solutions
Apoptosis is a regulated, generally non-lytic cell-death pathway that removes unwanted, damaged, infected, or abnormal cells through coordinated morphological changes, caspase activation, DNA fragmentation, and membrane remodeling. The intrinsic apoptosis pathway is controlled mainly by mitochondrial outer membrane permeabilization, BCL-2 family proteins, cytochrome c release, apoptosome formation, caspase-9 activation, and downstream executioner caspase-3/7 activation. The extrinsic apoptosis pathway is initiated by death receptors such as Fas, TNFR, and TRAIL receptors, which recruit adaptor proteins and activate caspase-8 before engaging executioner caspases or mitochondrial amplification through BID cleavage. Apoptosis is linked to many phenotypes, including cancer cell killing, tissue homeostasis, immune regulation, neurodegeneration, infection response, and treatment-induced cytotoxicity; unresolved questions include how apoptosis interacts with necroptosis, pyroptosis, ferroptos
-
Endothelial Cell Migration/Angiogenic Sprouting Assay
Endothelial cell migration and angiogenic sprouting assays are in vitro (and partially ex vivo-adapted) functional models that quantify the ability of endothelial cells to undergo coordinated migration, extracellular matrix invasion, and multicellular organization into capillary-like sprouts in response to pro-angiogenic stimuli such as VEGF, bFGF, or conditioned microenvironments. These assays are used to model early angiogenic events including tip-cell formation, directional migration, and lumen-like sprout extension, which collectively reflect angiogenic activation and vascular morphogenesis processes observed in vivo.


Pureza y Documentación
-
Ficha de datos (292 KB)
-
SDS (252 KB)
- Français - FR (252 KB)
- Deutsch - DE (252 KB)
- Norwegian - NO (252 KB)
- Español - ES (252 KB)
- Swedish - SV (252 KB)
- Italian - IT (252 KB)
- Korean - KR (252 KB)
- Portuguese - PT (252 KB)
-
Instrucciones de manejo (2659 KB)
Referencias

Calculators
Concentration (start) × Volume (start) = Concentration (final) × Volume (final)


Rosolic acid Related Classifications
HY-W104821 Related Classifications
 Powered by Bioz