



Cephaeline dihydrobromide
Based on 2 publication(s) in Google Scholar
Cephaeline dihydrobromide ((-)-Cephaeline dihydrobromide; NSC 32944 dihydrobromide) is a ferroptosis inducer, with broad-spectrum anticancer and antiviral activities. Cephaeline dihydrobromide induces ferroptosis (Ferroptosis) by upregulating p53, inhibiting NRF2, activating ULK3, downregulating the expressions of SLC7A11 and GPX4 in a p53-dependent manner, reducing GSH and mitochondrial membrane potential, and increasing lipid peroxidation and iron accumulation. Cephaeline dihydrobromide inhibits cancer cell proliferation, migration and tumor growth. Cephaeline dihydrobromide inhibits Ebola virus (EBOV) VLP entry and infection, with IC50 values of 3.27 μM and 22.18 μM respectively; it also inhibits Zika virus (ZIKV) NS5 RdRp activity (IC50 = 976 nM), and binds to severe acute respiratory syndrome coronavirus 2 (SARS-CoV-2) RdRp and N protein, with Kd values of 8.9 μM and 53.8 μM respectively. Cephaeline dihydrobromide can be used in studies related to breast cancer, lung cancer, COVID-19, EBOV and ZIKV infections.
For research use only. We do not sell to patients.
- CAS No.: 6014-81-9
- Formula: C28H40Br2N2O4
- Molecular Weight:628.44
-
Storage:
Please store the product under the recommended conditions in the Certificate of Analysis.


To place orders, for customer services and technical support, please contact: MedChemExpress USA
Tel: 609-228-6898 E-mail: [email protected] [email protected]


-
 Biological Activity
-
Chemical Information
- Protocols
- Purity & Documentation
- References
-
 Help & FAQs


Publications Citing Use of MedChemExpress (MCE) Cephaeline dihydrobromide
More Customer Validation & Images

-
Cell Proliferation/Viability Assay
-
Cell Migration/Invasion Assay
-
WB


Biological Activity
Description
|
EBOV 22.18 μM (IC50) |
ZIKV NS5 RdRp 976 nM (IC50) |
SARS-CoV-2 RdRp 8.9 μM (Kd) |
SARS-CoV-2 N protein 53.8 μM (Kd) |
GPX4 |
Cellular Effect
|
Cell Line

|
Type | Value | Description | References |
|---|---|---|---|---|
| 4T1 | IC50 |
38.89 nM
|
Antiproliferative and viability inhibitory activity against murine 4T1 breast cancer cells assessed by CCK-8 assay following 72 h incubation.
Antiproliferative and viability inhibitory activity against murine 4T1 breast cancer cells assessed by CCK-8 assay following 72 h incubation.
|
38339810 |
| MDA-MB-231 | IC50 |
50.29 nM
|
Antiproliferative and viability inhibitory activity against human MDA-MB-231 breast cancer cells assessed by CCK-8 assay following 72 h incubation.
Antiproliferative and viability inhibitory activity against human MDA-MB-231 breast cancer cells assessed by CCK-8 assay following 72 h incubation.
|
38339810 |
| NCI-H460 | IC50 |
88 nM
|
Inhibition of cell viability against human H460 lung cancer cells incubated for 24 hrs by Cell Counting Kit-8 (CCK-8) assay.
Inhibition of cell viability against human H460 lung cancer cells incubated for 24 hrs by Cell Counting Kit-8 (CCK-8) assay.
|
42319734 |
| NCI-H460 | IC50 |
58 nM
|
Inhibition of cell viability against human H460 lung cancer cells incubated for 48 hrs by Cell Counting Kit-8 (CCK-8) assay.
Inhibition of cell viability against human H460 lung cancer cells incubated for 48 hrs by Cell Counting Kit-8 (CCK-8) assay.
|
42319734 |
| NCI-H460 | IC50 |
35 nM
|
Inhibition of cell viability against human H460 lung cancer cells incubated for 72 hrs by Cell Counting Kit-8 (CCK-8) assay.
Inhibition of cell viability against human H460 lung cancer cells incubated for 72 hrs by Cell Counting Kit-8 (CCK-8) assay.
|
42319734 |
| A549 | IC50 |
89 nM
|
Inhibition of cell viability against human A549 lung cancer cells incubated for 24 hrs by Cell Counting Kit-8 (CCK-8) assay.
Inhibition of cell viability against human A549 lung cancer cells incubated for 24 hrs by Cell Counting Kit-8 (CCK-8) assay.
|
42319734 |
| A549 | IC50 |
65 nM
|
Inhibition of cell viability against human A549 lung cancer cells incubated for 48 hrs by Cell Counting Kit-8 (CCK-8) assay.
Inhibition of cell viability against human A549 lung cancer cells incubated for 48 hrs by Cell Counting Kit-8 (CCK-8) assay.
|
42319734 |
| A549 | IC50 |
43 nM
|
Inhibition of cell viability against human A549 lung cancer cells incubated for 72 hrs by Cell Counting Kit-8 (CCK-8) assay.
Inhibition of cell viability against human A549 lung cancer cells incubated for 72 hrs by Cell Counting Kit-8 (CCK-8) assay.
|
42319734 |
| Vero E6 | EC50 |
0.0123 μM
|
Inhibition of SARS-CoV-2 replication in Vero E6 cells assessed via qRT-PCR measurement of viral copy numbers in cell supernatants following 1 h pre-treatment, 1 h co-inoculation, and 24 h post-infection incubation.
Inhibition of SARS-CoV-2 replication in Vero E6 cells assessed via qRT-PCR measurement of viral copy numbers in cell supernatants following 1 h pre-treatment, 1 h co-inoculation, and 24 h post-infection incubation.
|
33907306 |
| Vero E6 | CC50 |
49.048 μM
|
Cytotoxicity against Vero E6 cells measured by CCK8 assay following 24 h incubation.
Cytotoxicity against Vero E6 cells measured by CCK8 assay following 24 h incubation.
|
33907306 |
| Huh-7 | CC50 |
3.035 μM
|
Cytotoxicity against Huh-7 cells measured by CCK8 assay following 24 h incubation.
Cytotoxicity against Huh-7 cells measured by CCK8 assay following 24 h incubation.
|
33907306 |
| HEK-293T | CC50 |
1.995 μM
|
Cytotoxicity against HEK293T cells measured by CCK8 assay following 24 h incubation.
Cytotoxicity against HEK293T cells measured by CCK8 assay following 24 h incubation.
|
33907306 |
In Vitro
Cephaeline (2.5-320 nM; 72 h) dihydrobromide potently inhibits the proliferation of 4T1 and MDA-MB-231 breast cancer cells, with IC50 values of 38.89 nM and 50.29 nM, respectively[2].
Cephaeline (80 nM; 24 h) dihydrobromide inhibits the migration of 4T1 and MDA-MB-231 breast cancer cells[2].
Cephaeline (14 day) dihydrobromide inhibits colony formation of 4T1 and MDA-MB-231 breast cancer cells, and this effect is attenuated by p53 siRNA knockdown[2].
Cephaeline (5-400 nM; 24-72 h) dihydrobromide potently inhibits the viability of H460 and A549 human lung cancer cells in a time-dependent manner, with IC50 values ranging from 35 nM to 89 nM[1].
Cephaeline (0.01-30 μM; 48 h) dihydrobromide inhibits the cell viability of mucoepidermoid carcinoma cell lines UM-HMC-1, UM-HMC-2 and UM-HMC-3A, with IC50 values of 0.16 μM, 2.08 μM and 0.02 μM, respectively[4].
Cephaeline (at the corresponding IC50 concentration; 72 h) dihydrobromide inhibits the cell growth of UM-HMC-1 and UM-HMC-2 mucoepidermoid carcinoma cell lines, while the growth inhibitory effect on UM-HMC-3A is not statistically significant[4].
Cephaeline (at respective IC50 concentrations) dihydrobromide inhibits cell migration of the mucoepidermoid carcinoma cell lines UM-HMC-1, UM-HMC-2, and UM-HMC-3A, with the onset time of inhibition varying among different cell lines[4].
Cephaeline (at the corresponding IC50 concentration; 24-48 h) dihydrobromide increases the acetylation level of histone H3 lysine 9 in the mucoepidermoid carcinoma cell lines UM-HMC-1, UM-HMC-2 and UM-HMC-3A[4].
Cephaeline (at the corresponding IC50 concentration; 24 h) dihydrobromide reduces the level of ALDH+ cancer stem cells in UM-HMC-2 mucoepidermoid carcinoma cells, but increases the ALDH+ level in UM-HMC-1 and UM-HMC-3A cells[4].
Cephaeline (at the corresponding IC50 concentration; 5 days) dihydrobromide completely inhibits tumor sphere formation in UM-HMC-1 and UM-HMC-2 mucoepidermoid carcinoma cells, and reduces tumor sphere formation in UM-HMC-3A cells[4].
Cephaeline (20-80 nM; 72 h) dihydrobromide reduces intracellular GSH levels in a concentration-dependent manner and increases intracellular MDA levels in 4T1 and MDA-MB-231 breast cancer cells[2].
Cephaeline (20-80 nM; 72 h) dihydrobromide increases intracellular ROS levels in 4T1 and MDA-MB-231 breast cancer cells in a concentration-dependent manner[2].
Cephaeline (20-80 nM; 72 h) dihydrobromide increases the levels of total iron and Fe2+ in 4T1 and MDA-MB-231 breast cancer cells in a concentration-dependent manner[2].
Cephaeline (20-80 nM; 72 h) dihydrobromide downregulates the protein expression of SLC7A11 and GPX4 in a concentration-dependent manner, and upregulates the protein expression of p53 in 4T1 and MDA-MB-231 breast cancer cells[2].
The ferroptosis and cell death induced in human lung cancer cells H460 and A549 by cephaeline (100 nM; 24 h) dihydrobromide are mediated by targeting NRF2, as pretreatment with the NRF2 agonist TBHQ reverses these effects[1].
Cephaeline (80 nM; 72 h) dihydrobromide induces ferroptosis-related changes (decreased GSH levels, increased MDA and ROS levels, downregulated expression of SLC7A11 and GPX4) in 4T1 and MDA-MB-231 breast cancer cells, and these effects are blocked by p53 siRNA knockdown[2].
Cephaeline (25-100 nM; 24 h) dihydrobromide increases intracellular iron levels and reactive oxygen species levels in H460 and A549 human lung cancer cells[1].
Cephaeline (25-100 nM; 24 h) dihydrobromide regulates the expression of ferroptosis- and iron metabolism-related genes in H460 and A549 human lung cancer cells, downregulates the expression of GPX4, SLC7A11 and SLC40A1, and upregulates the expression of transferrin[1].
Cephaeline 25-100 nM; 24 h) dihydrobromide downregulates the protein levels of GPX4, SLC7A11, SLC40A1 and NRF2, while upregulates the protein expression of transferrin in human lung cancer H460 and A549 cells[1].
Cephaeline (25-100 nM; 24 h) dihydrobromide induces lipid peroxidation in human lung cancer cells H460 and A549, which can be detected by increased levels of malondialdehyde[1].
Cephaeline (25-100 nM; 24 h) dihydrobromide reduces glutathione levels in H460 and A549 human lung cancer cells, thereby impairing their antioxidant capacity[1].
Cephaeline (1.950-50 μM; 90 s injection, 180 s dissociation) dihydrobromide binds to purified SARS-CoV-2 nsp12 with a KD value of 19.6 μM[3].
Cephaeline (1.301-50 μM; 90 s injection, 180 s dissociation) dihydrobromide binds to the SARS-CoV-2 nsp12-nsp7-nsp8-RNA complex with a KD value of 8.94 μM[3].
Cephaeline (1.301-50 μM; 90 s injection, 180 s dissociation) dihydrobromide binds to purified SARS-CoV-2 N protein with a KD value of 58.24 μM[3].
Cephaeline (24 h) dihydrobromide potently inhibits the replication of SARS-CoV-2 in Vero E6 cells, with an EC50 of 0.0123 μM[3].
Cephaeline (1 h) dihydrobromide inhibits ZIKV NS5 RdRp polymerase activity in HEK293 cells, with an IC50 value of 976 nM[5].
Cephaeline (72 h) dihydrobromide inhibits Ebola virus VLP entry into HeLa cells with an IC50 value of 3.27 μM, and suppresses Ebola virus infection in Vero E6 cells with an IC50 value of 22.18 nM[5].
Cephaeline (24 h) dihydrobromide exhibits cytotoxicity in Vero E6, Huh-7 and HEK293T cells, with CC50 values of 49.048, 3.035 and 1.995 μM, respectively[3].
MedChemExpress (MCE) has not independently confirmed the accuracy of these methods. They are for reference only. Further protocols information, click here.
-
Cell Line:H460 and A549 human lung cancer cell lines
-
Concentration:25, 50, 100 nM
-
Incubation Time:24 h
-
Result:Significantly downregulated the expression of antioxidant-related genes GPX4 and SLC7A11 in both H460 and A549 cells.
Upregulated the iron influx-promoting gene transferrin in both H460 and A549 cells.
Downregulated the iron efflux-regulating gene SLC40A1 in both H460 and A549 cells.
-
Cell Line:H460 and A549 human lung cancer cell lines
-
Concentration:5, 15, 25, 50, 100, 200, 400 nM
-
Incubation Time:24 h; 48 h; 72 h
-
Result:Exhibited concentration- and time-dependent inhibitory effects on H460 and A549 cell viability.
Reduced H460 cell viability with IC50 values of 88 nM at 24 h, 58 nM at 48 h, and 35 nM at 72 h.
Reduced A549 cell viability with IC50 values of 89 nM at 24 h, 65 nM at 48 h, and 43 nM at 72 h.
-
Cell Line:H460 and A549 human lung cancer cell lines
-
Concentration:25, 50, 100 nM
-
Incubation Time:24 h
-
Result:Significantly reduced protein levels of GPX4, SLC7A11, SLC40A1, and the antioxidant regulatory protein NRF2 in both H460 and A549 cells.
Increased transferrin protein levels in both H460 and A549 cells.
Produced results consistent with RT-qPCR gene expression findings.
-
Cell Line:H460 and A549 human lung cancer cell lines
-
Concentration:100 nM
-
Incubation Time:24 h
-
Result:Induced cell death in both H460 and A549 cells.
Induced increases in lipid ROS and lipid peroxidation in both H460 and A549 cells.
Reduced intracellular GSH levels in both H460 and A549 cells.
Induced LDH release in both H460 and A549 cells.
Downregulated GPX4 and SLC7A11 proteins in both H460 and A549 cells.
Had all above effects significantly reversed by pre-treatment with NRF2 agonist TBHQ.
-
Cell Line:murine 4T1 breast cancer cells, human MDA-MB-231 breast cancer cells
-
Concentration:2.5, 5, 10, 20, 40, 80, 160 and 320 nM
-
Incubation Time:72 h
-
Result:Inhibited cell viability and proliferation in a dose-dependent manner in both cell lines.
Exhibited an IC50 value of 38.89 nM for 4T1 cells.
Exhibited an IC50 value of 50.29 nM for MDA-MB-231 cells.
-
Cell Line:murine 4T1 breast cancer cells, human MDA-MB-231 breast cancer cells
-
Concentration:80 nM
-
Incubation Time:24 h
-
Result:Significantly reduced the migratory capacity of both 4T1 and MDA-MB-231 cells, as measured by decreased wound closure relative to untreated controls.
-
Cell Line:murine 4T1 breast cancer cells, human MDA-MB-231 breast cancer cells
-
Concentration:20, 40 and 80 nM
-
Incubation Time:72 h
-
Result:Caused a concentration-dependent decrease in intracellular GSH levels in both 4T1 and MDA-MB-231 cells.
Caused a corresponding concentration-dependent increase in intracellular MDA levels in both 4T1 and MDA-MB-231 cells.
-
Cell Line:murine 4T1 breast cancer cells, human MDA-MB-231 breast cancer cells
-
Concentration:20, 40 and 80 nM
-
Incubation Time:72 h
-
Result:Increased ROS levels in 4T1 and MDA-MB-231 breast cancer cells in a concentration-dependent manner.
-
Cell Line:murine 4T1 breast cancer cells, human MDA-MB-231 breast cancer cells
-
Concentration:20, 40 and 80 nM
-
Incubation Time:72 h
-
Result:Caused a concentration-dependent downregulation of SLC7A11 protein expression in both 4T1 and MDA-MB-231 cells.
Caused a concentration-dependent downregulation of GPX4 protein expression in both 4T1 and MDA-MB-231 cells.
Caused a concentration-dependent upregulation of p53 protein expression in both 4T1 and MDA-MB-231 cells.
Increased nuclear p53 fluorescence intensity in both cell lines via immunofluorescence staining.
-
Cell Line:human mucoepidermoid carcinoma cell lines UM-HMC-1, UM-HMC-2, UM-HMC-3A
-
Concentration:0.16 μM (UM-HMC-1); 2.08 μM (UM-HMC-2); 0.02 μM (UM-HMC-3A)
-
Incubation Time:24 h, 48 h, 72 h
-
Result:Inhibited cell growth in UM-HMC-1 and UM-HMC-2, with the largest difference between treated and control groups observed at 72h.
Inhibited growth in UM-HMC-3A but did not reach statistical significance.
-
Cell Line:human mucoepidermoid carcinoma cell lines UM-HMC-1, UM-HMC-2, UM-HMC-3A
-
Concentration:0.16 μM (UM-HMC-1); 2.08 μM (UM-HMC-2); 0.02 μM (UM-HMC-3A)
-
Incubation Time:6 h, 12 h, 24 h, 48 h
-
Result:Reduced cell migration in all three cell lines.
Induced significant inhibition in UM-HMC-1 at 48h and 60h.
Induced reduced migration in UM-HMC-2 and UM-HMC-3A as early as 24h after treatment.
-
Cell Line:human mucoepidermoid carcinoma cell lines UM-HMC-1, UM-HMC-2, UM-HMC-3A
-
Concentration:0.16 μM (UM-HMC-1); 2.08 μM (UM-HMC-2); 0.02 μM (UM-HMC-3A)
-
Incubation Time:24 h, 48 h
-
Result:Induced significant H3K9ac acetylation in all three cell lines as early as 24h after treatment, and acetylation levels remained elevated through 48h.
In Vivo
MedChemExpress (MCE) has not independently confirmed the accuracy of these methods. They are for reference only.
-
Animal Model:BALB/c-nu (5-week-old female) were injected subcutaneously in the right back with 1 × 10⁶ H460 lung cancer cells (dissolved in 0.1 mL PBS) to establish a subcutaneous tumor model[1]
-
Dosage:5 mg/kg; 10 mg/kg
-
Administration:i.p.; daily; 12 days
-
Result:Exerted significant in vivo antitumour effects at 5 mg/kg and 10 mg/kg doses.
Achieved an ED50 of 3 mg/kg and minimum effective concentration of 2.5 mg/kg in the subcutaneous tumor xenograft model.
Demonstrated equivalent anti-lung cancer efficacy to erastin at 10 mg/kg dose.
Caused no significant differences in body weight compared with control mice.
Induced changes in ferroptosis-related protein expression in tumor tissue consistent with in vitro findings.


Chemical Information
-
CAS No. 6014-81-9
-
Molecular Weight 628.44
-
Formula C28H40Br2N2O4
-
SMILES
COC(C=C(CCN1C[C@@H]2CC)C([C@]1([H])C[C@@H]2C[C@@H]3C4=CC(OC)=C(O)C=C4CCN3)=C5)=C5OC.Br.Br
-
Synonyms
(-)-Cephaeline dihydrobromide; NSC 32944 dihydrobromide
-
Structure Classification
-
Initial Source
-
Shipping
Room temperature in continental US; may vary elsewhere.
-
Storage
Please store the product under the recommended conditions in the Certificate of Analysis.


Publications (2)
-
Journal Impact Factor
-
Most Recent
-
J Cancer Res Clin Oncol
Prognostic value of amino acid metabolism-related gene expression in invasive breast carcinoma. [Abstract]2023 Oct;149(13):11117-11133. PMID: 37340191
Cephaeline dihydrobromide purchased from MedChemExpress. Usage Cited in: J Cancer Res Clin Oncol. 2023 Oct;149(13):11117-11133. [Abstract]
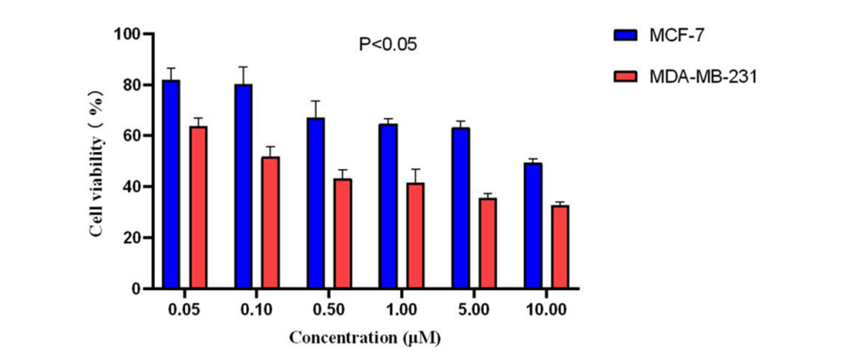
MDA-MB-231 and MCF-7 cells were treated with different dose of Cephaeline (0.1, 0.5, 1, 5, 10 μM) and cell viability were calculated by Cell Counting Kit-8.
Cephaeline dihydrobromide purchased from MedChemExpress. Usage Cited in: J Cancer Res Clin Oncol. 2023 Oct;149(13):11117-11133. [Abstract]
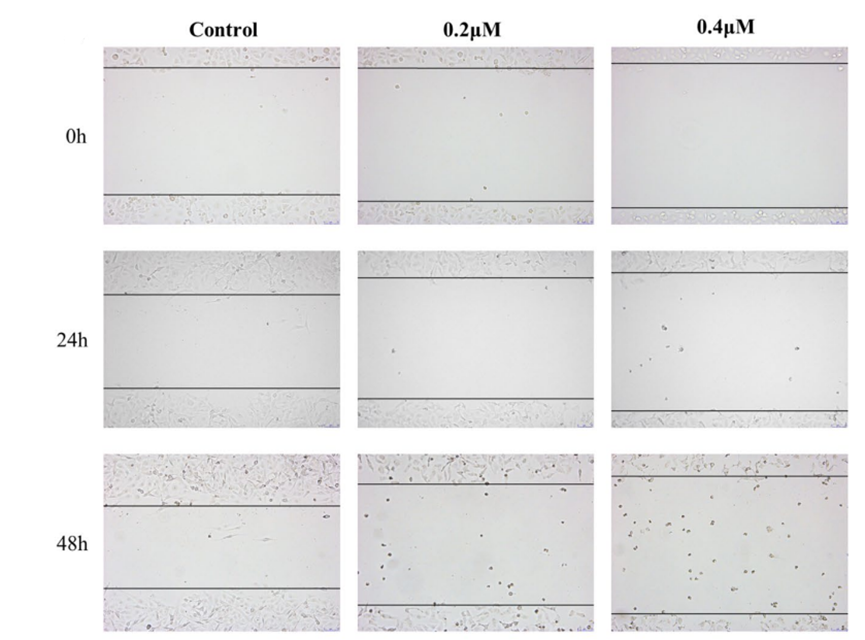
Representative images of cell scratch-wound healing test taken by a microscope at × 100 magnification treated with Cephaeline (0.2, 0.4 μM).
Cephaeline dihydrobromide purchased from MedChemExpress. Usage Cited in: J Cancer Res Clin Oncol. 2023 Oct;149(13):11117-11133. [Abstract]
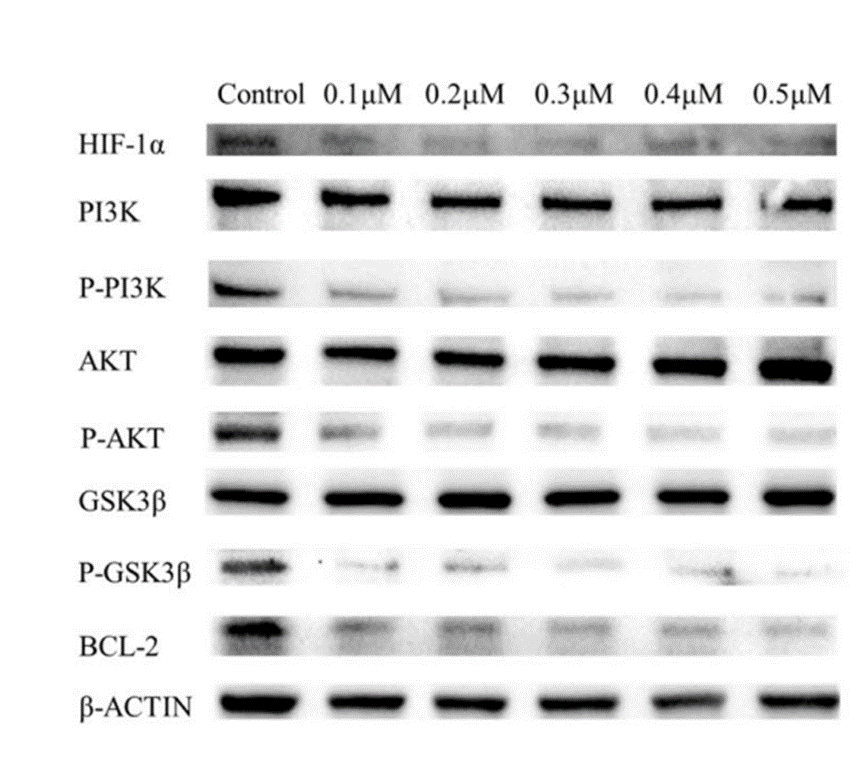
Representative western blots for PI3K/AKT signal pathway and HIF-1α under different doses of Cephaeline (0.1, 0.2, 0.3, 0.4, 0.5 μM).
-
Daru
2026 Jun 19;34(2):38. PMID: 42319734

Protocols
-
Cell migration
Cell migration is a method that plays an important role in wound healing, cell differentiation, embryonic development, etc.
-
Somatic Cell Culture
A method of simulating the in vivo environment in vitro to maintain the cell growth, differentation and main functions.
-
Breast Cancer Modeling
Breast cancer is a heterogeneous cancer, and it has been distinguished into four subtypes: luminal A, luminal B, HER2-positive and basal-like. Molecular mutations, epigenetic alterations, hormone exposure and immune microenvironment are related to the progression of breast cancer.
-
Cell Cytotoxicity Assay
Cytotoxicity assays are usually based on the assessment of cell membrane damage, which can also be indirectly detected by measuring cell viability. Detection methods include MTT assay, CKK-8 assay, LDH assay and ATP assay, etc.
-
Fluorescent plasma-membrane potential dye assay
Fluorescent plasma-membrane potential dye assays measure changes in cell membrane potential using voltage-sensitive dyes whose fluorescence changes when cells depolarize or hyperpolarize. Anionic bis-oxonol dyes such as DiBAC4(3) enter depolarized cells more readily and show increased fluorescence after intracellular binding, while hyperpolarization reduces dye accumulation and fluorescence. FMP/FLIPR membrane-potential dyes are used for faster, homogeneous microplate assays of ion-channel or receptor-mediated membrane-potential changes.
-
Mitochondrial membrane-potential and mitochondrial mass staining
Mitochondrial membrane potential staining measures the electrochemical polarization across the mitochondrial inner membrane in live cells using lipophilic cationic fluorescent probes; early rhodamine-based work showed that selective mitochondrial dye accumulation is lost when the mitochondrial transmembrane potential is dissipated. JC-1 reports mitochondrial polarization by shifting from green monomer fluorescence to red J-aggregate fluorescence as dye concentration increases within energized mitochondria; therefore, the red/green fluorescence ratio is used as a relative readout of mitochondrial membrane potential. TMRE or TMRM staining provides a single-channel relative readout because these cationic rhodamine esters accumulate in polarized mitochondria, and lower fluorescence indicates reduced mitochondrial polarization when acquisition and dye-loading conditions are controlled. Mitochondrial mass staining is commonly performed with MitoTracker Green FM or related MitoTracker dyes as
-
Ferroptosis Solutions
Ferroptosis is an iron-dependent, non-apoptotic form of regulated cell death characterized by lethal lipid peroxidation and sensitivity to suppression by iron chelators or lipophilic radical-trapping antioxidants. The core pathway links cystine uptake through system Xc−, glutathione availability, GPX4-dependent detoxification of phospholipid hydroperoxides, iron-dependent oxidative reactions, and polyunsaturated-phospholipid metabolism into a cell-death program that is biochemically and morphologically distinct from apoptosis, necrosis, and autophagy. The ferroptosis pathway is experimentally linked to phenotype through chemical and genetic perturbation. Erastin induces ferroptosis by inhibiting cystine uptake through system Xc− and weakening antioxidant defenses, while GPX4 inhibition or depletion causes lipid peroxide accumulation and ferroptotic cancer-cell death. ACSL4 and oxidizable arachidonoyl- or adrenoyl-containing phosphatidylethanolamines shape ferroptosis sensitivity by con
-
MTT Cell Proliferation Assay
The MTT assay is a colorimetric endpoint assay for estimating viable cell number, cell growth, cytotoxicity, or cell activation in cultured mammalian cells. Living cells reduce the yellow tetrazolium salt MTT into purple/blue formazan, while dead cells do not generate the same signal; the resulting color can be quantified with a multiwell spectrophotometer. MTT reduction is commonly interpreted as a readout of metabolic activity that often correlates with viable cell number, but it should not be treated as a direct cell-counting method unless the assay is optimized for the cell type and experimental condition. Studies show that MTT reduction can involve mitochondrial and non-mitochondrial reducing systems, and formazan may accumulate in intracellular lipid droplets rather than simply marking mitochondria.
-
Research Protocol for Infectious Diseases
Infectious-disease experiments test how pathogens interact with host barriers, innate immune receptors, inflammatory signaling, pathogen replication, and tissue injury; pattern-recognition receptors such as TLRs, RIG-I-like receptors, NOD-like receptors, and inflammasomes detect microbial molecules and activate NF-κB, interferon, and cytokine responses. The central hypothesis is that infection severity reflects the balance between pathogen burden and host response: protective inflammation restricts pathogen growth, whereas excessive or mislocalized inflammation contributes to tissue damage and disease phenotype. Unresolved questions include which host pathways are protective versus pathogenic, why some infection models fail to translate to human disease, and which combined readouts best predict clinically relevant infection outcomes.
-
Mitochondrial membrane-potential fluorescent assay
Mitochondrial membrane potential fluorescent assays estimate ΔΨm in living cells using lipophilic cationic dyes such as TMRM, TMRE, rhodamine 123, and JC-1, which accumulate in mitochondria according to membrane polarization; loss of signal after FCCP or CCCP treatment is interpreted as mitochondrial depolarization. TMRM/TMRE and rhodamine 123 are commonly used for semi-quantitative live-cell microscopy or flow cytometry, while JC-1 can report a shift from red aggregate fluorescence to green monomer fluorescence during depolarization; interpretation requires controls because dye concentration, quenching mode, cell type, dye efflux, and mitochondrial mass can affect fluorescence independently of ΔΨm.
-
BrdU Incorporation Assay
Bromodeoxyuridine (BrdU) incorporation assay is based on the principle that BrdU, a thymidine analog, is incorporated into newly synthesized DNA during the S phase of the cell cycle, thereby serving as a marker of DNA replication and cellular proliferation. Incorporated BrdU can be detected using anti-BrdU antibodies following DNA denaturation, enabling visualization or quantification of proliferating cells through immunochemical detection methods such as immunofluorescence or immunohistochemistry.
-
CFSE Dye Dilution Proliferation Assay
The CFSE (carboxyfluorescein diacetate succinimidyl ester) dye dilution proliferation assay is based on the covalent labeling of intracellular proteins by a cell-permeant fluorescent dye that becomes fluorescent upon intracellular ester cleavage and then is stably retained within cells. As labeled cells divide, the dye is partitioned equally between daughter cells, resulting in a stepwise halving of fluorescence intensity that can be quantified by flow cytometry to determine the number of cell divisions undergone by each cell population. This fluorescence dilution approach enables quantitative tracking of lymphocyte proliferation at the single-cell level over multiple rounds of division. CFSE-based proliferation analysis has been widely applied to measure antigen-driven lymphocyte expansion in vitro, where discrete fluorescence peaks correspond to successive cell divisions and allow reconstruction of proliferative history within heterogeneous populations.
-
Dye-dilution cell tracking and proliferation staining
Dye-dilution cell tracking assays quantify cell proliferation by covalently labeling intracellular proteins with a stable fluorescent dye that is equally partitioned between daughter cells during mitosis, resulting in stepwise halving of fluorescence intensity with each cell division as measured by flow cytometry histograms. Carboxyfluorescein diacetate succinimidyl ester (CFSE) is a prototypical dye that diffuses into cells, is enzymatically converted into a fluorescent compound, and then covalently binds intracellular amine groups, producing long-lived fluorescence suitable for tracking multiple rounds of division in vitro and in vivo. Successive generations of dividing cells form discrete peaks of decreasing fluorescence intensity, enabling estimation of proliferation history, precursor frequency, and division index within heterogeneous populations. Alternative dyes such as CellTrace Violet (CTV) and far-red membrane dyes (e. g. , PKH26) follow the same dilution principle but differ
-
Patient-Derived Orthotopic Xenograft (PDOX)
Patient-derived orthotopic xenograft (PDOX) modeling implants fresh patient tumor tissue or patient-derived tumor cells into the anatomically corresponding organ or tissue site of immunodeficient mice, usually by surgical orthotopic implantation, to preserve patient tumor histology, local microenvironmental context, invasion, metastatic behavior, and treatment-response features better than subcutaneous implantation. PDOX readouts include tumor engraftment, orthotopic tumor growth, local invasion, metastasis, recurrence after resection, histologic similarity to the donor tumor, biomarker retention, molecular concordance, survival, and response or resistance to therapy. PDOX models are used for preclinical drug testing and individualized therapy evaluation, but engraftment success varies by tumor type and specimen quality.
-
CCK-8/WST-8 Cell Proliferation Assay
The CCK-8/WST-8 assay is based on the reduction of the water-soluble tetrazolium salt WST-8 to a water-soluble formazan product by cellular dehydrogenases in metabolically active cells, where the generated formazan amount is proportional to the number of living cells and is quantified by measuring absorbance in the visible range, providing a colorimetric readout for cell viability and proliferation assessment. This class of tetrazolium-based assays improves upon earlier MTT-based systems by producing a water-soluble formazan, eliminating the need for organic solubilization steps and enabling direct spectrophotometric measurement in culture medium.
-
Protocol for Cell Cycle
Cell-cycle analysis by flow cytometry measures DNA content in single cells to estimate the fraction of cells in G0/G1, S, and G2/M phases. Propidium iodide intercalates into DNA, and after RNA removal with RNase, fluorescence intensity reflects cellular DNA content: 2N cells are assigned to G0/G1, cells between 2N and 4N to S phase, and 4N cells to G2/M. DNA-content analysis alone cannot reliably separate G0 from G1 or G2 from M. Ki-67 can distinguish quiescent G0 cells from cycling cells, EdU or BrdU incorporation marks active DNA synthesis in S phase, and phospho-histone H3 staining identifies mitotic cells within the 4N population.
-
Cell Counting-Based Growth Curve Assay
Cell counting-based growth curve assays quantify cell proliferation by directly measuring changes in viable cell number over time using manual or automated counting methods such as hemocytometer-based counting or instrument-assisted cell enumeration, enabling construction of growth curves that reflect population expansion dynamics in response to culture conditions. A widely used approach is trypan blue exclusion with hemocytometer counting, where membrane-compromised (non-viable) cells take up the dye, allowing discrimination between viable and non-viable cells while simultaneously enabling total cell number quantification. Repeated sampling across time points allows estimation of proliferation rate, growth phases, and comparative growth kinetics between experimental conditions.
-
Colony Formation (Clonogenic) Assay
The clonogenic (colony formation) assay measures the ability of a single cell to retain reproductive viability and form a macroscopic colony, typically defined as a cluster derived from one progenitor cell after a defined growth period. This assay is widely used to evaluate cell survival after exposure to ionizing radiation or cytotoxic treatments and is considered a standard method in radiation biology for generating dose-response relationships of reproductive cell death. Colony formation reflects long-term proliferative capacity rather than short-term metabolic activity, and survival is quantified by comparing treated versus untreated conditions based on colony number and derived survival fractions.
-
Cell Viability Determination by MTT Colorimetric Assay
The following protocol uses the MTT colorimetric assay as a classic literature-established method for assessing cell viability/metabolic activity in cultured mammalian cells. MTT[3-(4,5-dimethylthiazol-2-yl)-2,5-diphenyltetrazolium bromide] is reduced by metabolically active cells to a colored formazan product; the amount of formazan is quantified spectrophotometrically and provides an indirect measure of metabolically active viable cells. Importantly, MTT reduction reflects cellular oxidoreductase/metabolic activity rather than an absolute direct count of living cells, so changes in cellular metabolism can alter the signal independently of cell number.
-
EdU Incorporation Assay (Click Chemistry-Based DNA Synthesis Measurement)
The EdU incorporation assay measures DNA synthesis by adding the thymidine analog 5-ethynyl-2′-deoxyuridine to cells or tissues, where it is incorporated into newly synthesized DNA during S phase. Incorporated EdU is detected by copper-catalyzed azide-alkyne cycloaddition, in which a fluorescent azide covalently reacts with the ethynyl group on EdU, allowing S-phase cells to be detected by fluorescence microscopy, flow cytometry, or high-content imaging. EdU detection does not require DNA denaturation or anti-BrdU antibody access, which preserves sample structure and improves compatibility with immunostaining and multiparameter cytometry compared with BrdU-based detection. EdU can be cytotoxic in a cell-type- and exposure-dependent manner, so pulse duration, concentration, and continuous-labeling designs should be validated for each cell type.
-
Ki-67 Immunostaining Proliferation Assay
Ki-67 immunostaining measures the growth fraction of a cell population by detecting Ki-67, a nuclear antigen present in proliferating cells and absent in quiescent G0 cells. The readout is the percentage of Ki-67-positive nuclei among total counted cells, commonly called the Ki-67 labeling index or proliferation index.
-
PCNA Immunodetection Proliferation Assay
PCNA immunodetection measures proliferative activity by detecting proliferating cell nuclear antigen, a nuclear protein associated with DNA polymerase δ function and DNA replication. The assay readout is the proportion of PCNA-positive nuclei among total counted cells, but PCNA labeling is not identical to BrdU labeling because PCNA can mark late G1/early S-associated replication competence and may persist beyond active DNA synthesis depending on fixation and extraction conditions.
-
Protocol for Cell Counting and Cell Density Analysis
Cell counting and cell-density analysis estimate the number of cells in a known volume or field area. Manual hemocytometer counting uses a chamber of defined geometry to convert counted cells into cells/mL, while automated counters and image-analysis workflows detect cell objects from optical, brightfield, fluorescence, impedance, or digital-image features. Trypan blue viability counting is based on dye exclusion: viable cells with intact membranes exclude dye, while non-viable cells with compromised membranes stain blue. The readout is total cell density, viable-cell density, dead-cell density, and percent viability. Cell density can also be estimated from microscopy images by counting objects per image area, from flow cytometry using calibrated volume or reference particles, or from in situ microscopy in bioreactors after calibration against reference methods such as hemocytometer or flow cytometry.
-
Patient-Derived Xenograft (PDX)
Patient-derived xenograft (PDX) models are generated by engrafting primary human tumor tissue directly into immunodeficient mice, allowing in vivo propagation of patient tumor biology without initial in vitro adaptation. These models are used to preserve key histopathological and molecular characteristics of the original tumor and enable assessment of tumor growth dynamics and therapeutic response in a living organism. The biological readout is tumor engraftment and subsequent growth in the murine host, which reflects the ability of human tumor cells to survive, vascularize, and expand in an immunocompromised microenvironment.
-
Subcutaneous Cell-Line-Derived Xenograft
Subcutaneous cell-line-derived xenograft (CDX) models are established by implanting cultured human cancer cell lines into immunodeficient mice, where the injected cells form localized tumors that can be monitored in vivo as a measure of tumorigenic potential, growth kinetics, and treatment response. These models are widely used in oncology research because they allow reproducible tumor formation and enable comparative assessment of tumor growth between different cell lines or genetic manipulations in a controlled in vivo microenvironment. Subcutaneous implantation of cancer cells in immunodeficient mice is a standard approach for evaluating tumor growth behavior and therapeutic response across multiple cancer types, including prostate, esophageal, pancreatic, and colon cancer models.
-
Orthotopic Cell-Line Xenograft
Orthotopic cell-line xenograft models involve implantation of human cancer cell lines into the anatomically corresponding organ of immunodeficient mice to reproduce tumor growth within a native microenvironment, enabling more clinically relevant tumor behavior compared with subcutaneous models. These models are widely used because orthotopic placement better recapitulates tumor progression, including invasion and metastatic spread, which are often underrepresented in heterotopic implantation systems. Compared with conventional xenografts, orthotopic implantation is described as more technically complex but provides improved simulation of tumor-microenvironment interactions and metastatic behavior, making it particularly valuable for translational oncology research. Surgical orthotopic implantation approaches have been emphasized as enabling faithful reproduction of clinical cancer features, including metastasis and disease progression patterns that align with the tumor’s organ of origi


Purity & Documentation
References
[1]. Chen P, et al. Cephaeline promotes ferroptosis by targeting NRF2 to exert anti-lung cancer efficacy. Pharmaceutical biology. 2024 Dec;62(1):195-206. [Content Brief]
[2]. Li X, et al. Cephaeline promotes ferroptosis in breast cancer via p53/SLC7A11/GPX4 axis. Daru : journal of Faculty of Pharmacy, Tehran University of Medical Sciences. 2026 Jun 19;34(2):38. [Content Brief]
[3]. Ren PX, et al. A multi-targeting drug design strategy for identifying potent anti-SARS-CoV-2 inhibitors. Acta pharmacologica Sinica. 2022 Feb;43(2):483-493. [Content Brief]
[4]. Silva LC, et al. Cephaeline is an inductor of histone H3 acetylation and inhibitor of mucoepidermoid carcinoma cancer stem cells. Journal of oral pathology & medicine : official publication of the International Association of Oral Pathologists and the American Academy of Oral Pathology. 2022 Jul;51(6):553-562. [Content Brief]

Calculators
Concentration (start) × Volume (start) = Concentration (final) × Volume (final)


Cephaeline dihydrobromide Related Classifications
HY-N4118A Related Classifications
 Powered by Bioz
Keywords
- Cephaeline dihydrobromide
- 6014-81-9
- (-)-Cephaeline dihydrobromide
- NSC 32944 dihydrobromide
- Reactive Oxygen Species (ROS)
- SARS-CoV
- Ferroptosis
- MDM-2/p53
- Keap1-Nrf2
- Glutathione Peroxidase
- Flavivirus
- SLC7A11
- human 80S ribosome
- breast cancer
- ferroptosis
- ULK3
- p53
- SARS-CoV-2 N protein
- SARS-CoV-2 RdRp
- NRF2
- GPX4
- Inhibitor
- inhibitor
- inhibit