
KGP591
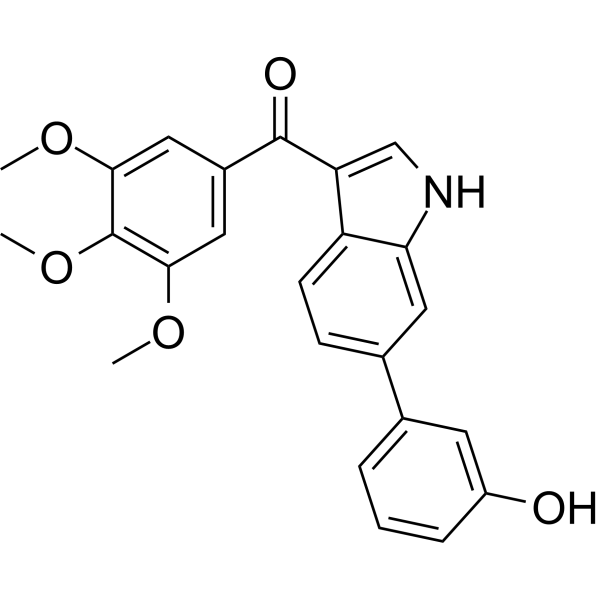
KGP591 is a tubulin polymerization inhibitor (IC50 0.57 µM). KGP591 induces significant G2/M stagnation, inhibits cell migration, disrupts microtubule structure and cell morphology in MDA-MB-231 cells. KGP591 shows antitumor activity in orthotopic model of kidney cancer (RENCA).
For research use only. We do not sell to patients.
- CAS No.: 3018962-69-8
- Formula: C24H21NO5
- Molecular Weight:403.43
-
Storage:
Please store the product under the recommended conditions in the Certificate of Analysis.
Biological Activity
Description
Cellular Effect
|
Cell Line
|
Type | Value | Description | References |
|---|---|---|---|---|
| MCF7 | GI50 |
320 nM
Compound: KGP591
|
Cytotoxicity against human MCF7 cells assessed as cell growth inhibition incubated for 96 hrs by SRB assay
|
[PMID: 37984295] |
| MDA-MB-231 | GI50 |
102 nM
Compound: KGP591
|
Cytotoxicity against human MDA-MB-231 cells assessed as cell growth inhibition incubated for 96 hrs by SRB assay
|
[PMID: 37984295] |
In Vitro
KGP591 (100 nM, 72 h) inhibits migration and proliferation in MDA-MB-231 cells [1]>.
KGP591 (100 nM, 30 min) induces microtubule disruption in MDA-MB-231 cells[1].
KGP591 (200 nM, 48 h) shows G2/M cell cycle arrest in MDA-MB-231 cells[1].
MedChemExpress (MCE) has not independently confirmed the accuracy of these methods. They are for reference only. Further protocols information, click here.
-
Cell Line:MDA-MB-231 cells
-
Concentration:100 nM
-
Incubation Time:72 h
-
Result:Decreased in wound width in cells and remained largely open.
-
Cell Line:MDA-MB-231 cells
-
Concentration:200 nM
-
Incubation Time:48 h
-
Result:Had an arrest of MDA-MB-231 cells at G2/M of the cell cycle.
In Vivo
MedChemExpress (MCE) has not independently confirmed the accuracy of these methods. They are for reference only.
-
Animal Model:RENCA-luc xenograft in BALB/c mice[1]
-
Dosage:150 mg/kg
-
Administration:Subcutaneous Injection
-
Result:Caused significant reduction of Bio-Layer Interferometry (BLI) signal occurred within 2.5 h.
Showed necrosis and severe hemorrhage in RENCA tumor tissue.
Chemical Information
-
CAS No. 3018962-69-8
-
Molecular Weight 403.43
-
Formula C24H21NO5
-
SMILES
COC1=CC(C(C2=CNC3=CC(C4=CC=CC(O)=C4)=CC=C23)=O)=CC(OC)=C1OC
-
Shipping
Room temperature in continental US; may vary elsewhere.
-
Storage
Please store the product under the recommended conditions in the Certificate of Analysis.
Solvent & Solubility
In Vivo:
The following protocol is derived from the literature and is for reference only. It is recommended to first try a small sample.
In Vivo Dissolution Calculator
Please enter the basic information of animal experiments:
-
-
-
-
Recommended: Prepare an additional quantity of animals to account for potential losses during experiments.
Working solution concentration: 0.22 mg/mL
Protocols
-
Scratch/Wound-Healing Migration Assay
The scratch/wound-healing migration assay measures collective migration of adherent cells into an experimentally created cell-free gap in a confluent monolayer. The readout is generated by imaging the gap immediately after scratching and at later time points, then quantifying reduction in wound area, wound width, or percentage closure as cells move into the denuded region. Gap closure reflects cell migration but may also include cell proliferation, so interpretation should distinguish migration-focused conditions from proliferation-driven closure when possible, such as by using short assay windows, serum-controlled conditions, cell counting, or proliferation controls reported in published protocols.
-
Cell migration
Cell migration is a method that plays an important role in wound healing, cell differentiation, embryonic development, etc.
-
Neural Crest/Neuronal Cell Migration Explant Assay
Neural crest (NC) and neuronal cell migration explant assays are in vitro systems in which neural tube-derived tissues are cultured to allow premigratory or newly emigrated neural crest cells to undergo epithelial-to-mesenchymal transition (EMT), migrate away from the explant, and form a measurable radial outgrowth that reflects migratory capacity and environmental responsiveness. These assays typically quantify migration by measuring the expansion of cell outgrowth from neural tube or neural plate border explants over time, often comparing early and later timepoints to derive a migration index such as a radius ratio, which reflects net cell dispersal from the explant core. Neural tube explant cultures preserve key aspects of neural crest behavior, including EMT, migration, and early differentiation, making them suitable for assessing intrinsic migratory ability and extrinsic cue dependence. However, studies emphasize that migratory outgrowth from neural tube explants may include non-n
-
Protocol for Cell Cycle
Cell-cycle analysis by flow cytometry measures DNA content in single cells to estimate the fraction of cells in G0/G1, S, and G2/M phases. Propidium iodide intercalates into DNA, and after RNA removal with RNase, fluorescence intensity reflects cellular DNA content: 2N cells are assigned to G0/G1, cells between 2N and 4N to S phase, and 4N cells to G2/M. DNA-content analysis alone cannot reliably separate G0 from G1 or G2 from M. Ki-67 can distinguish quiescent G0 cells from cycling cells, EdU or BrdU incorporation marks active DNA synthesis in S phase, and phospho-histone H3 staining identifies mitotic cells within the 4N population.
-
Cell Cytotoxicity Assay
Cytotoxicity assays are usually based on the assessment of cell membrane damage, which can also be indirectly detected by measuring cell viability. Detection methods include MTT assay, CKK-8 assay, LDH assay and ATP assay, etc.
-
Flow cytometric DNA-content cell-cycle staining
Flow cytometric DNA-content cell-cycle staining measures the fluorescence intensity of DNA-bound fluorochromes in single cells or nuclei to estimate DNA content distributions, allowing assignment of populations to G0/G1, S, and G2/M phases by DNA histogram deconvolution. Propidium iodide (PI) intercalates into DNA, and PI fluorescence is proportional to cellular DNA content when staining is performed under conditions that make DNA accessible and minimize non-DNA signal. Cells with G2/M DNA content are expected to show approximately twice the fluorescence intensity of G0/G1 cells, while S-phase cells occupy intermediate fluorescence values. PI-based DNA-content analysis can also detect cells with fractional DNA content, often reported as sub-G1, when DNA fragmentation and extraction during staining reduce retained DNA signal in apoptotic cells. DAPI is an alternative DNA fluorochrome for univariate DNA-content analysis, while bivariate approaches combining DNA content with proliferation
-
Chemotaxis Gradient Chamber Assay 1
The chemotaxis gradient chamber assay is based on the principle of observing directional cell migration in response to a stable, linear or quasi-linear concentration gradient of a chemoattractant formed between two fluid reservoirs separated by a narrow observation chamber. Cells placed within the chamber respond to the gradient by polarized movement toward higher chemoattractant concentrations, allowing quantification of chemotactic behavior in real time under microscopy. The classic Zigmond chamber design enables simultaneous visualization of gradient formation and individual cell trajectories, making it suitable for studying leukocyte chemotaxis and other motile cell types in vitro.
-
Under-Agarose Cell Migration Assay
The under-agarose cell migration assay is a classical in vitro chemotaxis method designed to evaluate directed cell movement through a semi-solid agarose matrix toward soluble chemoattractant gradients, enabling visualization and quantification of leukocyte or motile cell migration in a confined 2D-like environment. In this system, cells and chemoattractants are placed in separate wells cut into an agarose gel, allowing diffusion-driven gradient formation that guides directional migration, which is typically assessed by measuring migration distance, cell morphology changes, and accumulation toward the chemoattractant source. This assay has been widely used to study neutrophil and leukocyte chemotaxis as a simple alternative to filter-based migration systems and allows direct microscopic observation of migrating cells under near-physiological confinement conditions.
-
Transwell/Boyden Chamber Migration Assay
The Transwell/Boyden chamber migration assay measures cell movement through a porous membrane separating an upper and lower chamber, usually after a chemoattractant gradient is established by placing cells in the upper chamber and chemoattractant-containing medium in the lower chamber. The readout is generated by quantifying cells that traverse the membrane and appear on the lower membrane surface or in the lower chamber, depending on whether the cell type is adherent or non-adherent. This assay reflects chemotactic or haptotactic migration rather than matrix invasion unless an extracellular-matrix barrier is added to the membrane.
-
3D Collagen/Hydrogel Matrix Migration Assay
The 3D collagen/hydrogel matrix migration assay is based on embedding cells within or on top of a fibrillar collagen type I-rich three-dimensional matrix to model in vivo-like extracellular matrix (ECM) architecture, enabling analysis of cell migration through a physically and biochemically relevant scaffold. In contrast to 2D migration systems, cells in 3D matrices interact with fibrillar collagen networks, requiring coordinated adhesion remodeling and proteolytic or non-proteolytic deformation mechanisms to move through confined spaces, thereby providing a more physiologically relevant readout of invasive and migratory behavior in tissue-like environments. Cell movement in 3D collagen matrices is typically quantified by tracking single-cell trajectories, invasion depth, or matrix penetration over time, reflecting combined effects of cytoskeletal dynamics, cell-ECM adhesion turnover, and ECM remodeling. These systems are widely used to study tumor cell invasion and stromal cell motili
-
Subcutaneous Cell-Line-Derived Xenograft
Subcutaneous cell-line-derived xenograft (CDX) models are established by implanting cultured human cancer cell lines into immunodeficient mice, where the injected cells form localized tumors that can be monitored in vivo as a measure of tumorigenic potential, growth kinetics, and treatment response. These models are widely used in oncology research because they allow reproducible tumor formation and enable comparative assessment of tumor growth between different cell lines or genetic manipulations in a controlled in vivo microenvironment. Subcutaneous implantation of cancer cells in immunodeficient mice is a standard approach for evaluating tumor growth behavior and therapeutic response across multiple cancer types, including prostate, esophageal, pancreatic, and colon cancer models.
-
Cell-Exclusion Zone Migration Assay
The Cell-Exclusion Zone (CEZ) migration assay is an in vitro 2D cell migration method in which a defined cell-free area is created using removable physical barriers such as silicone stoppers, allowing cells to be seeded around the barrier and subsequently migrate into the cleared zone after barrier removal. This approach enables quantification of collective cell migration by monitoring repopulation of the initially cell-free region over time using microscopy-based imaging. Compared with scratch-based wound healing assays, barrier-based exclusion methods are designed to avoid mechanical damage to the extracellular matrix and reduce injury-induced effects on boundary cells, thereby improving interpretability of migration behavior in vitro. The assay readout is typically the progressive reduction in the cell-free area or the number of cells invading the exclusion zone, reflecting coordinated cell motility relevant to physiological processes such as wound healing, epithelial repair, and ca
-
Chemotaxis Gradient Chamber Assay 2
Chemotaxis gradient chamber assays measure directional cell migration in response to a soluble chemical gradient by imaging cells as they move across a defined observation region; the readout is generated from time-lapse cell trajectories, displacement toward the gradient, forward migration index, trajectory plots, rose/polar plots, and statistical tests of non-random directionality. The Dunn chamber is a direct-viewing glass chamber in which cells migrate across a bridge between control and chemoattractant wells, allowing observation of cells in a linear concentration gradient; related direct-viewing formats include the Insall chamber, which supports defined unidirectional gradients and high numerical-aperture microscopy, and the μ-Slide Chemotaxis chamber, which supports long-term live-cell imaging and gradient characterization with fluorescent dye.
Purity & Documentation
References
Calculators
Concentration (start) × Volume (start) = Concentration (final) × Volume (final)

