



pan-KRAS-IN-5
Based on 2 publication(s) in Google Scholar
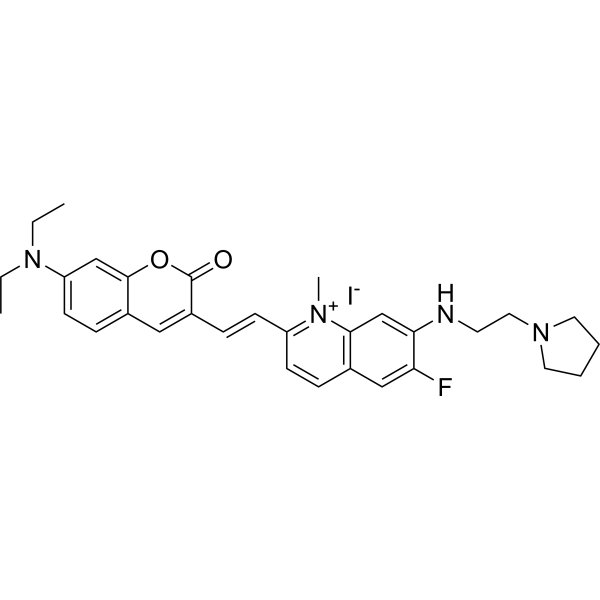
pan-KRAS-IN-5 is a pan-KRAS translation inhibitor by targeting 5′-UTR RNA G-quadruplexes (rG4s). pan-KRAS-IN-5 strongly binds to and stabilizes KRAS rG4s, inhibits KRAS translation, and blocks the MAPK and PI3K-AKT pathways. pan-KRAS-IN-5 induces cell cycle arrest, prompts apoptosis in KRAS-driven cancer cells. pan-KRAS-IN-5 inhibits tumor growth and KRAS expression in KRAS-mutant xenograft. KRAS-IN-5 can be used for KRAS-driven cancer research.
For research use only. We do not sell to patients.
- Purity : 96.70%
- CAS No.: 3027172-23-9
- Formula: C31H36FIN4O2
- Molecular Weight:642.55
-
Storage:
4°C, protect from light, stored under nitrogen
* In solvent : -80°C, 6 months; -20°C, 1 month (protect from light, stored under nitrogen)

To place orders, for customer services and technical support, please contact: MedChemExpress USA
Tel: 609-228-6898 E-mail: [email protected] [email protected]


-
 Biological Activity
-
Chemical Information
-
Solvent & Solubility
- Protocols
- Purity & Documentation
- References
-
 Help & FAQs


Publications Citing Use of MedChemExpress (MCE) pan-KRAS-IN-5
More

Biological Activity
Description
Cellular Effect
|
Cell Line

|
Type | Value | Description | References |
|---|---|---|---|---|
| HCT-116 | IC50 |
4 μM
Compound: 15a
|
Cytotoxicity against human HCT-116 cells harboring KRAS G13D mutant assessed as cell growth inhibition incubated for 24 hrs by MTT assay
Cytotoxicity against human HCT-116 cells harboring KRAS G13D mutant assessed as cell growth inhibition incubated for 24 hrs by MTT assay
|
[PMID: 38272464] |
| HFL1 | IC50 |
>40 μM
Compound: 15a
|
Cytotoxicity against human HFL1 cells harboring wild-type KRAS assessed as cell growth inhibition incubated for 24 hrs by MTT assay
Cytotoxicity against human HFL1 cells harboring wild-type KRAS assessed as cell growth inhibition incubated for 24 hrs by MTT assay
|
[PMID: 38272464] |
| HPAF-II | IC50 |
5.4 μM
Compound: 15a
|
Cytotoxicity against human HPAF-II cells harboring KRAS G12D mutant assessed as cell growth inhibition incubated for 24 hrs by MTT assay
Cytotoxicity against human HPAF-II cells harboring KRAS G12D mutant assessed as cell growth inhibition incubated for 24 hrs by MTT assay
|
[PMID: 38272464] |
| LX-2 | IC50 |
>40 μM
Compound: 15a
|
Cytotoxicity against human LX2 cells harboring wild-type KRAS assessed as cell growth inhibition incubated for 24 hrs by MTT assay
Cytotoxicity against human LX2 cells harboring wild-type KRAS assessed as cell growth inhibition incubated for 24 hrs by MTT assay
|
[PMID: 38272464] |
| MIA PaCa-2 | IC50 |
33 μM
Compound: 15a
|
Cytotoxicity against human MIA PaCa-2 cells harboring KRAS G12C mutant assessed as cell growth inhibition incubated for 24 hrs by MTT assay
Cytotoxicity against human MIA PaCa-2 cells harboring KRAS G12C mutant assessed as cell growth inhibition incubated for 24 hrs by MTT assay
|
[PMID: 38272464] |
| NCI-H358 | IC50 |
4.8 μM
Compound: 15a
|
Cytotoxicity against human NCI-H358 cells harboring KRAS G12C mutant assessed as cell growth inhibition incubated for 24 hrs by MTT assay
Cytotoxicity against human NCI-H358 cells harboring KRAS G12C mutant assessed as cell growth inhibition incubated for 24 hrs by MTT assay
|
[PMID: 38272464] |
| NCM460 | IC50 |
>40 μM
Compound: 15a
|
Cytotoxicity against human NCM460 cells harboring wild-type KRAS assessed as cell growth inhibition incubated for 24 hrs by MTT assay
Cytotoxicity against human NCM460 cells harboring wild-type KRAS assessed as cell growth inhibition incubated for 24 hrs by MTT assay
|
[PMID: 38272464] |
| PANC-1 | IC50 |
>40 μM
Compound: 15a
|
Cytotoxicity against human PANC-1 cells harboring wild-type KRAS assessed as cell growth inhibition incubated for 24 hrs by MTT assay
Cytotoxicity against human PANC-1 cells harboring wild-type KRAS assessed as cell growth inhibition incubated for 24 hrs by MTT assay
|
[PMID: 38272464] |
| PANC-1 | IC50 |
5.6 μM
Compound: 15a
|
Cytotoxicity against human PANC-1 cells harboring KRAS G12D mutant assessed as cell growth inhibition incubated for 24 hrs by MTT assay
Cytotoxicity against human PANC-1 cells harboring KRAS G12D mutant assessed as cell growth inhibition incubated for 24 hrs by MTT assay
|
[PMID: 38272464] |
| SW-620 | IC50 |
5.1 μM
Compound: 15a
|
Cytotoxicity against human SW620 cells harboring KRAS G12V mutant assessed as cell growth inhibition incubated for 24 hrs by MTT assay
Cytotoxicity against human SW620 cells harboring KRAS G12V mutant assessed as cell growth inhibition incubated for 24 hrs by MTT assay
|
[PMID: 38272464] |
| U-87MG ATCC | IC50 |
>40 μM
Compound: 15a
|
Cytotoxicity against human U-87 MG cells harboring wild-type KRAS assessed as cell growth inhibition incubated for 24 hrs by MTT assay
Cytotoxicity against human U-87 MG cells harboring wild-type KRAS assessed as cell growth inhibition incubated for 24 hrs by MTT assay
|
[PMID: 38272464] |
In Vitro
pan-KRAS-IN-5 (compound 15a) strongly binds to KRAS rG4s with KD values of 2.3 μM for utr-z and 0.9 μM for utr-1[1].
pan-KRAS-IN-5 (24 h) selectively kills KRAS-driven cancer cells, including MIA PaCa-2 (IC50 = 3.3 μM), PANC-1 (IC50 = 5.6 μM), HPAF-II (IC50 = 5.4 μM), SW620 (IC50 = 5.1 μM), HCT116 (IC50 = 4.0 μM), and NCI-H358 cells (IC50 = 4.8 μM), but shows no appreciable cytotoxicity in KRASWT glioblastoma cells or KRASWT normal cells[1].
Pan-KRAS-IN-5 (1.25-5.0 μM, 0-48 h) inhibits KRAS protein expression in PANC-1, MIA PaCa-2, and NCI-H358 cells without altering KRAS mRNA levels[1].
pan-KRAS-IN-5 (1.25-5.0 μM, 0-24 h) dose- and time-dependently inhibits the phosphorylation of MEK, ERK, AKT, and mTOR[1].
pan-KRAS-IN-5 (0.32-1.25 μM, 10 days) inhibits the proliferation of MIA PaCa-2 cells[1].
pan-KRAS-IN-5 (1.25-5.0 μM, 24 h) triggers a dose-dependent G2/M phase arrest in MIA PaCa-2 cells, and induces the cleavage of caspase 3 in KRAS mutant MIA PaCa-2 cancer[1].
MedChemExpress (MCE) has not independently confirmed the accuracy of these methods. They are for reference only.
-
Cell Line:MIA PaCa-2 cells
-
Concentration:1.25, 2.5, and 5.0 μM
-
Incubation Time:24 h
-
Result:Decreased Caspase-3 and increased CL- Caspase-3 leves in MIA PaCa-2 cells.
-
Cell Line:MIA PaCa-2 cells
-
Concentration:1.25, 2.5, and 5.0 μM
-
Incubation Time:24 h
-
Result:Induced G2/M phase arrest in MIA PaCa-2 cells dose-dependently.
-
Cell Line:MIA PaCa-2 cells
-
Concentration:0.32, 0.63, and 1.25 μM
-
Incubation Time:10 days
-
Result:Almost completely inhibited the proliferation of MIA PaCa-2 cells at the concentration of 1.25 μM.
-
Cell Line:MIA PaCa-2 cells
-
Concentration:1.25, 2.5, and 5.0 μM
-
Incubation Time:0, 6, 12, and 24 h
-
Result:Reduced p-MEK, p-ERK, p-AKT and p-mTOR in MIA PaCa-2 cells in a dose-dependent manner.
Decreased p-MEK, p-ERK, p-AKT and p-mTOR in MIA PaCa-2 cells in a time-dependent manner.
In Vivo
MedChemExpress (MCE) has not independently confirmed the accuracy of these methods. They are for reference only.
-
Animal Model:Male BALB/C-nu/nu (4 weeks old) subcutaneously injected with MIA PaCa-2 cells[1]
-
Dosage:2.5 and 5.0 mg/kg
-
Administration:i.p., every day for 18 days
-
Result:Inhibited tumor growth in a dose-dependent manner, with Tumor Growth Inhibition (TGI) of 62.0 % (2.5 mg/ kg) and 70.3 % (5.0 mg/kg).
Revealed no significant body weight loss in mice.
Exhibited no evident signs of toxicity in the anatomized viscera.
- RNA extraction experimental
- Annexin V plus membrane-impermeant dye apoptosis staining
- BrdU Incorporation Assay
- Patient-Derived Orthotopic Xenograft (PDOX)
- Protocol for Cell Cycle
- Detection of Apoptosis
- TUNEL staining for apoptotic DNA fragmentation
- Flow cytometric DNA-content cell-cycle staining
- Patient-Derived Xenograft (PDX)
- Apoptosis Solutions
- Splenic/Portal-Vein Liver Metastasis Xenograft
- Subcutaneous Cell-Line-Derived Xenograft
- Orthotopic Cell-Line Xenograft
- Intraperitoneal/Peritoneal Dissemination Xenograft


Chemical Information
-
CAS No. 3027172-23-9
-
Appearance Solid
-
Molecular Weight 642.55
-
Formula C31H36FIN4O2
-
Color Brown to reddish brown
-
SMILES
C[N+]1=C(/C=C/C2=CC3=CC=C(N(CC)CC)C=C3OC2=O)C=CC4=C1C=C(NCCN5CCCC5)C(F)=C4.[I-]
-
Shipping
Room temperature in continental US; may vary elsewhere.
-
Storage
4°C, protect from light, stored under nitrogen
* In solvent : -80°C, 6 months; -20°C, 1 month (protect from light, stored under nitrogen)


Publications (2)


Solvent & Solubility
In Vitro:
DMSO : 50 mg/mL (77.81 mM; Need ultrasonic; Hygroscopic DMSO has a significant impact on the solubility of product, please use newly opened DMSO)
Please refer to the solubility information to select the appropriate solvent. Once prepared, please aliquot and store the solution to prevent product inactivation from repeated freeze-thaw cycles.
Storage method and period of stock solution: -80°C, 6 months; -20°C, 1 month (protect from light, stored under nitrogen). When stored at -80°C, please use it within 6 months. When stored at -20°C, please use it within 1 month.
Please refer to the solubility information to select the appropriate solvent. Once prepared, please aliquot and store the solution to prevent product inactivation from repeated freeze-thaw cycles.
Storage method and period of stock solution: -80°C, 6 months; -20°C, 1 month (protect from light, stored under nitrogen). When stored at -80°C, please use it within 6 months. When stored at -20°C, please use it within 1 month.
Concentration (start) × Volume (start) = Concentration (final) × Volume (final)
In Vivo:
Select the appropriate dissolution method based on your experimental animal and administration route.
- For the following dissolution methods, please ensure to first prepare a clear stock solution using an In Vitro approach and then sequentially add co-solvents:
- To ensure reliable experimental results, the clarified stock solution can be appropriately stored based on storage conditions. As for the working solution for In Vivo experiments, it is recommended to prepare freshly and use it on the same day.
- The percentages shown for the solvents indicate their volumetric ratio in the final prepared solution. If precipitation or phase separation occurs during preparation, heat and/or sonication can be used to aid dissolution.
Add each solvent one by one: 10% DMSO 40% PEG300 5% Tween-80 45% Saline
Solubility: ≥ 1.25 mg/mL (1.95 mM); Clear solution
This protocol yields a clear solution of ≥ 1.25 mg/mL (saturation unknown).
Taking 1 mL working solution as an example, add 100 μL DMSO stock solution (12.5 mg/mL) to 400 μL PEG300, and mix evenly; then add 50 μL Tween-80 and mix evenly; then add 450 μL Saline to adjust the volume to 1 mL.
Preparation of Saline: Dissolve 0.9 g sodium chloride in ddH₂O and dilute to 100 mL to obtain a clear Saline solution.
Add each solvent one by one: 10% DMSO 90% (20% SBE-β-CD in Saline)
Solubility: ≥ 1.25 mg/mL (1.95 mM); Clear solution
This protocol yields a clear solution of ≥ 1.25 mg/mL (saturation unknown).
Taking 1 mL working solution as an example, add 100 μL DMSO stock solution (12.5 mg/mL) to 900 μL 20% SBE-β-CD in Saline, and mix evenly.
Preparation of 20% SBE-β-CD in Saline (4°C, storage for one week): 2 g SBE-β-CD powder is dissolved in 10 mL Saline, completely dissolve until clear.
In Vivo Dissolution Calculator
Please enter the basic information of animal experiments:
-
-
-
-
Recommended: Prepare an additional quantity of animals to account for potential losses during experiments.
Please enter your animal formula composition:
-
%DMSO +
Recommended: Keep the proportion of DMSO in working solution below 2% if your animal is weak.
-
%+
-
+%Tween-80 + +
-
%Saline +
The co-solvents required include: DMSO, . All of co-solvents are available by MedChemExpress (MCE). , Tween 80. All of co-solvents are available by MedChemExpress (MCE).
Working solution concentration: 0.22 mg/mL
Method for preparing stock solution: mg drug dissolved in μL DMSO. Stock solution concentration: mg/mL. * In solvent : -80°C, 6 months; -20°C, 1 month (protect from light, stored under nitrogen)
1. Take μL DMSO stock solution;
2. Add μL .
μL , mix evenly;
3. Then add μL Tween 80, mix evenly;
4. Then add μL
Please ensure that the stock solution in the first step is dissolved to a clear state, and add co-solvents in sequence. You can use ultrasonic heating (ultrasonic cleaner, recommended frequency 20-40 kHz), vortexing, etc. to assist dissolution.


Purity & Documentation
-
Data Sheet (277 KB)
-
SDS (251 KB)
- English - EN (251 KB)
- Français - FR (251 KB)
- Deutsch - DE (251 KB)
- Norwegian - NO (251 KB)
- Español - ES (251 KB)
- Swedish - SV (251 KB)
- Italian - IT (251 KB)
- Korean - KR (251 KB)
- Portuguese - PT (251 KB)
-
Handling Instructions (2659 KB)
References


Complete Stock Solution Preparation Table
Please refer to the solubility information to select the appropriate solvent. Once prepared, please aliquot and store the solution to prevent product inactivation from repeated freeze-thaw cycles.
Storage method and period of stock solution: -80°C, 6 months; -20°C, 1 month (protect from light, stored under nitrogen). When stored at -80°C, please use it within 6 months. When stored at -20°C, please use it within 1 month.
| Optional Solvent | Concentration Solvent Mass | 1 mg | 5 mg | 10 mg | 25 mg |
|---|---|---|---|---|---|
| DMSO | 1 mM | 1.5563 mL | 7.7815 mL | 15.5630 mL | 38.9075 mL |
| 5 mM | 0.3113 mL | 1.5563 mL | 3.1126 mL | 7.7815 mL | |
| 10 mM | 0.1556 mL | 0.7781 mL | 1.5563 mL | 3.8907 mL | |
| 15 mM | 0.1038 mL | 0.5188 mL | 1.0375 mL | 2.5938 mL | |
| 20 mM | 0.0778 mL | 0.3891 mL | 0.7781 mL | 1.9454 mL | |
| 25 mM | 0.0623 mL | 0.3113 mL | 0.6225 mL | 1.5563 mL | |
| 30 mM | 0.0519 mL | 0.2594 mL | 0.5188 mL | 1.2969 mL | |
| 40 mM | 0.0389 mL | 0.1945 mL | 0.3891 mL | 0.9727 mL | |
| 50 mM | 0.0311 mL | 0.1556 mL | 0.3113 mL | 0.7781 mL | |
| 60 mM | 0.0259 mL | 0.1297 mL | 0.2594 mL | 0.6485 mL |


pan-KRAS-IN-5 Related Classifications
HY-163299 Related Classifications
 Powered by Bioz