



Phenyl sulfate

Based on 1 Customer Validation
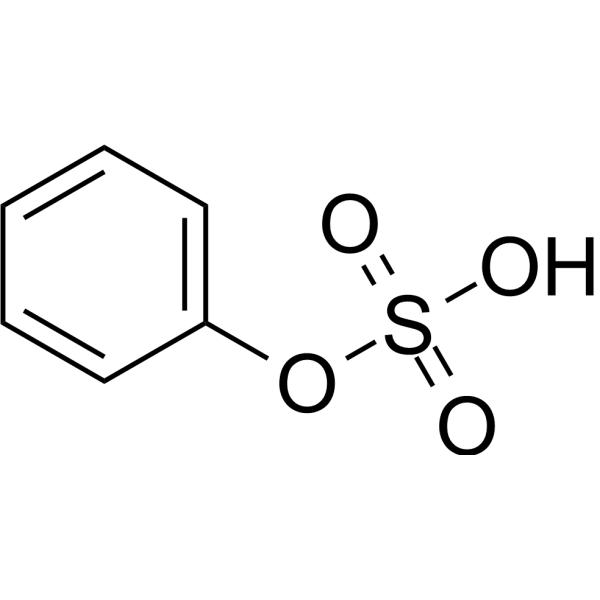
Phenyl sulfate (Phenyl hydrogen sulfate) is an orally active gut microbiota-derived metabolite. Phenyl sulfate undergoes hepatic sulfation via SULT1A1. Phenyl sulfate induces podocyte injury, albuminuria, renal pro-inflammatory and pro-fibrotic effects, cytotoxicity, glutathione depletion, mitochondrial dysfunction, and sensitizes renal tubular cells to oxidative stress. Phenyl sulfate can be used in research on diabetic nephropathy.
For research use only. We do not sell to patients.
- Purity : 99.47%
- CAS No.: 937-34-8
- Formula: C6H6O4S
- Molecular Weight:174.17
-
Storage:Powder -20°C, 3 years , 4°C, 2 years ; In solvent -80°C, 6 months , -20°C, 1 month

To place orders, for customer services and technical support, please contact: MedChemExpress USA
Tel: 609-228-6898 E-mail: [email protected] [email protected]


-
 Biological Activity
-
Chemical Information
-
Solvent & Solubility
- Protocols
- Purity & Documentation
- References
-
 Help & FAQs


-
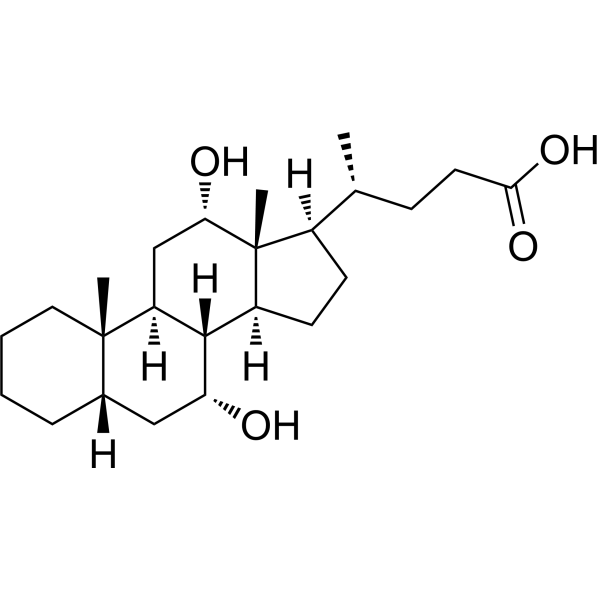
HY-W399297
Isodeoxycholic acidEndogenous Metabolite -
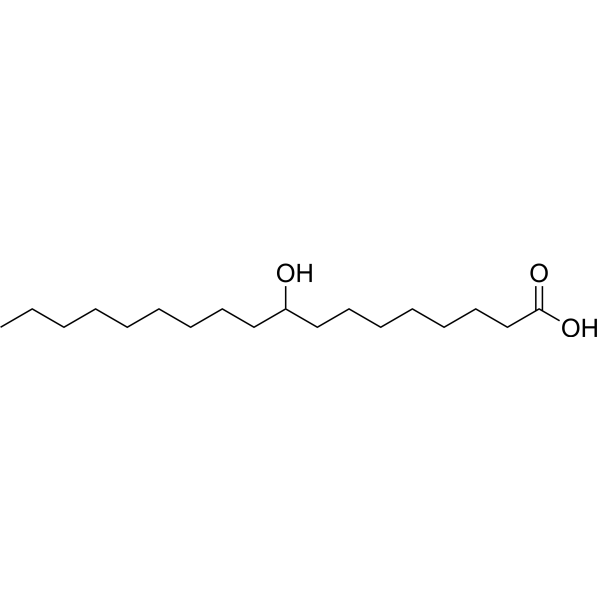
HY-N11692
9-Hydroxyoctadecanoic acidHDAC1 Inhibitor -
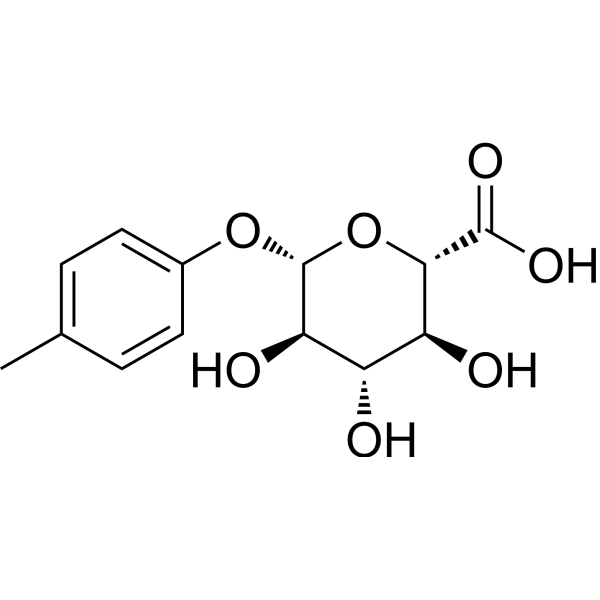
HY-W416250
p-Cresol glucuronideMetabolite of p-Cresol -

HY-128442R
Phenyl sulfate (Standard)Reference Standard -
HY-Y0966S2
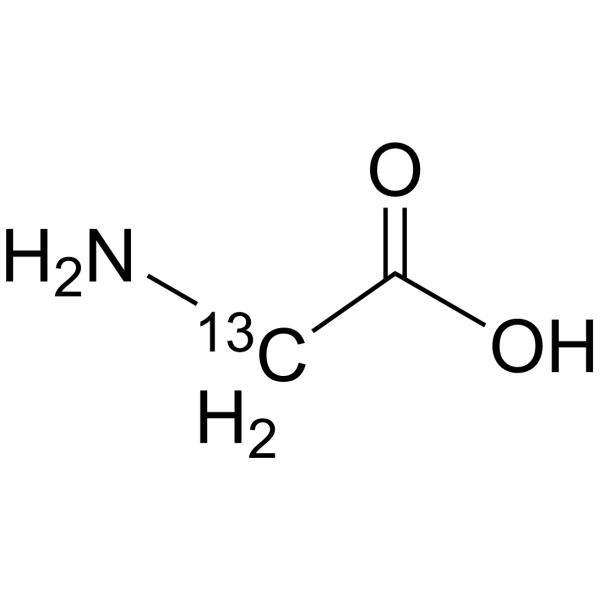
Glycine-2-13CStable Isotope -
HY-113978
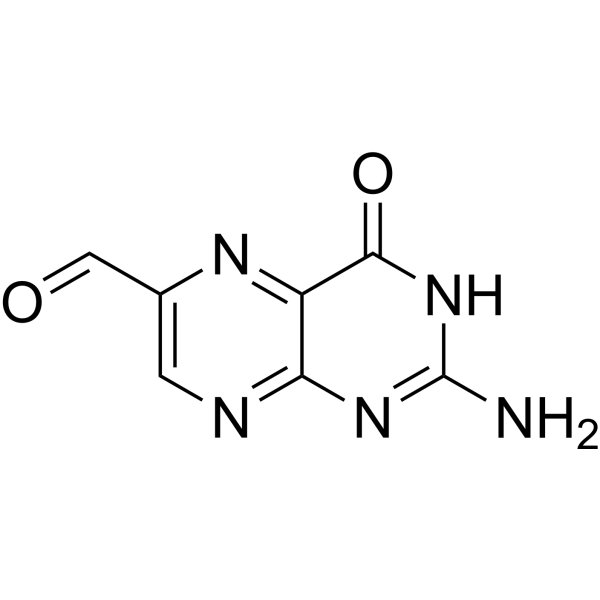
6-FormylpterinXanthine Oxidase Inhibitor -

HY-B1309
MetacetamolAnalog of Acetaminophen -
HY-120731
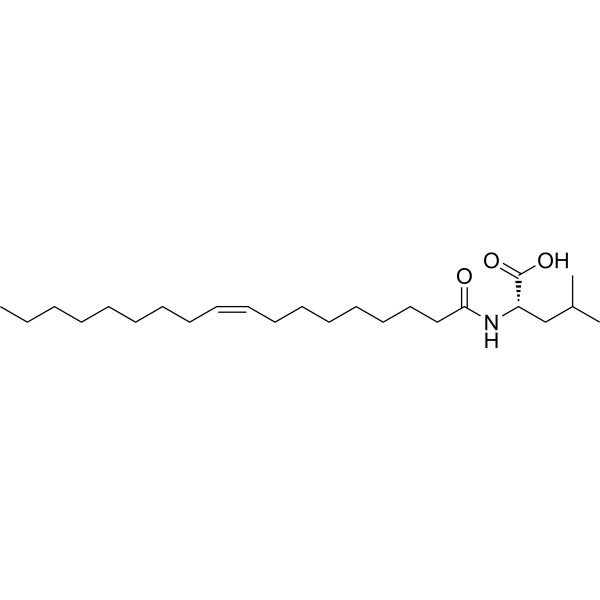
N-Oleoyl leucineleucine derivatives -
HY-N0111S
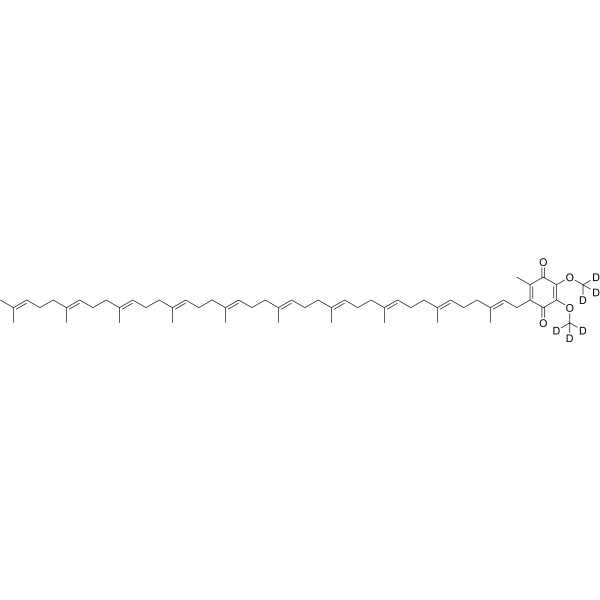
Coenzyme Q10-d6Stable Isotope -

HY-133966
6α-Hydroxy-5α-cholestaneOxysterol -

HY-113978R
6-Formylpterin (Standard)Xanthine Oxidase Inhibitor -
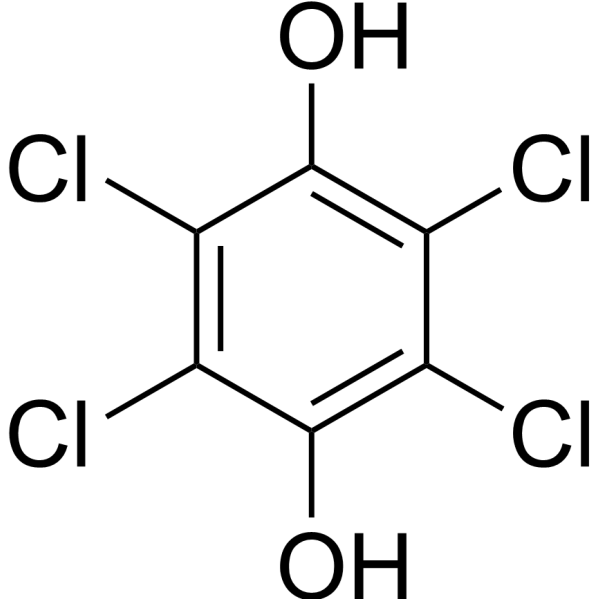
HY-W144308
TetrachlorohydroquinonePentachlorophenol Metabolite
All Endogenous Metabolite Isoforms
More

Biological Activity
Description
In Vitro
Phenyl sulfate (0.2-10 mM; 24 h) decreases total glutathione levels in LLC-PK1 porcine renal tubular epithelial cells in a dose-dependent manner after 24 hours of treatment, with a significant effect observed at 0.2 mM[4].
Phenyl sulfate (0.2-10 mM; 24 h) pretreatment renders LLC-PK1 porcine renal tubular epithelial cells more vulnerable to hydrogen peroxide-induced cell death, with 10 mM Phenyl sulfate increasing the viability reduction from 62% to 94% at 20 μM hydrogen peroxide[4].
Phenyl sulfate (50 μM; 10 min) is transported into human kidney proximal tubule HK-2 cells via SLCO4C1[1].
Phenyl sulfate (10-1000 μM; 72 h) induces dose-dependent cytotoxicity in differentiated human urinary podocyte-like epithelial cells, with significant toxicity at 100 μM after 72 h[1].
MedChemExpress (MCE) has not independently confirmed the accuracy of these methods. They are for reference only.
-
Cell Line:differentiated human urinary podocyte-like epithelial cells (HUPECs)
-
Concentration:10-1000 μM
-
Incubation Time:72 h
-
Result:Exerted toxic effects on differentiated podocytes starting from 30 μM, with statistically significant cell toxicity observed at concentrations from 100 μM.
-
Cell Line:LLC-PK1 porcine renal tubular epithelial cells
-
Concentration:0.2, 0.5, 2, 5, 10 mM (Phenyl sulfate, pre-incubation); 10 μM or 20 μM (hydrogen peroxide)
-
Incubation Time:24 h (Phenyl sulfate pre-incubation); 5 h (hydrogen peroxide); 30 min (CCK-8 reagent)
-
Result:Augmented hydrogen peroxide-induced decreases in cellular viability in a dose-dependent manner as a pretreatment.
Decreased viability by 76%, 81%, 89%, and 94% respectively at 0.5, 2, 5, and 10 mM when combined with 20 μM hydrogen peroxide, compared with a 62% decrease in control cells.
Decreased viability by 51% and 58% respectively at 5 and 10 mM when combined with 10 μM hydrogen peroxide, compared with an 18% decrease in control cells.
Decreased cellular viability by 34% alone at 10 mM.
-
Cell Line:LLC-PK1 porcine renal tubular epithelial cells
-
Concentration:10 mM (Phenyl sulfate, pre-incubation); 20 μM (hydrogen peroxide)
-
Incubation Time:24 h (Phenyl sulfate pre-incubation); 5 h (hydrogen peroxide)
-
Result:Increased the percentage of annexin V-FITC and propidium iodide double-positive cells induced by 20 μM hydrogen peroxide to 40% as a 10 mM pretreatment, compared with 21% in control cells.
In Vivo
Phenyl sulfate (50 mg/kg; p.o.; daily; 6 weeks) increases plasma Phenyl sulfate concentration, induces albuminuria, causes podocyte damage and glomerular basement membrane thickening, and promotes perivascular inflammation and fibrosis in high-fat diet-fed KKAy mice[1].
MedChemExpress (MCE) has not independently confirmed the accuracy of these methods. They are for reference only.
-
Animal Model:db/db mice (strain obtained from CLEA Japan; 11 weeks old at study initiation)[1]
-
Dosage:50 mg/kg
-
Administration:p.o.; daily; 6 weeks
-
Result:Increased plasma Phenyl sulfate level to 27.3 μM, representing a 5-fold increase over the basal level of 3.06 μM.
Did not significantly change plasma concentrations of p-cresyl sulfate, indoxyl sulfate, and trimethylamine N-oxide.
Increased albuminuria.
Induced mesangial expansion that did not reach statistical significance as assessed by light microscopic histological examination.
Increased podocyte foot process effacement and glomerular basement membrane thickening as demonstrated by electron microscopy.
Increased renal expression levels of the inflammatory genes Tnfa and Ccl2, and the fibrotic genes Tgfb1, Fn1, and Col1a1.
-
Animal Model:KKAy mice (strain obtained from CLEA Japan; 6 weeks old at study initiation; fed a high-fat diet)[1]
-
Dosage:50 mg/kg
-
Administration:p.o.; daily; 6 weeks
-
Result:Increased plasma Phenyl sulfate level to 6.09 μM compared with 1.48 μM in untreated high-fat diet-KKAy mice.
Increased albuminuria in high-fat diet-KKAy mice.
Induced podocyte effacement and glomerular basement membrane thickening in the kidneys as revealed by electron micrographs.
Increased perivascular fibrotic areas and macrophage infiltration as shown by Elastica Masson and F4/80 staining.
- Cell Cytotoxicity Assay
- Mammalian live/dead viability and cytotoxicity staining
- ROS/oxidative-stress fluorescent staining
- Mitochondrial membrane-potential and mitochondrial mass staining
- Research Protocol for Microbiome Analysis
- Research Protocol for Inflammation-related Diseases
- Cell Viability Determination by MTT Colorimetric Assay


Chemical Information
-
CAS No. 937-34-8
-
Appearance Solid
-
Molecular Weight 174.17
-
Formula C6H6O4S
-
Color White to off-white
-
SMILES
O=S(OC1=CC=CC=C1)(O)=O
-
Synonyms
Phenyl hydrogen sulfate
-
Structure Classification
-
Initial Source
-
Shipping
Room temperature in continental US; may vary elsewhere.
-
Storage
Powder -20°C 3 years 4°C 2 years In solvent -80°C 6 months -20°C 1 month


Solvent & Solubility
In Vitro:
H2O : ≥ 100 mg/mL (574.15 mM)
* "≥" means soluble, but saturation unknown.
Please refer to the solubility information to select the appropriate solvent. Once prepared, please aliquot and store the solution to prevent product inactivation from repeated freeze-thaw cycles.
Storage method and period of stock solution: -80°C, 6 months; -20°C, 1 month. When stored at -80°C, please use it within 6 months. When stored at -20°C, please use it within 1 month.
* Note: If you choose water as the stock solution, please dilute it to the working solution, then filter and sterilize it with a 0.22 μm filter before use.
Please refer to the solubility information to select the appropriate solvent. Once prepared, please aliquot and store the solution to prevent product inactivation from repeated freeze-thaw cycles.
Storage method and period of stock solution: -80°C, 6 months; -20°C, 1 month. When stored at -80°C, please use it within 6 months. When stored at -20°C, please use it within 1 month.
* Note: If you choose water as the stock solution, please dilute it to the working solution, then filter and sterilize it with a 0.22 μm filter before use.
Concentration (start) × Volume (start) = Concentration (final) × Volume (final)


Purity & Documentation
-
Data Sheet (296 KB)
-
SDS (254 KB)
- English - EN (254 KB)
- Français - FR (254 KB)
- Deutsch - DE (254 KB)
- Norwegian - NO (254 KB)
- Español - ES (254 KB)
- Swedish - SV (254 KB)
- Italian - IT (254 KB)
- Korean - KR (254 KB)
- Portuguese - PT (254 KB)
-
Handling Instructions (2659 KB)
References


Complete Stock Solution Preparation Table
Please refer to the solubility information to select the appropriate solvent. Once prepared, please aliquot and store the solution to prevent product inactivation from repeated freeze-thaw cycles.
Storage method and period of stock solution: -80°C, 6 months; -20°C, 1 month. When stored at -80°C, please use it within 6 months. When stored at -20°C, please use it within 1 month.
| Optional Solvent | Concentration Solvent Mass | 1 mg | 5 mg | 10 mg | 25 mg |
|---|---|---|---|---|---|
| H2O | 1 mM | 5.7415 mL | 28.7076 mL | 57.4152 mL | 143.5379 mL |
| 5 mM | 1.1483 mL | 5.7415 mL | 11.4830 mL | 28.7076 mL | |
| 10 mM | 0.5742 mL | 2.8708 mL | 5.7415 mL | 14.3538 mL | |
| 15 mM | 0.3828 mL | 1.9138 mL | 3.8277 mL | 9.5692 mL | |
| 20 mM | 0.2871 mL | 1.4354 mL | 2.8708 mL | 7.1769 mL | |
| 25 mM | 0.2297 mL | 1.1483 mL | 2.2966 mL | 5.7415 mL | |
| 30 mM | 0.1914 mL | 0.9569 mL | 1.9138 mL | 4.7846 mL | |
| 40 mM | 0.1435 mL | 0.7177 mL | 1.4354 mL | 3.5884 mL | |
| 50 mM | 0.1148 mL | 0.5742 mL | 1.1483 mL | 2.8708 mL | |
| 60 mM | 0.0957 mL | 0.4785 mL | 0.9569 mL | 2.3923 mL | |
| 80 mM | 0.0718 mL | 0.3588 mL | 0.7177 mL | 1.7942 mL | |
| 100 mM | 0.0574 mL | 0.2871 mL | 0.5742 mL | 1.4354 mL |
* Note: If you choose water as the stock solution, please dilute it to the working solution, then filter and sterilize it with a 0.22 μm filter before use.


Phenyl sulfate Related Classifications
HY-128442 Related Classifications
 Powered by Bioz