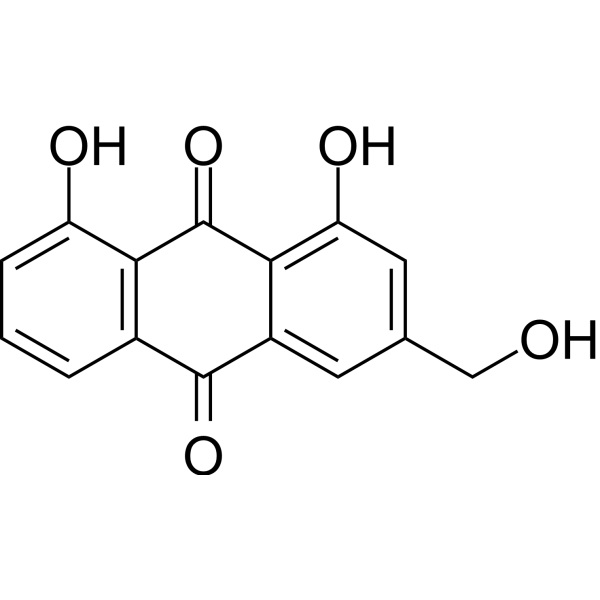
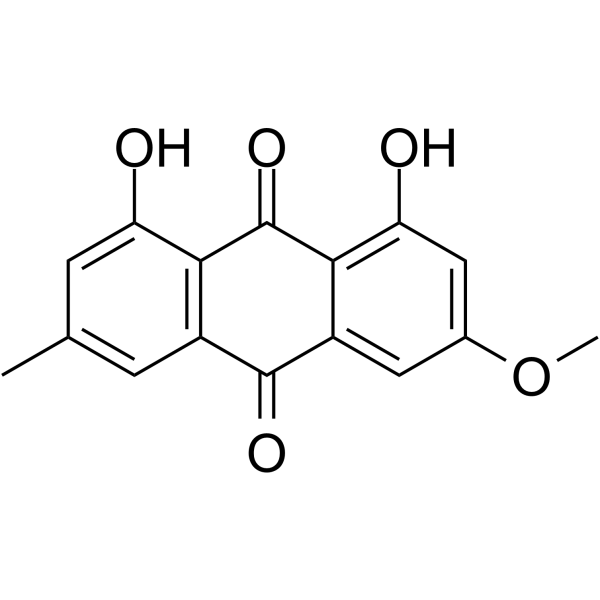
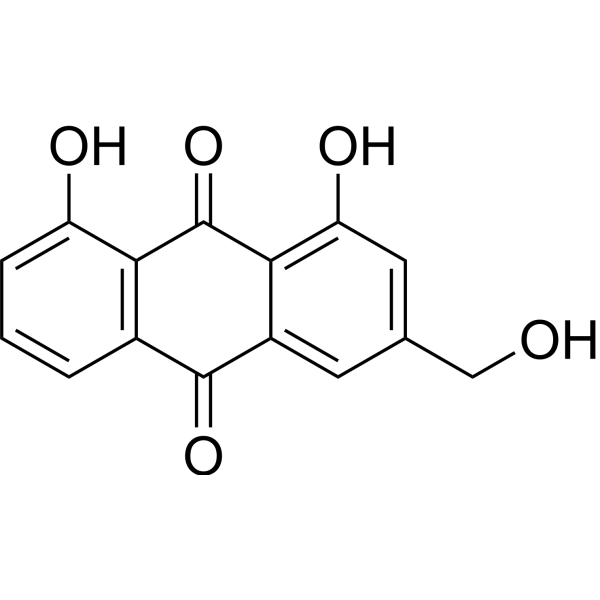
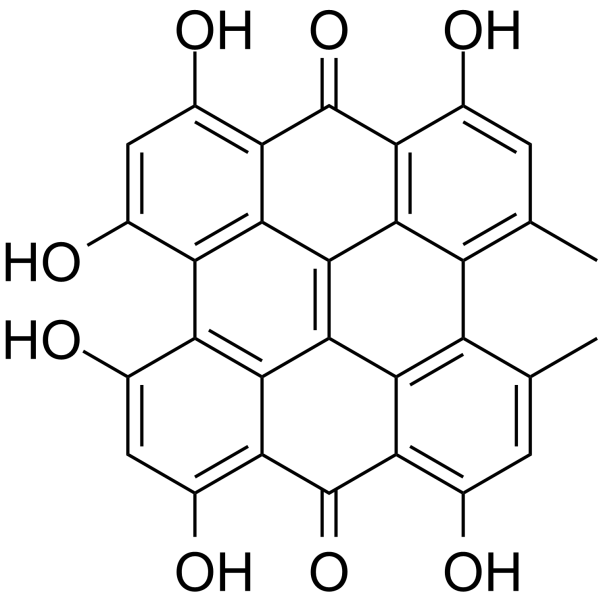
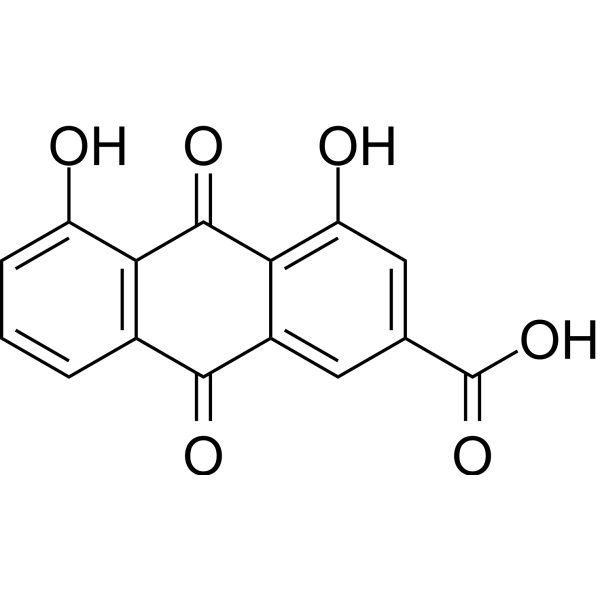
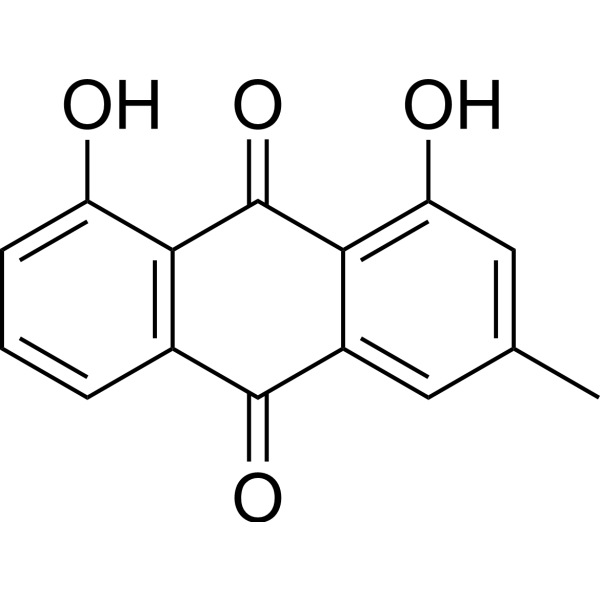
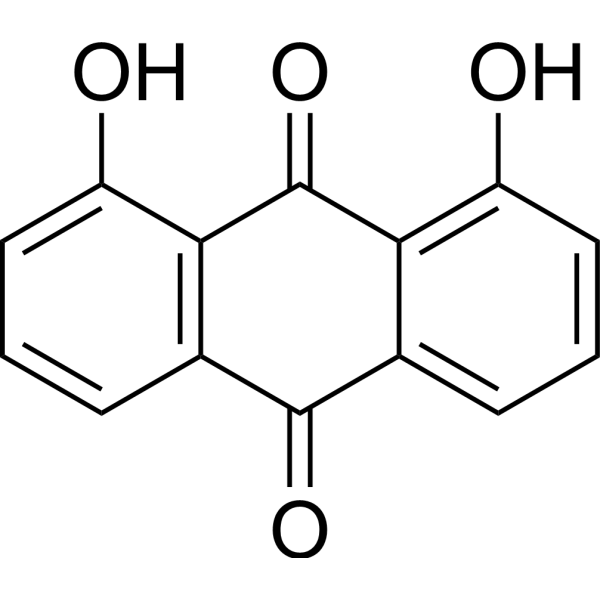
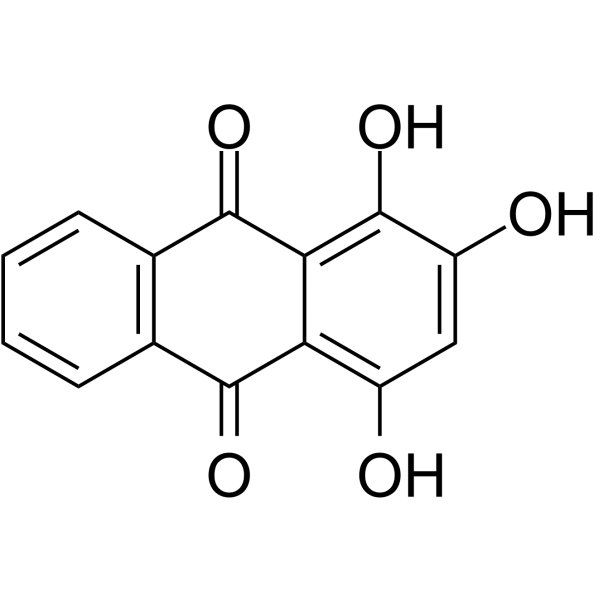
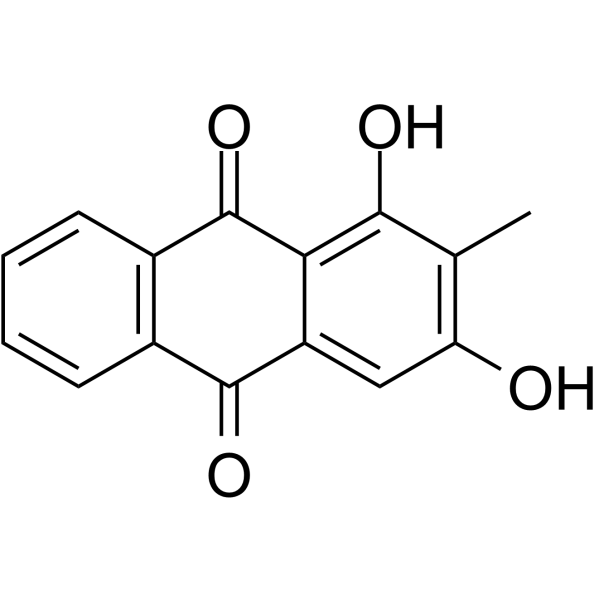
Rubiadin
Based on 1 Customer Validation
Rubiadin is an orally active free radical scavenger that inhibits the activation of the NF-κB pathway. Rubiadin inhibits osteoclast formation, bone resorption, lipid peroxidation, HBV DNA replication and cancer cell proliferation; reduces pro-inflammatory cytokine levels; induces cancer cell apoptosis; and possesses antifungal, antimalarial, antibacterial and anticonvulsant activities. Rubiadin can be used in the research of osteoporosis, acute inflammation, chronic inflammation, carbon tetrachloride-induced liver injury, Alzheimer's disease, breast cancer, iron overload disorders, hepatitis B virus infection, colon cancer, liver cancer, T-lymphocytic leukemia, cervical cancer, diabetic nephropathy, epileptic seizures, fungal infections, malaria and bacterial infections.
Nur für Forschungszwecke. Wir verkaufen nicht an Patienten.
- Reinheit : 99.56%
- CAS. Nr.: 117-02-2
- Formel: C15H10O4
- Molecular Weight:254.24
-
Speicherung:
4°C, protect from light
* In solvent : -80°C, 6 months; -20°C, 1 month (protect from light)
Alle Parasite Isoform-spezifische Produkte anzeigen
More
Biologische Aktivität
Beschreibung
Cellular Effect
|
Cell Line
|
Type | Value | Description | References |
|---|---|---|---|---|
| DU-145 | IC50 |
32 μM
Compound: 10, rubiadin
|
Cytotoxicity against Homo sapiens (human) DU145 cells assessed as inhibition of cell survival after 96 hr by MTT assay
|
10.1007/s00044-012-0197-5 |
| MCF7 | IC50 |
56 μM
Compound: 10, rubiadin
|
Cytotoxicity against Homo sapiens (human) MCF7 cells assessed as inhibition of cell survival after 96 hr by MTT assay
|
10.1007/s00044-012-0197-5 |
| MES-SA | IC50 |
38 μM
Compound: 10, rubiadin
|
Cytotoxicity against Homo sapiens (human) MES-SA cells assessed as inhibition of cell survival after 96 hr by MTT assay
|
10.1007/s00044-012-0197-5 |
| MES-SA/Dx5 | IC50 |
35 μM
Compound: 10, rubiadin
|
Cytotoxicity against Homo sapiens (human) MES-SA/Dx5 cells assessed as inhibition of cell survival after 96 hr by MTT assay
|
10.1007/s00044-012-0197-5 |
| NCI-H460 | IC50 |
42 μM
Compound: 10, rubiadin
|
Cytotoxicity against Homo sapiens (human) H460 cells assessed as inhibition of cell survival after 96 hr by MTT assay
|
10.1007/s00044-012-0197-5 |
In Vitro
Rubiadin (5-20 μM; 3 h pre-incubation, then 24 h continued incubation) protects N2a cells against Aβ1−42-induced cytotoxicity, significantly enhancing cell viability relative to Aβ1−42-only treated cells[4].
Rubiadin (5-20 μM; 3 h pre-incubation, then 24 h continued incubation) suppresses activation of the IKK/IκB/NF-κB pathway in Aβ1-42-induced N2a cells by reducing phosphorylation of key pathway components[4].
Rubiadin (1-100 μM; 24 h post-irradiation) induces light dose-dependent cytotoxicity in MCF-7c3 human breast cancer cells, with an LD50 of 0.66 J/cm2, reducing viability by 76% at 100 μM and 1 J/cm2[5].
Rubiadin (0.4-40 μM; 24 h) does not impair the viability of human HepG2 cells[6].
Rubiadin (0.4-40 μM; 24 h, dose-dependent) and (20 μM; 3-24 h, time-dependent) upregulates hepcidin mRNA and protein expression in human HepG2 cells in both a dose-dependent and time-dependent manner, with maximal 5-fold mRNA upregulation at 20 μM for 24 h[6].
Rubiadin (5, 10, 20, 40 μg/ml; 72 h) dose-dependently inhibits the proliferation of HepG2.2.15 cells with an IC50 of 17 μg/ml, and nontoxic concentrations (<8 μg/ml) support its use in anti-HBV activity assays[7].
Rubiadin (4, 6 μg/ml; 24, 48, 72 h) dose-dependently reduces the secretion of HBsAg, HBeAg, and HBcAg by HepG2.2.15 cells, with particularly potent inhibition of HBeAg and HBcAg at 72 h[7].
Rubiadin inhibits Candida tropicalis biofilm formation and induces oxidative stress under irradiation, and acts synergistically with Amphotericin B against the fungus[8].
Rubiadin inhibits Plasmodium falciparum viability with an IC50 of 13.00 μg/mL, reducing schizont counts in a dose-dependent manner[8].
Rubiadin exhibits moderate experimental DPPH radical scavenging activity in aqueous physiological media (pH 7.4), with an IC50 of 91.00 μM[9].
Rubiadin exhibits moderate experimental ABTS•+ radical scavenging activity in aqueous physiological media (pH 7.4), with an IC50 of 73.44 μM[9].
MedChemExpress (MCE) has not independently confirmed the accuracy of these methods. They are for reference only. Further protocols information, click here.
-
Cell Line:mouse neuroblastoma N2a cells (Aβ1₋42-induced model)
-
Concentration:5 μM; 20 μM
-
Incubation Time:3 h pre-incubation, then 24 h continued incubation
-
Result:Significantly improved cell viability in Aβ1₋42-exposed N2a cells.
-
Cell Line:mouse neuroblastoma N2a cells (Aβ1₋42-induced model)
-
Concentration:5 μM; 20 μM
-
Incubation Time:3 h pre-incubation, then 24 h continued incubation
-
Result:Reduced the expression levels of pro-inflammatory cytokines IL-1β, IL-6, TNF-α. Increased the expression of anti-inflammatory cytokine IL-4. Decreased phosphorylated Tau protein expression in Aβ1₋42-exposed N2a cells.\nSignificantly inhibited the phosphorylation of IKK, IκB, and NF-κB in Aβ1₋42-exposed N2a cells.
-
Cell Line:mouse neuroblastoma N2a cells (Aβ1₋42-induced model)
-
Concentration:5 μM; 20 μM
-
Incubation Time:3 h pre-incubation, then 24 h continued incubation
-
Result:Reversed the increased nuclear overlap of NF-κB and DAPI-labeled nuclei observed in Aβ1₋42-exposed N2a cells. Significantly reduced NF-κB nuclear fluorescence intensity.
-
Cell Line:MCF-7c3 human breast cancer cells
-
Concentration:1, 50, 100 μM
-
Incubation Time:24 h (post-irradiation)
-
Result:Exhibited photochemical activity in a light dose-dependent manner, with an LD50 value at 0.66 J/cm2 light dose and 76% cell killing at 1 J/cm2.
-
Cell Line:human HepG2 cells, ferric ammonium citrate (FAC)-treated human HepG2 cells
-
Concentration:0.4, 4, 8, 20, 40 μM (untreated cells); 20 μM (FAC-pretreated cells)
-
Incubation Time:24 h (untreated cells); 24 h (FAC-pretreated cells)
-
Result:Dose-dependently decreased protein expression of TfR1, Fpn1 and FtL in untreated HepG2 cells, with significant reductions at 20 and 40 μM for TfR1 and Fpn1, and at 8, 20, and 40 μM for FtL; had no significant effect on divalen DMT1 or FtH expression.\nFurther decreased TfR1 protein expression and reversed FAC-induced elevation of FtL protein expression in FAC-pretreated HepG2 cells; had no significant effect on Fpn1, DMT1, or FtH expression in FAC-pretreated cells.
-
Cell Line:HepG2.2.15 human hepatoma cells
-
Concentration:4, 6 μg/ml
-
Incubation Time:24, 48, 72 h
-
Result:Dose-dependently decreased extracellular levels of hepatitis B surface antigen (HBsAg), hepatitis B e antigen (HBeAg), and hepatitis B core antigen (HBcAg). Reduced HBeAg secretion by 26.31% and HBcAg secretion by 29.26% at 72 h, with more efficient inhibition than the positive control.
-
Cell Line:HepG2.2.15 human hepatoma cells
-
Concentration:4, 6 μg/ml
-
Incubation Time:72 h
-
Result:Resulted in G0/G1 phase percentages of 75.2% (4 μg/ml) and 78.1% (6 μg/ml), with no statistically significant difference from the untreated control (73.3%). Induced no cell cycle arrest.
In Vivo
Rubiadin (50-200 mg/kg; p.o.; daily; 14 days) exhibits dose-dependent hepatoprotective activity against CCl4-induced hepatic damage in Sprague-Dawley rats, with highly significant efficacy at 100 and 200 mg/kg that approaches the activity of the reference drug silymarin[3].
Rubiadin (20 mg/kg; intragastric; daily; 8 weeks) improves spatial and non-spatial memory, reduces cerebral Aβ deposition, mitigates neuroinflammation, and inhibits NF-κB pathway activation in APP/PS1 Alzheimer's disease model mice[4].
Rubiadin (1 mg/kg; i.p.; every other day; 6 weeks) reduces serum iron, total iron-binding capacity, and transferrin saturation in normal 8-week-old C57BL/6 male mice[6].
Rubiadin (5-20 mg/kg; i.p.; daily; 4 weeks) alleviates iron overload in high-iron diet-fed C57BL/6 male mice by reversing splenomegaly, reducing serum iron parameters and duodenal iron content, and enhancing hepatic hepcidin expression and SMAD1/5/9 phosphorylation[6].
Rubiadin (100-250 mg/kg; p.o.; daily; 3 days) exhibits anticonvulsant effects in Swiss albino mice, reducing seizure severity in both pentylene tetrazole and maximal electro shock models when administered orally at 100 and 250 mg/kg for 3 days[8].
Rubiadin (0.04%; dietary; daily; 23 weeks) acts as a carcinogenic metabolite in F344 rats, enhancing renal preneoplastic lesions, liver cell foci, and intestinal dysplasias when administered at 0.04% in the diet for 23 weeks[8].
MedChemExpress (MCE) has not independently confirmed the accuracy of these methods. They are for reference only.
-
Animal Model:Wistar albino rats (male, 150-200 g)[2]
-
Dosage:0.3 mg/kg; 0.5 mg/kg
-
Administration:i.p.; single dose
-
Result:Produced paw edema inhibition percentages of 24% (0.5 hr), 17.5% (1 hr), 8.3% (2 hr), 21% (3 hr), and 13% (4 hr) at 0.3 mg/kg.\nProduced paw edema inhibition percentages of 48% (0.5 hr), 40% (1 hr), 45% (2 hr), 61% (3 hr), and 54% (4 hr) at 0.5 mg/kg, with 61% inhibition at peak edema time being statistically significant.\nCaused a statistically significant decrease in paw tissue TNF-α levels at 0.5 mg/kg compared to controls.\nSignificantly reduced paw tissue edema and histopathological damage compared to controls at both doses.
-
Animal Model:Wistar albino rats (male, 150-200 g)[2]
-
Dosage:0.3 mg/kg; 0.5 mg/kg
-
Administration:i.p.; daily; 7 days
-
Result:Produced 34.71% inhibition of granuloma formation and 19.76% inhibition of transudate formation at 0.3 mg/kg.\nProduced 46.12% inhibition of granuloma formation and 38.13% inhibition of transudate formation at 0.5 mg/kg, with both values statistically. Caused a statistically significant decrease in serum IL-1β levels at 0.5 mg/kg compared to controls.
-
Animal Model:C57BL/6 (6-week-old, male; high-iron diet-induced iron overload)[6]
-
Dosage:5 mg/kg; 20 mg/kg
-
Administration:i.p.; daily; 4 weeks
-
Result:Did not significantly affect mouse body weight.\nSignificantly reversed splenomegaly, reduced elevated serum iron, total iron-binding capacity, and transferrin saturation caused by the high-iron diet, and reversed the elevated duodenal iron content caused by the high-iron diet.\nFurther increased hepatic hepcidin mRNA expression, hepatic hepcidin protein expression, and hepatic SMAD1/5/9 phosphorylation levels relative to the high-iron diet alone.
-
Animal Model:Wistar (carbon tetrachloride-induced liver injury)[8]
-
Dosage:50 mg/kg; 100 mg/kg; 200 mg/kg
-
Administration:p.o.; daily; 2 weeks
-
Result:Restored serum glutamic oxaloacetic transaminase, glutamate pyruvate transaminase, alkaline phosphatase, γ-glutamyltransferase, glutathione S-transferase, and glutathione reductase levels to normal.\nInhibited hepatic malondialdehyde formation in a dose-dependent manner.\nReduced glutathione depletion in a dose-dependent manner.
-
Animal Model:Wistar (streptozotocin-nicotinamide-induced diabetic nephropathy)[8]
-
Dosage:100 mg/kg/week; 200 mg/kg/week
-
Administration:p.o.
-
Result:Markedly reduced blood glucose levels, urea, uric acid, and creatinine levels.\nImproved lipid, thiobarbituric acid reactive substances, glutathione, superoxide dismutase, and catalase levels.
-
Animal Model:F344[8]
-
Dosage:0.04%
-
Administration:dietary; daily; 23 weeks
-
Result:Enhanced atypical renal tubules/hyperplasias.\nInduced renal cell adenomas and carcinomas.\nIncreased glutathione S-transferase placental form-positive liver cell foci.\nCaused major intestinal dysplasias.
Chemical Information
-
CAS. Nr. 117-02-2
-
Appearance Solid
-
Molecular Weight 254.24
-
Formel C15H10O4
-
Color Light yellow to yellow
-
SMILES
O=C1C2=C(C=CC=C2)C(C3=CC(O)=C(C)C(O)=C13)=O
-
Structure Classification
-
Initial Source
-
Versand
Room temperature in continental US; may vary elsewhere.
-
Speicherung
4°C, protect from light
* In solvent : -80°C, 6 months; -20°C, 1 month (protect from light)
Lösungsmittel & Löslichkeit
In Vitro:
DMSO : ≥ 6.25 mg/mL (24.58 mM; Hygroscopic DMSO has a significant impact on the solubility of product, please use newly opened DMSO)
* "≥" means soluble, but saturation unknown.
Please refer to the solubility information to select the appropriate solvent. Once prepared, please aliquot and store the solution to prevent product inactivation from repeated freeze-thaw cycles.
Storage method and period of stock solution: -80°C, 6 months; -20°C, 1 month (protect from light). When stored at -80°C, please use it within 6 months. When stored at -20°C, please use it within 1 month.
Please refer to the solubility information to select the appropriate solvent. Once prepared, please aliquot and store the solution to prevent product inactivation from repeated freeze-thaw cycles.
Storage method and period of stock solution: -80°C, 6 months; -20°C, 1 month (protect from light). When stored at -80°C, please use it within 6 months. When stored at -20°C, please use it within 1 month.
Konzentration (Stammlösung) × Volumen (Stammlösung) = Konzentration (Ziellösung) × Volumen (Ziellösung)
Protokoll
-
Somatic Cell Culture
A method of simulating the in vivo environment in vitro to maintain the cell growth, differentation and main functions.
-
Liver Cancer Modeling
Liver cancer can be classified into primary liver cancer and secondary liver cancer. Secondary liver cancer is the metastatic liver cancer. Primary liver cancer includes hepatocellular carcinoma (HCC), intrahepatic cholangiocarcinoma (ICC) and fibrolamellar HCC, of which HCC is the most common form, accounting for approximately 90% of primary liver cancers[1]. HCC mouse models include chemical agent-induced models, transplanted tumor models, and genetic engineered models.
-
Perls' Prussian Blue Iron Staining
Perls' Prussian blue staining is a histochemical method used to detect non-heme ferric iron (Fe3+) in biological tissues by exploiting an acid-mediated release of loosely bound iron from storage complexes such as ferritin or hemosiderin, followed by its reaction with potassium ferrocyanide to form an insoluble blue ferric ferrocyanide (Prussian blue) precipitate that marks iron localization under light microscopy. The reaction is classically performed under acidic conditions, which liberate Fe3+ ions that subsequently bind ferrocyanide to generate the visible chromogen, enabling spatial visualization of iron deposits in tissues such as brain, liver, and spleen. Histochemical interpretations are limited to a reactive iron pool rather than total iron content, reflecting only histologically accessible iron species rather than tightly protein-bound iron.
-
Breast Cancer Modeling
Breast cancer is a heterogeneous cancer, and it has been distinguished into four subtypes: luminal A, luminal B, HER2-positive and basal-like. Molecular mutations, epigenetic alterations, hormone exposure and immune microenvironment are related to the progression of breast cancer.
-
Alzheimer’s Disease Modeling
Alzheimer’s Disease (AD) is a neurodegenerative disorder characterized by a progressive decline in cognitive functions and loss of specific types of neurons and synapses. Alzheimer's symptoms can be simulated in mice by injecting drugs (such as Aβ) or genetically modified.
-
Apoptosis
Apoptosis, also called programmed cell death, is generally characterized by distinct morphological characteristics.
-
TUNEL staining for apoptotic DNA fragmentation
TUNEL staining detects DNA strand breaks by using terminal deoxynucleotidyl transferase to add labeled nucleotides to exposed 3′-OH DNA termini, generating either microscopic staining in fixed cells or tissue sections, or fluorescence/cytometric signal in cell suspensions. TUNEL positivity reflects DNA fragmentation but should not be interpreted alone as definitive apoptosis, because TUNEL can also label necrotic, autolytic, mechanically damaged, or DNA-repair-associated DNA breaks.
-
Apoptosis Solutions
Apoptosis is a regulated, generally non-lytic cell-death pathway that removes unwanted, damaged, infected, or abnormal cells through coordinated morphological changes, caspase activation, DNA fragmentation, and membrane remodeling. The intrinsic apoptosis pathway is controlled mainly by mitochondrial outer membrane permeabilization, BCL-2 family proteins, cytochrome c release, apoptosome formation, caspase-9 activation, and downstream executioner caspase-3/7 activation. The extrinsic apoptosis pathway is initiated by death receptors such as Fas, TNFR, and TRAIL receptors, which recruit adaptor proteins and activate caspase-8 before engaging executioner caspases or mitochondrial amplification through BID cleavage. Apoptosis is linked to many phenotypes, including cancer cell killing, tissue homeostasis, immune regulation, neurodegeneration, infection response, and treatment-induced cytotoxicity; unresolved questions include how apoptosis interacts with necroptosis, pyroptosis, ferroptos
-
Ferroptosis Solutions
Ferroptosis is an iron-dependent, non-apoptotic form of regulated cell death characterized by lethal lipid peroxidation and sensitivity to suppression by iron chelators or lipophilic radical-trapping antioxidants. The core pathway links cystine uptake through system Xc−, glutathione availability, GPX4-dependent detoxification of phospholipid hydroperoxides, iron-dependent oxidative reactions, and polyunsaturated-phospholipid metabolism into a cell-death program that is biochemically and morphologically distinct from apoptosis, necrosis, and autophagy. The ferroptosis pathway is experimentally linked to phenotype through chemical and genetic perturbation. Erastin induces ferroptosis by inhibiting cystine uptake through system Xc− and weakening antioxidant defenses, while GPX4 inhibition or depletion causes lipid peroxide accumulation and ferroptotic cancer-cell death. ACSL4 and oxidizable arachidonoyl- or adrenoyl-containing phosphatidylethanolamines shape ferroptosis sensitivity by con
-
MTT Cell Proliferation Assay
The MTT assay is a colorimetric endpoint assay for estimating viable cell number, cell growth, cytotoxicity, or cell activation in cultured mammalian cells. Living cells reduce the yellow tetrazolium salt MTT into purple/blue formazan, while dead cells do not generate the same signal; the resulting color can be quantified with a multiwell spectrophotometer. MTT reduction is commonly interpreted as a readout of metabolic activity that often correlates with viable cell number, but it should not be treated as a direct cell-counting method unless the assay is optimized for the cell type and experimental condition. Studies show that MTT reduction can involve mitochondrial and non-mitochondrial reducing systems, and formazan may accumulate in intracellular lipid droplets rather than simply marking mitochondria.
-
Research Protocol for Infectious Diseases
Infectious-disease experiments test how pathogens interact with host barriers, innate immune receptors, inflammatory signaling, pathogen replication, and tissue injury; pattern-recognition receptors such as TLRs, RIG-I-like receptors, NOD-like receptors, and inflammasomes detect microbial molecules and activate NF-κB, interferon, and cytokine responses. The central hypothesis is that infection severity reflects the balance between pathogen burden and host response: protective inflammation restricts pathogen growth, whereas excessive or mislocalized inflammation contributes to tissue damage and disease phenotype. Unresolved questions include which host pathways are protective versus pathogenic, why some infection models fail to translate to human disease, and which combined readouts best predict clinically relevant infection outcomes.
-
Annexin V plus membrane-impermeant dye apoptosis staining
Annexin V-based apoptosis assays rely on the detection of phosphatidylserine (PS) externalization from the inner leaflet of the plasma membrane to the outer leaflet, an early biochemical hallmark of apoptosis. Fluorescently labeled Annexin V binds PS in a calcium-dependent manner, enabling identification of early apoptotic cells by flow cytometry or fluorescence microscopy. When combined with a membrane-impermeant DNA-binding dye (e. g. , propidium iodide), this approach allows discrimination between viable (Annexin V−/dye−), early apoptotic (Annexin V+/dye−), and late apoptotic or necrotic (Annexin V+/dye+) cell populations by assessing membrane integrity and PS exposure.
-
BrdU Incorporation Assay
Bromodeoxyuridine (BrdU) incorporation assay is based on the principle that BrdU, a thymidine analog, is incorporated into newly synthesized DNA during the S phase of the cell cycle, thereby serving as a marker of DNA replication and cellular proliferation. Incorporated BrdU can be detected using anti-BrdU antibodies following DNA denaturation, enabling visualization or quantification of proliferating cells through immunochemical detection methods such as immunofluorescence or immunohistochemistry.
-
CFSE Dye Dilution Proliferation Assay
The CFSE (carboxyfluorescein diacetate succinimidyl ester) dye dilution proliferation assay is based on the covalent labeling of intracellular proteins by a cell-permeant fluorescent dye that becomes fluorescent upon intracellular ester cleavage and then is stably retained within cells. As labeled cells divide, the dye is partitioned equally between daughter cells, resulting in a stepwise halving of fluorescence intensity that can be quantified by flow cytometry to determine the number of cell divisions undergone by each cell population. This fluorescence dilution approach enables quantitative tracking of lymphocyte proliferation at the single-cell level over multiple rounds of division. CFSE-based proliferation analysis has been widely applied to measure antigen-driven lymphocyte expansion in vitro, where discrete fluorescence peaks correspond to successive cell divisions and allow reconstruction of proliferative history within heterogeneous populations.
-
Zymosan-Induced Peritonitis
Zymosan-induced peritonitis is a sterile acute-inflammation model produced by intraperitoneal injection of zymosan, a yeast cell-wall particle preparation, followed by quantification of leukocyte recruitment and soluble inflammatory mediators in peritoneal lavage fluid. Low-dose zymosan peritonitis is commonly used as a self-resolving acute inflammation model in which neutrophil recruitment occurs early and monocyte/macrophage accumulation follows later. The assay readouts include total peritoneal leukocyte number, differential neutrophil and monocyte/macrophage counts, peritoneal cytokines and chemokines, plasma or peritoneal exudation, and optional lipidomic or metabolomic changes during inflammation and resolution. Early neutrophil recruitment after zymosan depends strongly on complement and mast-cell C5a receptor signaling, whereas later monocyte recruitment is linked to MCP-1/CCL2 production.
-
Dye-dilution cell tracking and proliferation staining
Dye-dilution cell tracking assays quantify cell proliferation by covalently labeling intracellular proteins with a stable fluorescent dye that is equally partitioned between daughter cells during mitosis, resulting in stepwise halving of fluorescence intensity with each cell division as measured by flow cytometry histograms. Carboxyfluorescein diacetate succinimidyl ester (CFSE) is a prototypical dye that diffuses into cells, is enzymatically converted into a fluorescent compound, and then covalently binds intracellular amine groups, producing long-lived fluorescence suitable for tracking multiple rounds of division in vitro and in vivo. Successive generations of dividing cells form discrete peaks of decreasing fluorescence intensity, enabling estimation of proliferation history, precursor frequency, and division index within heterogeneous populations. Alternative dyes such as CellTrace Violet (CTV) and far-red membrane dyes (e. g. , PKH26) follow the same dilution principle but differ
-
CCK-8/WST-8 Cell Proliferation Assay
The CCK-8/WST-8 assay is based on the reduction of the water-soluble tetrazolium salt WST-8 to a water-soluble formazan product by cellular dehydrogenases in metabolically active cells, where the generated formazan amount is proportional to the number of living cells and is quantified by measuring absorbance in the visible range, providing a colorimetric readout for cell viability and proliferation assessment. This class of tetrazolium-based assays improves upon earlier MTT-based systems by producing a water-soluble formazan, eliminating the need for organic solubilization steps and enabling direct spectrophotometric measurement in culture medium.
-
Protocol for Cell Cycle
Cell-cycle analysis by flow cytometry measures DNA content in single cells to estimate the fraction of cells in G0/G1, S, and G2/M phases. Propidium iodide intercalates into DNA, and after RNA removal with RNase, fluorescence intensity reflects cellular DNA content: 2N cells are assigned to G0/G1, cells between 2N and 4N to S phase, and 4N cells to G2/M. DNA-content analysis alone cannot reliably separate G0 from G1 or G2 from M. Ki-67 can distinguish quiescent G0 cells from cycling cells, EdU or BrdU incorporation marks active DNA synthesis in S phase, and phospho-histone H3 staining identifies mitotic cells within the 4N population.
-
Research Protocol for Inflammation-related Diseases
The NLRP3 inflammasome is a cytosolic innate immune signaling platform that integrates priming signals and danger-signal activation to promote caspase-1 activation, maturation of IL-1β and IL-18, and gasdermin D-mediated pyroptotic cell death. The core experimental logic is to determine whether inflammatory disease phenotypes are driven by increased NLRP3 expression, ASC-containing inflammasome assembly, caspase-1 cleavage, GSDMD cleavage, and extracellular release of IL-1β/IL-18 rather than by nonspecific cell injury alone. The pathway is strongly linked to inflammation-related disease phenotypes because monosodium urate crystals activate NALP3/NLRP3 inflammasome signaling in gout-like crystal inflammation, cholesterol crystals activate NLRP3 inflammasomes in atherogenesis models, and DSS-induced intestinal inflammation has been reported to involve NLRP3 inflammasome activity. However, experimental colitis studies also show context-dependent protective effects of NLRP3 inflammasome co
-
Cell Counting-Based Growth Curve Assay
Cell counting-based growth curve assays quantify cell proliferation by directly measuring changes in viable cell number over time using manual or automated counting methods such as hemocytometer-based counting or instrument-assisted cell enumeration, enabling construction of growth curves that reflect population expansion dynamics in response to culture conditions. A widely used approach is trypan blue exclusion with hemocytometer counting, where membrane-compromised (non-viable) cells take up the dye, allowing discrimination between viable and non-viable cells while simultaneously enabling total cell number quantification. Repeated sampling across time points allows estimation of proliferation rate, growth phases, and comparative growth kinetics between experimental conditions.
-
Colony Formation (Clonogenic) Assay
The clonogenic (colony formation) assay measures the ability of a single cell to retain reproductive viability and form a macroscopic colony, typically defined as a cluster derived from one progenitor cell after a defined growth period. This assay is widely used to evaluate cell survival after exposure to ionizing radiation or cytotoxic treatments and is considered a standard method in radiation biology for generating dose-response relationships of reproductive cell death. Colony formation reflects long-term proliferative capacity rather than short-term metabolic activity, and survival is quantified by comparing treated versus untreated conditions based on colony number and derived survival fractions.
-
Cell Viability Determination by MTT Colorimetric Assay
The following protocol uses the MTT colorimetric assay as a classic literature-established method for assessing cell viability/metabolic activity in cultured mammalian cells. MTT[3-(4,5-dimethylthiazol-2-yl)-2,5-diphenyltetrazolium bromide] is reduced by metabolically active cells to a colored formazan product; the amount of formazan is quantified spectrophotometrically and provides an indirect measure of metabolically active viable cells. Importantly, MTT reduction reflects cellular oxidoreductase/metabolic activity rather than an absolute direct count of living cells, so changes in cellular metabolism can alter the signal independently of cell number.
-
EdU Incorporation Assay (Click Chemistry-Based DNA Synthesis Measurement)
The EdU incorporation assay measures DNA synthesis by adding the thymidine analog 5-ethynyl-2′-deoxyuridine to cells or tissues, where it is incorporated into newly synthesized DNA during S phase. Incorporated EdU is detected by copper-catalyzed azide-alkyne cycloaddition, in which a fluorescent azide covalently reacts with the ethynyl group on EdU, allowing S-phase cells to be detected by fluorescence microscopy, flow cytometry, or high-content imaging. EdU detection does not require DNA denaturation or anti-BrdU antibody access, which preserves sample structure and improves compatibility with immunostaining and multiparameter cytometry compared with BrdU-based detection. EdU can be cytotoxic in a cell-type- and exposure-dependent manner, so pulse duration, concentration, and continuous-labeling designs should be validated for each cell type.
-
Ki-67 Immunostaining Proliferation Assay
Ki-67 immunostaining measures the growth fraction of a cell population by detecting Ki-67, a nuclear antigen present in proliferating cells and absent in quiescent G0 cells. The readout is the percentage of Ki-67-positive nuclei among total counted cells, commonly called the Ki-67 labeling index or proliferation index.
-
PCNA Immunodetection Proliferation Assay
PCNA immunodetection measures proliferative activity by detecting proliferating cell nuclear antigen, a nuclear protein associated with DNA polymerase δ function and DNA replication. The assay readout is the proportion of PCNA-positive nuclei among total counted cells, but PCNA labeling is not identical to BrdU labeling because PCNA can mark late G1/early S-associated replication competence and may persist beyond active DNA synthesis depending on fixation and extraction conditions.
-
Protocol for Cell Counting and Cell Density Analysis
Cell counting and cell-density analysis estimate the number of cells in a known volume or field area. Manual hemocytometer counting uses a chamber of defined geometry to convert counted cells into cells/mL, while automated counters and image-analysis workflows detect cell objects from optical, brightfield, fluorescence, impedance, or digital-image features. Trypan blue viability counting is based on dye exclusion: viable cells with intact membranes exclude dye, while non-viable cells with compromised membranes stain blue. The readout is total cell density, viable-cell density, dead-cell density, and percent viability. Cell density can also be estimated from microscopy images by counting objects per image area, from flow cytometry using calibrated volume or reference particles, or from in situ microscopy in bioreactors after calibration against reference methods such as hemocytometer or flow cytometry.
-
Cotton Pellet Granuloma
Cotton pellet granuloma is a classical in vivo chronic inflammation model used to evaluate the anti-inflammatory potential of test substances by measuring their ability to inhibit granuloma tissue formation around an implanted foreign body (cotton pellet) in rodents. The method is based on the biological response to a sterile implanted material, which induces proliferative phase inflammation characterized by fibroblast proliferation and collagen-rich granuloma formation, and the final readout reflects the extent of chronic inflammatory tissue growth surrounding the pellet. In multiple preclinical pharmacological evaluations, inhibition of cotton pellet-induced granuloma formation has been used as an indicator of anti-inflammatory activity in both synthetic and natural product screening contexts.
-
Carrageenan-Induced Paw Edema
Carrageenan-induced paw edema is an acute inflammation model in which intraplantar injection of carrageenan induces localized inflammatory swelling characterized by vascular permeability, leukocyte infiltration, and production of inflammatory mediators such as prostaglandins and cytokines, making it widely used to evaluate anti-inflammatory agents in vivo. The resulting paw volume or thickness increase is quantified over time as a direct readout of inflammatory intensity and drug efficacy, typically reflecting cyclooxygenase-mediated prostaglandin-driven edema formation and immune cell recruitment in peripheral tissue[20].
-
Osteoclast differentiation from monocyte/macrophage precursors
Osteoclast differentiation is an in vitro induction assay in which monocyte/macrophage-lineage precursors are exposed to macrophage colony-stimulating factor (M-CSF) and receptor activator of NF-κB ligand (RANKL), generating multinucleated osteoclasts that are commonly identified by tartrate-resistant acid phosphatase (TRAP) staining and functionally confirmed by resorption pits on dentin, bone, or mineralized substrates. M-CSF supports survival and expansion of osteoclast precursors, while RANKL binding to RANK drives osteoclast commitment, fusion, maturation, and resorptive function; osteoprotegerin inhibits this pathway by binding RANKL and preventing RANK activation. The main readouts are the number of TRAP-positive multinucleated cells, formation of F-actin rings, and resorbed surface area; TRAP-positive multinucleated cells indicate osteoclast differentiation, whereas pit formation on dentin, bone, or mineralized coating indicates functional bone-resorbing activity.
Reinheit & Dokumentation
-
Data Sheet (295 KB)
-
SDS (394 KB)
- English - EN (394 KB)
- Français - FR (394 KB)
- Deutsch - DE (394 KB)
- Norwegian - NO (394 KB)
- Español - ES (394 KB)
- Swedish - SV (394 KB)
- Italian - IT (394 KB)
- Korean - KR (394 KB)
- Portuguese - PT (394 KB)
-
Handling Instructions (2659 KB)
Verweise
[2]. Chitsaz R, et al. Rubiadin exerts an acute and chronic anti-inflammatory effect in rodents. Braz J Biol. 2021;83:e243775. Published 2021 Dec 13. [Content Brief]
[3]. Rao GM, et al. Hepatoprotective effects of rubiadin, a major constituent of Rubia cordifolia Linn. J Ethnopharmacol. 2006;103(3):484-490. [Content Brief]
[4]. Zhang Y, et al. Rubiadin Alleviates Alzheimer's Disease Pathology via NF-κB Pathway Regulation. J Integr Neurosci. 2025;24(10):33497. [Content Brief]
[5]. Rumie Vittar NB, et al. Photochemotherapy using natural anthraquinones: Rubiadin and Soranjidiol sensitize human cancer cell to die by apoptosis. Photodiagnosis Photodyn Ther. 2014;11(2):182-192. [Content Brief]
[6]. Xie X, et al. Rubiadin Mediates the Upregulation of Hepatic Hepcidin and Alleviates Iron Overload via BMP6/SMAD1/5/9-Signaling Pathway. Int J Mol Sci. 2025;26(3):1385. Published 2025 Feb 6. [Content Brief]
[7]. Peng Z, et al. Effects of Rubiadin isolated from Prismatomeris connata on anti-hepatitis B virus activity in vitro. Phytother Res. 2017;31(12):1962-1970. [Content Brief]
[8]. Watroly MN, et al. Chemistry, Biosynthesis, Physicochemical and Biological Properties of Rubiadin: A Promising Natural Anthraquinone for New Drug Discovery and Development. Drug Des Devel Ther. 2021;15:4527-4549. Published 2021 Nov 3. [Content Brief]
[9]. Hieu LT, et al. The Theoretical and Experimental Insights into the Radical Scavenging Activity of Rubiadin. J Phys Chem B. 2023;127(51):11045-11053. [Content Brief]
Complete Stock Solution Preparation Table
Please refer to the solubility information to select the appropriate solvent. Once prepared, please aliquot and store the solution to prevent product inactivation from repeated freeze-thaw cycles.
Storage method and period of stock solution: -80°C, 6 months; -20°C, 1 month (protect from light). When stored at -80°C, please use it within 6 months. When stored at -20°C, please use it within 1 month.
| Optional Solvent | Concentration Solvent Mass | 1 mg | 5 mg | 10 mg | 25 mg |
|---|---|---|---|---|---|
| DMSO | 1 mM | 3.9333 mL | 19.6665 mL | 39.3329 mL | 98.3323 mL |
| 5 mM | 0.7867 mL | 3.9333 mL | 7.8666 mL | 19.6665 mL | |
| 10 mM | 0.3933 mL | 1.9666 mL | 3.9333 mL | 9.8332 mL | |
| 15 mM | 0.2622 mL | 1.3111 mL | 2.6222 mL | 6.5555 mL | |
| 20 mM | 0.1967 mL | 0.9833 mL | 1.9666 mL | 4.9166 mL |