



MitoTracker Green FM (solution)

Based on 1 Customer Validation
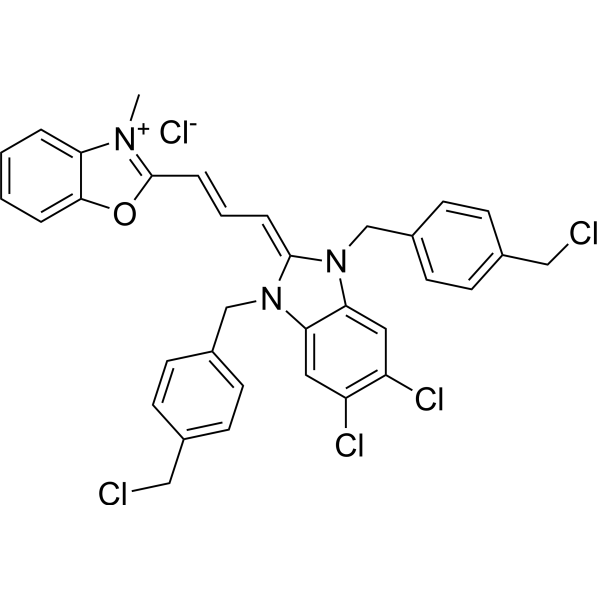
Mito-Tracker Green (solution) is a green fluorescent dye that selectively accumulates in the mitochondrial matrix. MitoTracker Green FM covalently binds mitochondrial proteins by reacting with free mercaptan of cysteine residues, allowing staining of mitochondrial membrane potential independent of membrane potential. Excitation/emission wavelength 490/523 nm.
Solvent and concentration: DMSO: 1 mM
For research use only. We do not sell to patients.
- CAS No.: 201860-17-5
- Formula: C34H28Cl5N3O
- Molecular Weight:671.87
-
Storage:
Please store the product under the recommended conditions in the Certificate of Analysis.


To place orders, for customer services and technical support, please contact: MedChemExpress USA
Tel: 609-228-6898 E-mail: [email protected] [email protected]


-
 Biological Activity
-
Chemical Information
- Protocols
- Purity & Documentation
- References
-
 Help & FAQs


-

HY-DY1040
LysoTracker Red (solution)Cell Death Indicator -
HY-15559
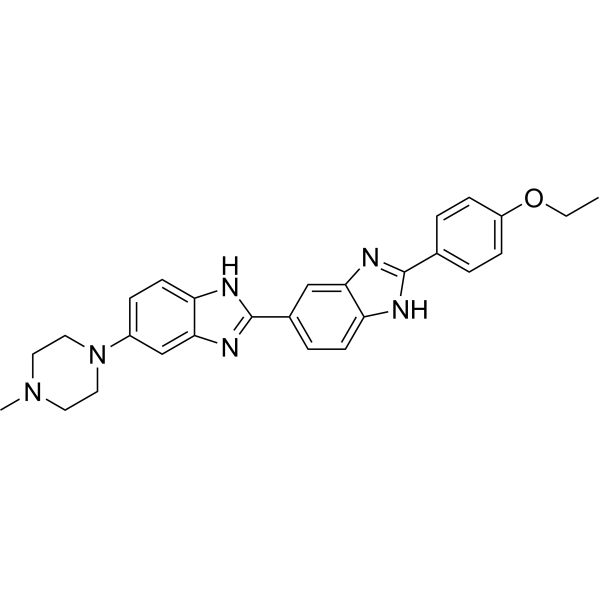
Hoechst 33342DNA Fluorescent Stain -
HY-15534
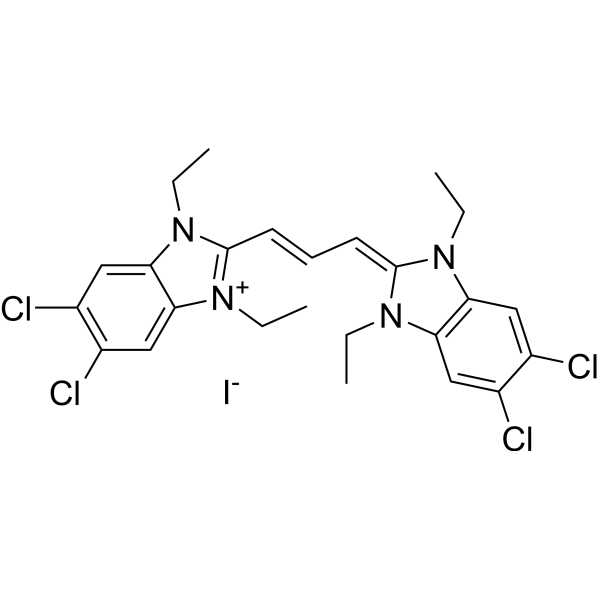
JC-1Mitochondrial Membrane Potential Probe -
HY-135056
MitoTracker Green FMMitochondrial Dye -

HY-Y0320
Dimethyl sulfoxide, meets analytical specification of Ch.P.Aprotic Solvent -
HY-D1055
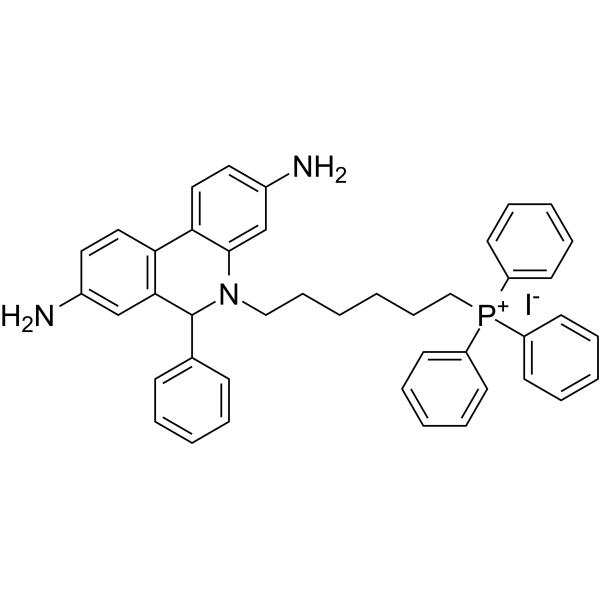
MitoSOX RedMitochondrial ROS Indicator -
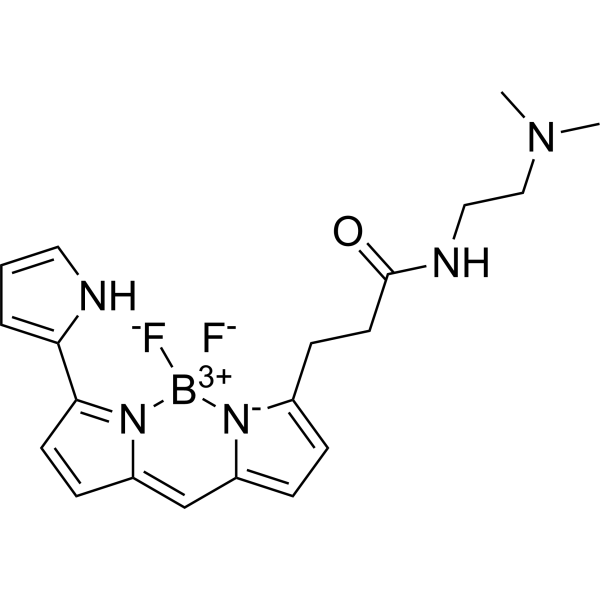
HY-D1300
LysoTracker RedCell Death Indicator -

HY-DY1105
MitoTracker Deep Red FM (solution)Red Fluorescent Dye -
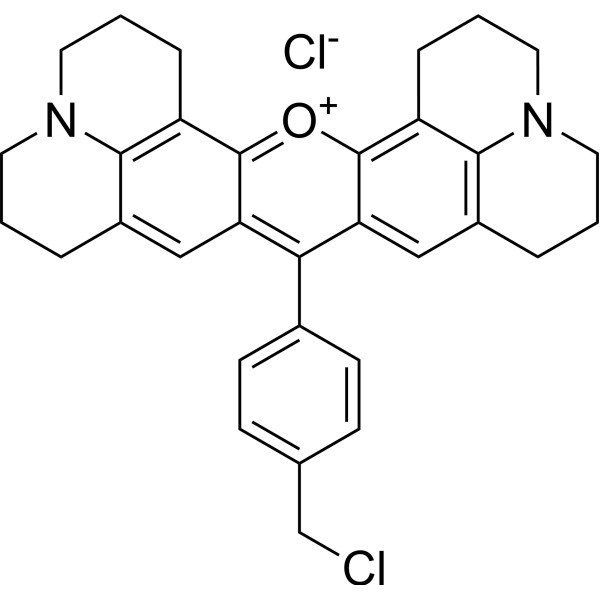
HY-D1116
MitoMark Red IFluorescent Dye -
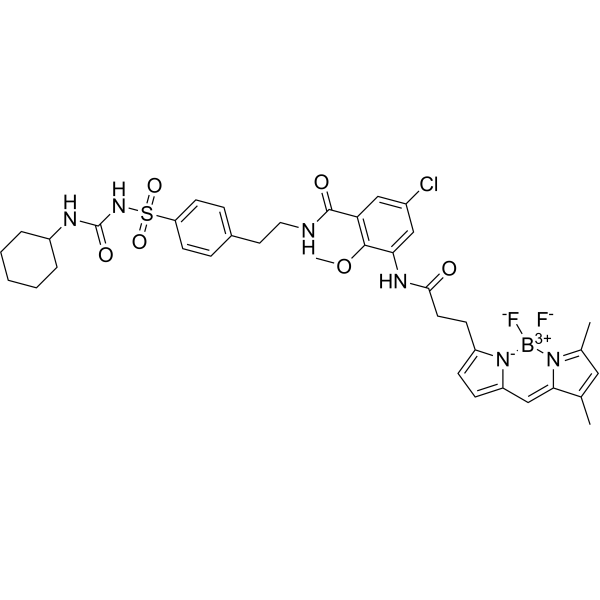
HY-D1297
ER-Tracker GreenEndoplasmic Reticulum Fluorescent Dye -

HY-DY1043
ER-Tracker Green (solution)Endoplasmic Reticulum Fluorescent Dye -
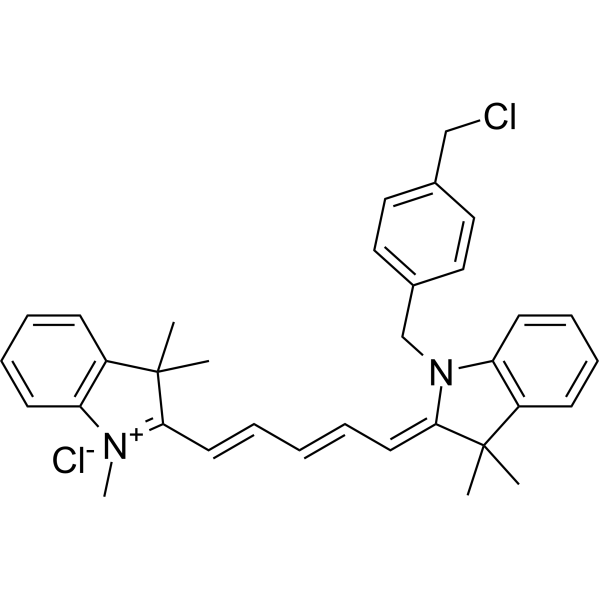
HY-D1783
MitoTracker Deep Red FMRed Fluorescent Dye


Biological Activity
Description
Solvent and concentration: DMSO: 1 mM
In Vitro
General Protocol
1. Preparation of MitoTracker Green FM working solution
1.1 Stock solution
It is recommended to store the stock solution at -20°C and -80°C away from light and avoid repetitive freeze-thaw cycles.
1.2 Preparation of MitoTracker Green FM working solution
Dilute the stock solution in serum-free cell culture medium or PBS. The corresponding stock solution can be diluted according to the actual situation. Note that if the solvent is DMSO, the cytotoxicity of DMSO must be considered, and a solvent control should be prepared; if the solvent is pure water, the working solution needs to be filtered and sterilized before adding cells.
Note: Please adjust the concentration of MitoTracker Green FM working solution according to the actual situation.
2. Cell staining
2.1 Suspension cells (6-well plate)
a. Centrifuge at 1000 g at 4°C for 3-5 minutes and then discard the supernatant. Wash twice with PBS, 5 minutes each time.The cell density is 1×10⁶/mL.
b. Add 1 mL of working solution, and then incubate at room temperature for 15-45 minutes.
c. Centrifuge at 400 g at 4°C for 3-4 minutes and then discard the supernatant.
d. Wash twice with PBS, 5 minutes each time.
e. Resuspend cells with serum-free cell culture medium or PBS. Observation by fluorescence microscopy or flow cytometry.
2.2 Adherent cells
a. Culture adherent cells on sterile coverslips.
b. Remove the coverslip from the medium and aspirate excess medium.
c. Add 100 μL of working solution, gently shake it to completely cover the cells,and then incubate at room temperature for 5-30 minutes.
d. Wash twice with medium, 5 minutes each time. Observation by fluorescence microscopy or flow cytometry.
Storage
Store in separate containers to avoid repeated freeze-thaw cycles. -20°C, 1 year. Protect from light
Precautions
1. Please adjust the concentration of MitoTracker Green FM working solution according to the actual situation.
2. This product is for R&D use only, not for drug, household, or other uses.
3. For your safety and health, please wear a lab coat and disposable gloves to operate.
MedChemExpress (MCE) has not independently confirmed the accuracy of these methods. They are for reference only. Further protocols information, click here.


Chemical Information
-
CAS No. 201860-17-5
-
Appearance Liquid
-
Molecular Weight 671.87
-
Formula C34H28Cl5N3O
-
Color Yellow to orange
-
SMILES
C[N+]1=C(/C=C/C=C2N(CC3=CC=C(CCl)C=C3)C4=CC(Cl)=C(Cl)C=C4N\2CC5=CC=C(CCl)C=C5)OC6=CC=CC=C16.[Cl-]
-
Shipping
Room temperature in continental US; may vary elsewhere.
-
Storage
Please store the product under the recommended conditions in the Certificate of Analysis.

Protocols
-
Mitochondrial membrane-potential fluorescent assay
Mitochondrial membrane potential fluorescent assays estimate ΔΨm in living cells using lipophilic cationic dyes such as TMRM, TMRE, rhodamine 123, and JC-1, which accumulate in mitochondria according to membrane polarization; loss of signal after FCCP or CCCP treatment is interpreted as mitochondrial depolarization. TMRM/TMRE and rhodamine 123 are commonly used for semi-quantitative live-cell microscopy or flow cytometry, while JC-1 can report a shift from red aggregate fluorescence to green monomer fluorescence during depolarization; interpretation requires controls because dye concentration, quenching mode, cell type, dye efflux, and mitochondrial mass can affect fluorescence independently of ΔΨm.
-
Fluorescent plasma-membrane potential dye assay
Fluorescent plasma-membrane potential dye assays measure changes in cell membrane potential using voltage-sensitive dyes whose fluorescence changes when cells depolarize or hyperpolarize. Anionic bis-oxonol dyes such as DiBAC4(3) enter depolarized cells more readily and show increased fluorescence after intracellular binding, while hyperpolarization reduces dye accumulation and fluorescence. FMP/FLIPR membrane-potential dyes are used for faster, homogeneous microplate assays of ion-channel or receptor-mediated membrane-potential changes.
-
Mitochondrial membrane-potential and mitochondrial mass staining
Mitochondrial membrane potential staining measures the electrochemical polarization across the mitochondrial inner membrane in live cells using lipophilic cationic fluorescent probes; early rhodamine-based work showed that selective mitochondrial dye accumulation is lost when the mitochondrial transmembrane potential is dissipated. JC-1 reports mitochondrial polarization by shifting from green monomer fluorescence to red J-aggregate fluorescence as dye concentration increases within energized mitochondria; therefore, the red/green fluorescence ratio is used as a relative readout of mitochondrial membrane potential. TMRE or TMRM staining provides a single-channel relative readout because these cationic rhodamine esters accumulate in polarized mitochondria, and lower fluorescence indicates reduced mitochondrial polarization when acquisition and dye-loading conditions are controlled. Mitochondrial mass staining is commonly performed with MitoTracker Green FM or related MitoTracker dyes as


Purity & Documentation
-
Data Sheet (275 KB)
-
SDS (252 KB)
- English - EN (252 KB)
- Français - FR (252 KB)
- Deutsch - DE (252 KB)
- Norwegian - NO (252 KB)
- Español - ES (252 KB)
- Swedish - SV (252 KB)
- Italian - IT (252 KB)
- Korean - KR (252 KB)
- Portuguese - PT (252 KB)
-
Handling Instructions (2659 KB)
References
[1]. Gautam N, et, al. A high content imaging flow cytometry approach to study mitochondria in T cells: MitoTracker Green FM dye concentration optimization. Methods. 2018 Feb 1;134-135:11-19. [Content Brief]
[2]. Gautam N, et, al. A high content imaging flow cytometry approach to study mitochondria in T cells: MitoTracker Green FM dye concentration optimization. Methods. 2018 Feb 1;134-135:11-19. [Content Brief]

Calculators
Concentration (start) × Volume (start) = Concentration (final) × Volume (final)


MitoTracker Green FM (solution) Related Classifications
HY-DY1032 Related Classifications
 Powered by Bioz