



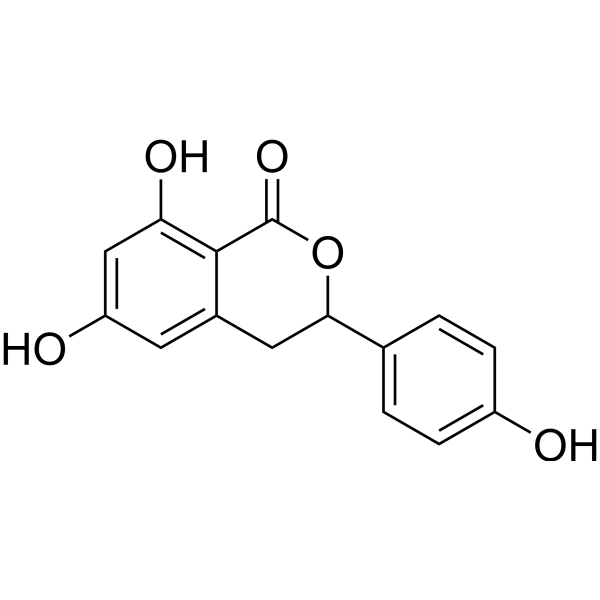
Thunberginol C
Thunberginol C is an orally active, selective, and non-competitive inhibitor of AChE and BChE, with IC50 values of 41.96 and 42.36 μM, respectively. Thunberginol C exerts cytoprotective, pro-collagen type I restorative, MMP-1 inhibitory, hyaluronic acid restorative, anti-photoaging effects in skin cells. Thunberginol C exerts neuroprotective, anxiolytic, TNF-α inhibitory, neuroinflammation inhibitory, and oxidative stress inhibitory effects. Thunberginol C can be used for the research of Alzheimer’s disease, UVB-induced skin photoaging, allergic reactions, oral bacterial infections, and stress-induced anxiety.
연구목적의 판매만을 진행합니다. 환자를 대상으로 한 판매는 하지 않습니다.
- CAS No.: 147517-06-4
- 화학식: C15H12O5
- 분자량:272.25
-
보관:
Please store the product under the recommended conditions in the Certificate of Analysis.

To place orders, for customer services and technical support, please contact: MedChemExpress USA
Tel: 609-228-6898 E-mail: [email protected] [email protected]


-
 Biological Activity
-
Chemical Information
- Protocol
- 순도&문서
- References
-
 Help & FAQs




Biological Activity
제품 설명
|
AChE 41.96 μM (IC50) |
BChE 42.36 μM (IC50) |
MMP-1 |
In Vitro
Thunberginol C non-competitively inhibits acetylcholinesterase (AChE) with an IC50 of 41.96 μM and a Ki of 45.6 μM via van der Waals interactions at the enzyme's peripheral anionic site[1].
Thunberginol C non-competitively inhibits butyrylcholinesterase (BChE) with an IC50 of 42.36 μM and a Ki of 49.2 μM via a hydrogen bond and hydrophobic interactions at the enzyme's peripheral anionic site[1].
Thunberginol C (1 μM; 24 h) significantly increases cell viability, type I procollagen and hyaluronic acid production and inhibits MMP-1 production in UVB-irradiated Hs68 human foreskin fibroblast[2].
Thunberginol C (10 ppm) inhibits the growth of Bacteroides melaninogenicus and Fusobacterium nucleatum oral bacteria, with an MIC of 10 ppm for both species[3].
Thunberginol C inhibits antigen-induced contraction of tracheal chain isolated from sensitized guinea pig, while showing little inhibition for histamine-induced contraction[3].
Thunberginol C (1-30 μM; 24 h) protects primary cortical neurons against Corticosterone (HY-B1618)-induced cell death[4].
MedChemExpress (MCE) has not independently confirmed the accuracy of these methods. They are for reference only. Further protocols information, click here.
-
Cell Line:UVB-irradiated Hs68 human foreskin fibroblasts
-
Concentration:1 μM
-
Incubation Time:24 h
-
Result:Restored type I procollagen production to 76.80% of non-irradiated control levels from UVB-induced 63.38%.\nReduced UVB-induced MMP-1 production to 108.97% of non-irradiated control levels from 396.10%.\n
Increased hyaluronic acid production to 80.54% of non-irradiated control levels from UVB-induced 58.29%, with no statistical significance.
-
Cell Line:Neuronal cells
-
Concentration:1; 3; 10; 30 μM
-
Incubation Time:24 h
-
Result:Protected primary cortical neurons against Corticosterone-induced cell death.
In Vivo
MedChemExpress (MCE) has not independently confirmed the accuracy of these methods. They are for reference only.
-
Animal Model:Male CD-1 mice (chronic restraint stress model)[4]
-
Dosage:2; 20 mg/kg
-
Administration:p.o.; daily; 14 days
-
Result:Significantly improved the restraint stress-induced decrease in percentage of time spent in open arms and percentage of open arm entries, without affecting total arm entries at both 2 mg/kg and 20 mg/kg.
Significantly inhibited the restraint stress-induced increase in plasma TNF-α concentration at 20 mg/kg, but did not affect plasma corticosterone concentration.
Dose-dependently reduced the restraint stress-induced increase in Iba-1-labeled area in the hippocampus at both 2 mg/kg and 20 mg/kg.
Significantly reduced the restraint stress-induced increase in hippocampal TBARS levels, and significantly increased the activities of hippocampal superoxide dismutase, glutathione peroxidase, and glutathione reductase that were decreased by restraint stress at 20 mg/kg.


Chemical Information
-
CAS No. 147517-06-4
-
분자량 272.25
-
화학식 C15H12O5
-
SMILES
O=C1C2=C(O)C=C(O)C=C2CC(C3=CC=C(O)C=C3)O1
-
Structure Classification
-
Initial Source
-
선적
Room temperature in continental US; may vary elsewhere.
-
보관
Please store the product under the recommended conditions in the Certificate of Analysis.

Protocol
-
Mitochondrial membrane-potential fluorescent assay
Mitochondrial membrane potential fluorescent assays estimate ΔΨm in living cells using lipophilic cationic dyes such as TMRM, TMRE, rhodamine 123, and JC-1, which accumulate in mitochondria according to membrane polarization; loss of signal after FCCP or CCCP treatment is interpreted as mitochondrial depolarization. TMRM/TMRE and rhodamine 123 are commonly used for semi-quantitative live-cell microscopy or flow cytometry, while JC-1 can report a shift from red aggregate fluorescence to green monomer fluorescence during depolarization; interpretation requires controls because dye concentration, quenching mode, cell type, dye efflux, and mitochondrial mass can affect fluorescence independently of ΔΨm.
-
ROS/oxidative-stress fluorescent staining
ROS/oxidative-stress fluorescent staining uses cell-permeant fluorogenic probes that become fluorescent after oxidation inside cells or tissues; commonly used examples include DCFH-DA/DCFDA for broad cellular oxidant detection, DHE for superoxide-related signal detection, MitoSOX for mitochondrial superoxide-related signal detection, and CellROX probes for oxidative-stress-associated fluorescence readouts. The assay detects probe oxidation rather than a single ROS species unless the probe and analysis method have been chemically validated for that species. DCFH-DA enters cells, is deacetylated by intracellular esterases to DCFH, and produces fluorescent DCF after oxidation, so the readout is used as an operational measure of total cellular oxidative stress rather than a species-specific ROS measurement. DHE and MitoSOX can report superoxide-related oxidation, but red fluorescence alone can include non-specific ethidium-like oxidation products; HPLC or optimized spectral approaches are
-
Mitochondrial membrane-potential and mitochondrial mass staining
Mitochondrial membrane potential staining measures the electrochemical polarization across the mitochondrial inner membrane in live cells using lipophilic cationic fluorescent probes; early rhodamine-based work showed that selective mitochondrial dye accumulation is lost when the mitochondrial transmembrane potential is dissipated. JC-1 reports mitochondrial polarization by shifting from green monomer fluorescence to red J-aggregate fluorescence as dye concentration increases within energized mitochondria; therefore, the red/green fluorescence ratio is used as a relative readout of mitochondrial membrane potential. TMRE or TMRM staining provides a single-channel relative readout because these cationic rhodamine esters accumulate in polarized mitochondria, and lower fluorescence indicates reduced mitochondrial polarization when acquisition and dye-loading conditions are controlled. Mitochondrial mass staining is commonly performed with MitoTracker Green FM or related MitoTracker dyes as
-
Research Protocol for Neurological Diseases
PINK1/Parkin-mediated mitophagy pathway is a mitochondrial quality-control signaling axis in which mitochondrial depolarization stabilizes PINK1 on damaged mitochondria, activates Parkin recruitment and E3 ubiquitin ligase activity, promotes ubiquitination of outer mitochondrial membrane proteins, recruits selective autophagy adaptors, and drives lysosomal degradation of damaged mitochondria. In neurological disease research, this pathway is experimentally important because neurons, especially dopaminergic neurons, are highly dependent on mitochondrial integrity, and defective mitochondrial turnover can lead to mitochondrial dysfunction, oxidative stress, impaired neuronal survival, α-synuclein accumulation, and neuroinflammatory damage-associated signals. The genetic disease link is strongest in Parkinson’s disease because mutations in PRKN/parkin cause autosomal recessive juvenile parkinsonism, mutations in PINK1 cause hereditary early-onset Parkinson’s disease, and Drosophila studie


순도&문서
References
[1]. Hwang J, et al. Discovery of Natural Inhibitors of Cholinesterases from Hydrangea: In Vitro and In Silico Approaches. Nutrients. 2021 Jan 17;13(1):254. [Content Brief]
[2]. Shin JS, et al. Chemical Constituents from Leaves of Hydrangea serrata and Their Anti-photoaging Effects on UVB-Irradiated Human Fibroblasts. Biol Pharm Bull. 2019;42(3):424-431. [Content Brief]
[4]. Lee J, et al. Hydrangea macrophylla and Thunberginol C Attenuate Stress-Induced Anxiety in Mice. Antioxidants (Basel). 2022 Jan 26;11(2):234. [Content Brief]
[5]. Şahin H, et al. Two new phenolic compounds and some biological activities of Scorzonera pygmaea Sibth. & Sm. subaerial parts. Nat Prod Res. 2020 Mar;34(5):621-628. [Content Brief]

Calculators
Concentration (start) × Volume (start) = Concentration (final) × Volume (final)


Thunberginol C Related Classifications
HY-N1151 Related Classifications
 Powered by Bioz
Keywords
- Thunberginol C
- 147517-06-4
- Bacterial
- Cholinesterase (ChE)
- MMP
- TNF Receptor
- Bacteroides melaninogenicus
- peripheral anionic site
- UVB-induced skin photoaging
- Alzheimer’s disease
- CD-1 mice
- Hs68 human foreskin fibroblasts
- Fusobacterium nucleatum
- butyrylcholinesterase
- primary cortical neurons
- acetylcholinesterase
- Inhibitor
- inhibitor
- inhibit