



Acetic acid lead
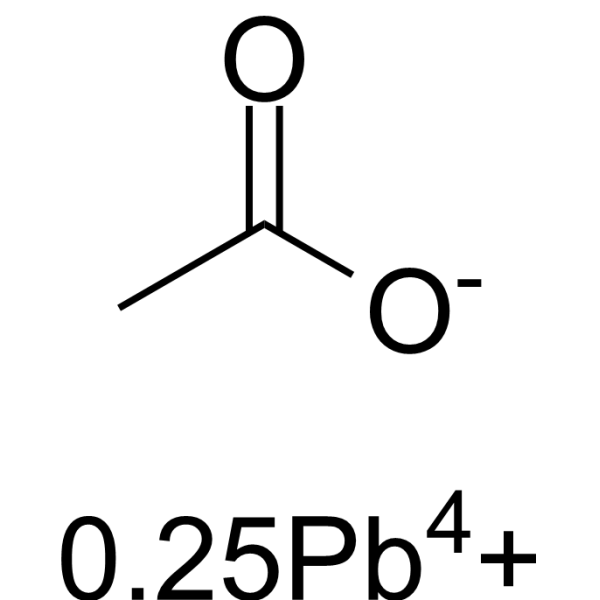
Acetic acid lead is a carboxylic acid and short-chain fatty acid (SCFAs). Magnesium acetate tetrahydrate activates AMPK, increases ROS, cleaved caspase 9, PPARα, downregulates SREBP-1c, ChREBP expression. Acetic acid lead exhibits antifungal activity against Saccharomyces cerevisiae W303-1A. Acetic acid lead regulates energy metabolism. Acetic acid lead has anticancer activity against gastric cancer. Acetic acid lead induces writhing reaction and ulcerative colitis. Acetic acid lead can be used in the researches for gastric cancer, ulcerative colitis, hepatic steatosis, and pain.
For research use only. We do not sell to patients.
- CAS No.: 546-67-8
- Formula: C2H4O2.1/4Pb
- Molecular Weight:447.43
-
Storage:
Please store the product under the recommended conditions in the Certificate of Analysis.

To place orders, for customer services and technical support, please contact: MedChemExpress USA
Tel: 609-228-6898 E-mail: [email protected] [email protected]


-
 Biological Activity
-
Chemical Information
- Protocols
- Purity & Documentation
- References
-
 Help & FAQs







Biological Activity
Description
In Vitro
Acetic acid lead (Acetic acid; 2-5 µM; 24 h) induces cancer cell-selective death in gastric cancer cells (RGK1) via oxidative stress, while having minor effects on normal gastric mucosal cells (RGM1)[3].
Acetic acid lead (Acetic acid; 20-200 mM; 200 min) induces programmed cell death in Saccharomyces cerevisiae W303-1A[4].
Acetic acid lead (Acetic acid; 5 mM; 15 d) suppresses the increase in disaccharidase activity (sucrase, maltase, trehalase, lactase) in Caco-2 cells without affecting cell growth or glucose transport[5].
Acetic acid lead (Acetic acid; 8-7.2 mM; 3 h) activates the AMPKα signaling pathway by consuming ATP to increase the AMP/ATP ratio in bovine hepatocytes, upregulating lipid oxidation genes, downregulating lipogenic genes, and reducing intracellular triglyceride content[6].
MedChemExpress (MCE) has not independently confirmed the accuracy of these methods. They are for reference only. Further protocols information, click here.
-
Cell Line:Rat gastric mucosal cells (RGM1), cancerous gastric mucosal cells (RGK1)
-
Concentration:0, 1, 2, 5, 10, 20 µM
-
Incubation Time:24 h
-
Result:Increased monocarboxylic transporter 1 (MCT1) and cleaved caspase 9 in RGK1 cells.
Showed minor effects in RGM1 cells.
In Vivo
Acetic acid lead (5% v/v; i.r.; single dose) induces severe ulcerative colitis in male Kunming mice, characterized by high mortality, increased disease activity index, colon tissue damage, elevated neutrophil infiltration, and upregulated pro-inflammatory cytokine and NF-κB p65 expression[8].
MedChemExpress (MCE) has not independently confirmed the accuracy of these methods. They are for reference only.
-
Animal Model:C57BL/6J (male, 20-33g)[7]
-
Dosage:0.10%; 0.18%; 0.32%; 0.56%
-
Administration:i.p.; single dose
-
Result:Reduced Ensure consumption to 0.09 g/g body weight at 0.32% dose, significantly lower than control 0.14 g/g body weight.
Reduced Ensure consumption to 0.03 g/g body weight at 0.56% dose, significantly lower than control 0.14 g/g body weight.
Induced a mean of approximately 32 writhes over 20 minutes at 0.56% dose.
Produced significant feeding-suppressant effects at 0 and 60 minutes post-administration with 0.56% dose, which were no longer apparent by 240 minutes post-administration.
-
Animal Model:Kunming mice (male, 20-25 g)[8]
-
Dosage:5% v/v
-
Administration:i.r.; single dose
-
Result:Caused severe colitis with bloody diarrhea, poor coat quality, dramatic body weight loss, reduced mobility, and gross blood adhesion to the anus.
Resulted in a high mortality rate.
Led to 78.44% colon area affected.
Caused wet colon weight/length of 162.8 mg/cm.
Resulted in a macroscopic score of ~3.8.
Induced a histological score of ~3.9.
Increased colonic MPO activity to ~2.4 U/g tissue.
Elevated serum and colonic TNF-α and IL-6.
Distinctly elevated p65 NF-κB protein expression compared to normal controls.


Chemical Information
-
CAS No. 546-67-8
-
Molecular Weight 447.43
-
Formula C2H4O2.1/4Pb
-
SMILES
CC([O-])=O.[0.25Pb4+]
-
Structure Classification
-
Initial Source
-
Shipping
Room temperature in continental US; may vary elsewhere.
-
Storage
Please store the product under the recommended conditions in the Certificate of Analysis.

Protocols
-
RNA extraction experimental
By lysing cells, releasing RNA, and removing impurities such as proteins and DNA, high-purity RNA products are finally obtained. The commonly used traditional method is the guanidine isothiocyanate/phenol/chloroform method (Trizol), which is suitable for a variety of animal materials including animal tissues, microorganisms, cultured cells, etc., and most plant materials.
-
ROS/oxidative-stress fluorescent staining
ROS/oxidative-stress fluorescent staining uses cell-permeant fluorogenic probes that become fluorescent after oxidation inside cells or tissues; commonly used examples include DCFH-DA/DCFDA for broad cellular oxidant detection, DHE for superoxide-related signal detection, MitoSOX for mitochondrial superoxide-related signal detection, and CellROX probes for oxidative-stress-associated fluorescence readouts. The assay detects probe oxidation rather than a single ROS species unless the probe and analysis method have been chemically validated for that species. DCFH-DA enters cells, is deacetylated by intracellular esterases to DCFH, and produces fluorescent DCF after oxidation, so the readout is used as an operational measure of total cellular oxidative stress rather than a species-specific ROS measurement. DHE and MitoSOX can report superoxide-related oxidation, but red fluorescence alone can include non-specific ethidium-like oxidation products; HPLC or optimized spectral approaches are
-
DSS-Induced Colitis
Dextran sulfate sodium (DSS)-induced colitis is generated by administering DSS in mouse drinking water, producing epithelial injury, barrier disruption, weight loss, diarrhea, fecal blood, colon shortening, histologic mucosal damage, and inflammatory mediator changes; the model is mainly used to study acute or chronic intestinal inflammation resembling selected features of ulcerative colitis. DSS injury is interpreted through clinical and tissue readouts rather than a single molecular endpoint: daily body weight, stool consistency, and bleeding are combined into a disease activity index, while colon length, histology, cytokines, myeloperoxidase activity, intestinal permeability, and tight-junction markers provide complementary measures of inflammation and barrier damage.
-
TNBS-Induced Colitis
TNBS-induced colitis is produced by intrarectal delivery of 2,4,6-trinitrobenzene sulfonic acid in ethanol, where ethanol disrupts the mucosal barrier and TNBS haptenates colonic proteins, generating immune-mediated colonic inflammation with weight loss, diarrhea, ulceration, transmural injury, inflammatory-cell infiltration, and cytokine responses. The model is used as an experimental intestinal inflammation model with Crohn’s disease–like features, especially when Th1-type responses, IL-12–dependent inflammation, chronic relapsing inflammation, or fibrosis-related endpoints are studied.
-
Apoptosis Solutions
Apoptosis is a regulated, generally non-lytic cell-death pathway that removes unwanted, damaged, infected, or abnormal cells through coordinated morphological changes, caspase activation, DNA fragmentation, and membrane remodeling. The intrinsic apoptosis pathway is controlled mainly by mitochondrial outer membrane permeabilization, BCL-2 family proteins, cytochrome c release, apoptosome formation, caspase-9 activation, and downstream executioner caspase-3/7 activation. The extrinsic apoptosis pathway is initiated by death receptors such as Fas, TNFR, and TRAIL receptors, which recruit adaptor proteins and activate caspase-8 before engaging executioner caspases or mitochondrial amplification through BID cleavage. Apoptosis is linked to many phenotypes, including cancer cell killing, tissue homeostasis, immune regulation, neurodegeneration, infection response, and treatment-induced cytotoxicity; unresolved questions include how apoptosis interacts with necroptosis, pyroptosis, ferroptos
-
Liver Histomorphometry
Liver histomorphometry is a quantitative histological approach used to measure structural alterations in hepatic tissue, including parenchymal loss, steatosis, fibrosis, and vascular remodeling, by combining stained tissue section analysis with stereological or computerized image-based measurements. Classical morphometric frameworks quantify volume fractions of liver compartments and fibrotic regions using systematic sampling and image analysis, enabling objective comparison of pathological changes across experimental groups. These approaches are widely applied in liver cirrhosis and fibrosis studies to reduce subjectivity in histological scoring and improve reproducibility of tissue evaluation. Recent methodological advances integrate automated image analysis and radiomics-based extraction of histological features from standard liver stains (e. g. , H&E and fibrotic stains), enabling quantitative correlation between morphometric features and fibrosis stages in non-alcoholic fatty live


Purity & Documentation
References
[1]. Syka JE, et al. Peptide and protein sequence analysis by electron transfer dissociation mass spectrometry. Proc Natl Acad Sci U S A. 2004 Jun 29;101(26):9528-33. [Content Brief]
[3]. Terasaki M, et al. Acetic acid is an oxidative stressor in gastric cancer cells. J Clin Biochem Nutr. 2018 Jul;63(1):36-41. [Content Brief]
[4]. Ludovico P, et al. Saccharomyces cerevisiae commits to a programmed cell death process in response to acetic acid. Microbiology (Reading). 2001 Sep;147(Pt 9):2409-2415. [Content Brief]
[5]. Ogawa N, et al. Acetic acid suppresses the increase in disaccharidase activity that occurs during culture of caco-2 cells. J Nutr. 2000 Mar;130(3):507-13. [Content Brief]
[6]. Li X, et al. Acetic acid activates the AMP-activated protein kinase signaling pathway to regulate lipid metabolism in bovine hepatocytes. PLoS One. 2013 Jul 4;8(7):e67880. [Content Brief]
[7]. Stevenson GW, et al. Targeting pain-suppressed behaviors in preclinical assays of pain and analgesia: effects of morphine on acetic acid-suppressed feeding in C57BL/6J mice. J Pain. 2006 Jun;7(6):408-16. [Content Brief]
[8]. Niu X, et al. Protective effect of sanguinarine against acetic acid-induced ulcerative colitis in mice. Toxicol Appl Pharmacol. 2013 Mar 15;267(3):256-65. [Content Brief]
[9]. Granado-Serrano AB, et al. Faecal bacterial and short-chain fatty acids signature in hypercholesterolemia. Sci Rep. 2019 Feb 11;9(1):1772. [Content Brief]

Calculators
Concentration (start) × Volume (start) = Concentration (final) × Volume (final)


Acetic acid lead Related Classifications
HY-Y0319D Related Classifications
 Powered by Bioz