



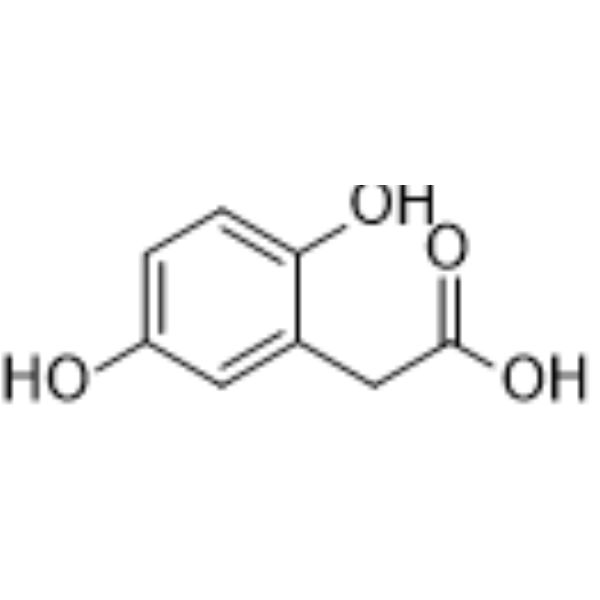
Homogentisic acid
Based on 1 publication(s) in Google Scholar
Homogentisic acid is an orally active, blood-brain barrier-permeable amyloidogenic compound that functions as both an amyloid component and a pigment precursor. Accumulation of homogentisic acid downregulates tight junction proteins (such as claudin-5, occludin, ZO-1) and impairs blood-brain barrier integrity. Homogentisic acid and its oxidation product benzoquinone acetic acid not only induce the aggregation and fibrosis of multiple proteins (such as Aβ1-42, α-synuclein, SAA, Transthyretin (TTR), atrial natriuretic peptide), but also trigger oxidative stress, damage to the Wnt/β-catenin pathway, and neurotoxicity, leading to ochronosis pigment deposition and synaptic dysfunction. At specific concentrations, homogentisic acid exerts no cytotoxicity or genotoxicity on human peripheral blood lymphocytes, and even counteracts the genotoxicity induced by Irinotecan (HY-16562). Homogentisic acid serves as an important tool molecule for investigating the mechanisms of diseases including ochronosis, secondary amyloidosis, Alzheimer's disease, and colorectal cancer.
For research use only. We do not sell to patients.
- Purity : 99.68%
- CAS No.: 451-13-8
- Formula: C8H8O4
- Molecular Weight:168.15
-
Storage:Powder -20°C, 3 years , 4°C, 2 years ; In solvent -80°C, 6 months , -20°C, 1 month

To place orders, for customer services and technical support, please contact: MedChemExpress USA
Tel: 609-228-6898 E-mail: [email protected] [email protected]


-
 Biological Activity
-
Chemical Information
-
Solvent & Solubility
- Protocols
- Purity & Documentation
- References
-
 Help & FAQs


-
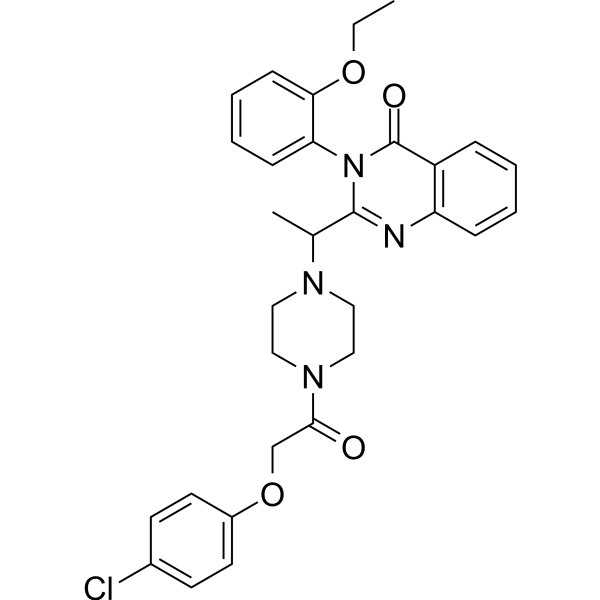
HY-15763
ErastinFerroptosis Inducer -
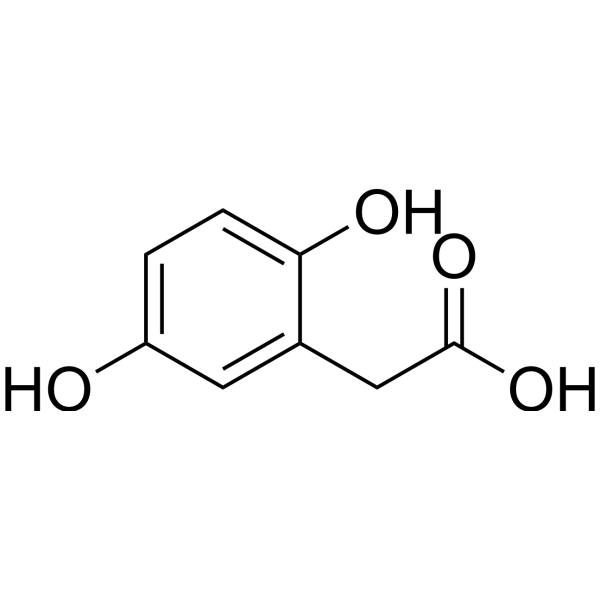
HY-113283R
Homogentisic acid (Standard)Endogenous Metabolite -
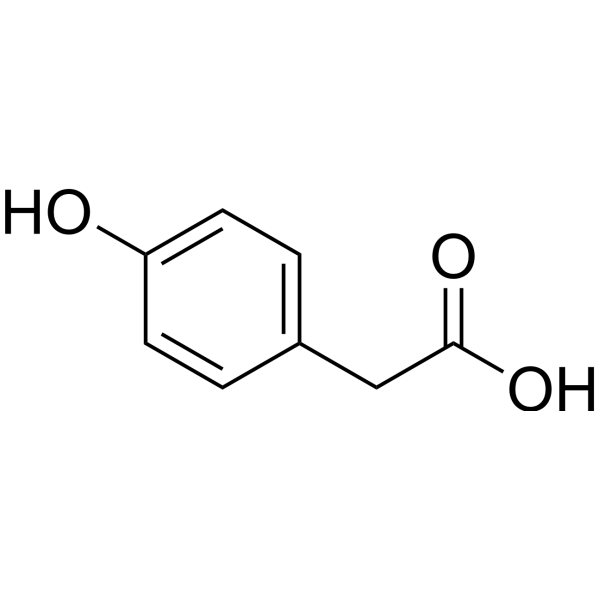
HY-N1902
4-Hydroxyphenylacetic acidEndogenous Metabolite -
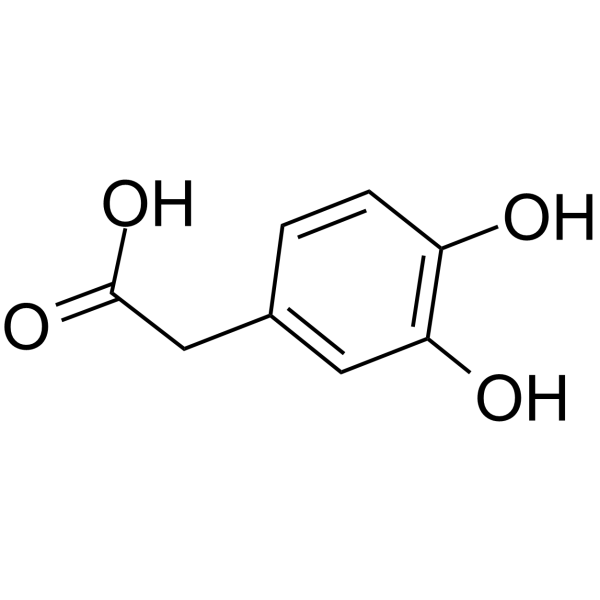
HY-W001080
3,4-Dihydroxybenzeneacetic acid -
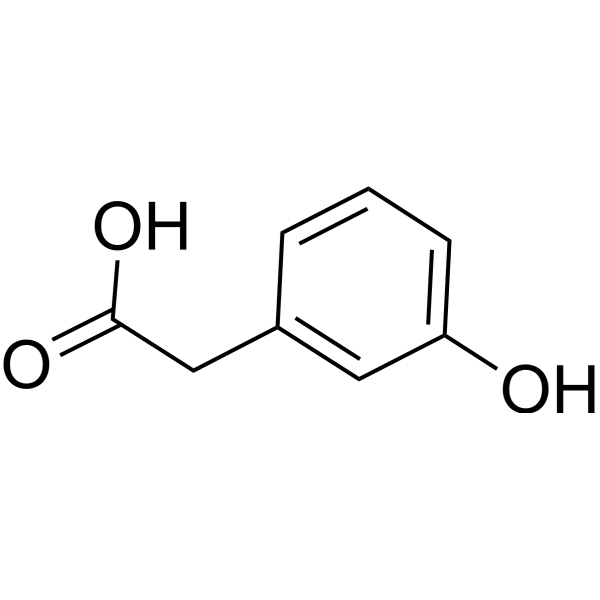
HY-W001083
3-Hydroxyphenylacetic acidFlavonoid Metabolite -
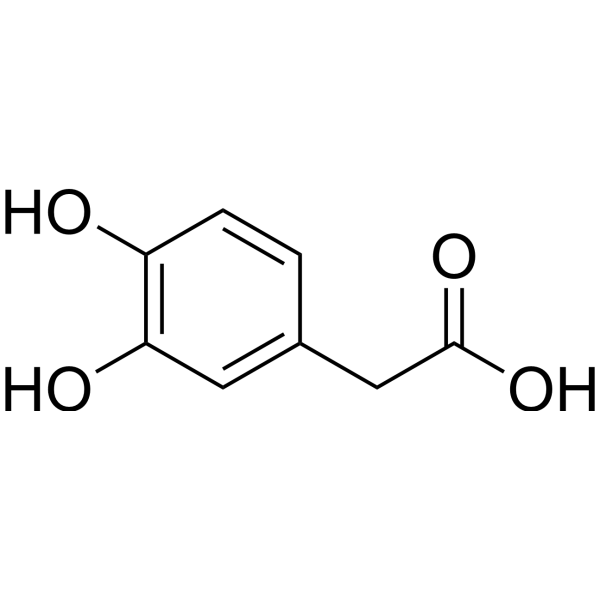
HY-W001080R
3,4-Dihydroxybenzeneacetic acid (Standard) -

HY-N1902R
4-Hydroxyphenylacetic acid (Standard)Endogenous Metabolite -
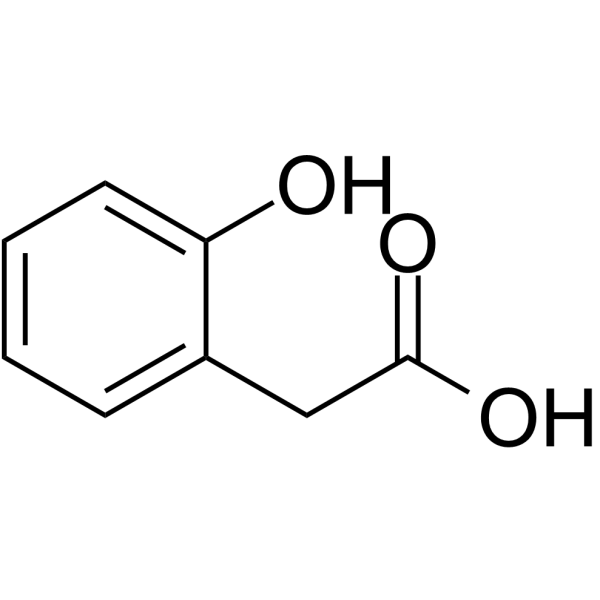
HY-W015590
2-Hydroxyphenylacetic acidPhenylalanine/Tyrosine Metabolite -
HY-W010062
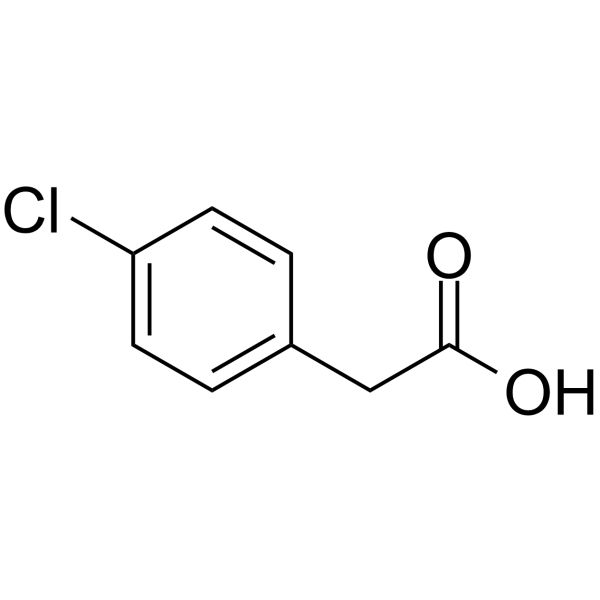
4-Chlorophenylacetic acidAromatase Antagonist -

HY-W001146
3-Chloro-4-hydroxyphenylacetic acidBuilding Block -

HY-W015590R
2-Hydroxyphenylacetic acid (Standard)Standard Of 2-Hydroxyphenylacetic Acid -

HY-W001083R
3-Hydroxyphenylacetic acid (Standard)Standard of 3-Hydroxyphenylacetic acid
Publications Citing Use of MedChemExpress (MCE) Homogentisic acid
MoreAll α-synuclein Isoforms
More

Biological Activity
Description
IC50 & Target
|
NPR-A |
In Vitro
Homogentisic acid (0.165-0.33 mM; 37 °C; 2-6 d) induces time- and dose-dependent aggregation of Aβ1-42 peptide, α-Syn, and Ttr proteins. During days 2-6, homogentisic acid reduces the monomer level of Aβ1-42 and increases high molecular weight (HMW) aggregates; after days 7-14, homogentisic acid generates a unique 24 kDa product from α-Syn; and during days 1-5, homogentisic acid elevates oligomer levels[1].
Homogentisic acid (0.33 mM; 37 °C; 14 d+14 d) increases the abundance and maturity of SAA amyloid fibrils, forming thick filament bundles and slender protofibrils, and promotes further growth of pre-aggregated SAA fibrils upon re-stimulation; it also induces α-Syn protein to form protofibrillar aggregates, spherical oligomers, and curvilinear fibrils[1].
Homogentisic acid (0.165-0.66 mM; 37 °C; 7 d for α-Syn assay, 14 d for SAA assay) promotes the formation of benzoquinone acetic acid (BQA)-protein adducts in α-Syn after 7 days and in SAA after 14 days[1].
Homogentisic acid (0.01 μM) induces Aβ aggregation in HT22 neuronal cells, SY5Y neuronal cells, and primary neuron cultures without significant cytotoxicity[2].
Homogentisic acid (0.01-0.5 μM) downregulates tight junction proteins (claudin-5, occludin, ZO-1) in a dose-dependent manner, disrupts junctional structures, and directly impairs the integrity of the blood-brain barrier in primary brain microvascular endothelial cells (BMECs)[2].
Homogentisic acid (0.01 μM; 18 h) transcriptionally suppresses the expression of tight junction proteins (claudin-5, occludin, ZO-1) in HT22 and SY5Y neuronal cells[2].
Homogentisic acid (400 μM; pH 7.45) catalyzes the co-oxidation of ascorbic acid, producing H2O2 and synergistically increasing oxygen consumption[6].
Homogentisic acid (500 μM; 30-90 min) and Fe3+-EDTA generate hydroxyl radicals, and SOD promotes the production of such radicals, whereas catalase, thiourea and sodium formate inhibit their production. Fe3+-EDTA also depolymerizes hyaluronic acid, and hydroxyl radical scavengers and catalase inhibit this degradation process[6].
Homogentisic acid (0.046 mM; 3 w) induces intracellular ochronotic pigment deposition in primary human articular osteoblasts[8].
Homogentisic acid (0.046 mM; 2-4 w) reduces the level of free thiols in primary human articular osteoblasts, decreasing this level by 20% after 2 weeks of treatment and by 50% after 3 and 4 weeks of treatment[8].
Homogentisic acid (0.046 mM; 2-4 w) impairs the Wnt/β-catenin pathway in primary human articular osteoblasts; it increases β-catenin levels by 80% after 2 weeks, while it reduces β-catenin levels by 60% and 40% after 3 and 4 weeks, respectively, and simultaneously increases its phosphorylation levels by 100% and 50%, respectively[8].
MedChemExpress (MCE) has not independently confirmed the accuracy of these methods. They are for reference only. Further protocols information, click here.
-
Cell Line:HT22 neuronal cells, SY5Y neuronal cells
-
Concentration:0.01 μM
-
Incubation Time:18 h
-
Result:Significantly reduced claudin-5, occludin, and ZO-1 mRNA levels in both HT22 and SY5Y cells.
In Vivo
Homogentisic acid (16 mg/kg; tail vein injection; single dose) can efficiently cross the blood-brain barrier of healthy C57BL/6 mice[2].
MedChemExpress (MCE) has not independently confirmed the accuracy of these methods. They are for reference only.
-
Animal Model:APP/PS1 transgenic mice, P301S transgenic mice (2-3 months old, 20-25 g, Alzheimer's disease modeling)[2]
-
Dosage:20 mg/kg; 50 mg/kg
-
Administration:oral gavage; five consecutive days per week; 6 weeks
-
Result:Significantly decreased the novel object recognition discrimination index (50 mg/kg).\nReduced Morris water maze platform crossings and time spent in the target quadrant (20 mg/kg, 50 mg/kg).\n
Significantly shortened auditory fear conditioning freezing time (20 mg/kg, 50 mg/kg).
Downregulated cortical levels of tight junction proteins claudin-5, occludin, and ZO-1, with the greatest reduction observed at 50 mg/kg (20 mg/kg, 50 mg/kg).\n
Caused discontinuous ZO-1 staining and increased blood-brain barrier permeability (measured via Evans Blue extravasation) (50 mg/kg).
Significantly increased cerebral Aβ burden compared with controls (50 mg/kg).\n
Reduced cortical levels of synaptic proteins PSD93 and synaptophysin, with the greatest reduction observed at 50 mg/kg.
Exacerbated cognitive deficits in P301S mice, but effects were less pronounced than in APP/PS1 mice.
-
Animal Model:C57BL/6 mice (2-3 months old, 20-25 g, male)[2]
-
Dosage:16 mg/kg
-
Administration:tail vein injection; single dose
-
Result:Achieved significantly greater concentrations in brain tissue than in vehicle controls, demonstrating efficient blood-brain barrier penetration.


Chemical Information
-
CAS No. 451-13-8
-
Appearance Solid
-
Molecular Weight 168.15
-
Formula C8H8O4
-
Color White to yellow
-
SMILES
O=C(O)CC1=CC(O)=CC=C1O
-
Structure Classification
-
Initial Source
-
Shipping
Room temperature in continental US; may vary elsewhere.
-
Storage
Powder -20°C 3 years 4°C 2 years In solvent -80°C 6 months -20°C 1 month


Publications (1)
-
Journal Impact Factor
-
Most Recent
-
Life Sci
Homogentisic acid metabolism inhibits papillary thyroid carcinoma proliferation through ROS and p21-induced cell cycle arrest. [Abstract]2024 Jun 15:347:122682. PMID: 38702025


Solvent & Solubility
In Vitro:
DMSO : 100 mg/mL (594.71 mM; Need ultrasonic; Hygroscopic DMSO has a significant impact on the solubility of product, please use newly opened DMSO)
H2O : 100 mg/mL (594.71 mM; Need ultrasonic)
Please refer to the solubility information to select the appropriate solvent. Once prepared, please aliquot and store the solution to prevent product inactivation from repeated freeze-thaw cycles.
Storage method and period of stock solution: -80°C, 6 months; -20°C, 1 month. When stored at -80°C, please use it within 6 months. When stored at -20°C, please use it within 1 month.
* Note: If you choose water as the stock solution, please dilute it to the working solution, then filter and sterilize it with a 0.22 μm filter before use.
Please refer to the solubility information to select the appropriate solvent. Once prepared, please aliquot and store the solution to prevent product inactivation from repeated freeze-thaw cycles.
Storage method and period of stock solution: -80°C, 6 months; -20°C, 1 month. When stored at -80°C, please use it within 6 months. When stored at -20°C, please use it within 1 month.
* Note: If you choose water as the stock solution, please dilute it to the working solution, then filter and sterilize it with a 0.22 μm filter before use.
Concentration (start) × Volume (start) = Concentration (final) × Volume (final)
In Vivo:
Select the appropriate dissolution method based on your experimental animal and administration route.
- For the following dissolution methods, please ensure to first prepare a clear stock solution using an In Vitro approach and then sequentially add co-solvents:
- To ensure reliable experimental results, the clarified stock solution can be appropriately stored based on storage conditions. As for the working solution for In Vivo experiments, it is recommended to prepare freshly and use it on the same day.
- The percentages shown for the solvents indicate their volumetric ratio in the final prepared solution. If precipitation or phase separation occurs during preparation, heat and/or sonication can be used to aid dissolution.
Add each solvent one by one: 10% DMSO 40% PEG300 5% Tween-80 45% Saline
Solubility: ≥ 2.5 mg/mL (14.87 mM); Clear solution
This protocol yields a clear solution of ≥ 2.5 mg/mL (saturation unknown).
Taking 1 mL working solution as an example, add 100 μL DMSO stock solution (25.0 mg/mL) to 400 μL PEG300, and mix evenly; then add 50 μL Tween-80 and mix evenly; then add 450 μL Saline to adjust the volume to 1 mL.
Preparation of Saline: Dissolve 0.9 g sodium chloride in ddH₂O and dilute to 100 mL to obtain a clear Saline solution.
Add each solvent one by one: 10% DMSO 90% (20% SBE-β-CD in Saline)
Solubility: ≥ 2.5 mg/mL (14.87 mM); Clear solution
This protocol yields a clear solution of ≥ 2.5 mg/mL (saturation unknown).
Taking 1 mL working solution as an example, add 100 μL DMSO stock solution (25.0 mg/mL) to 900 μL 20% SBE-β-CD in Saline, and mix evenly.
Preparation of 20% SBE-β-CD in Saline (4°C, storage for one week): 2 g SBE-β-CD powder is dissolved in 10 mL Saline, completely dissolve until clear.
In Vivo Dissolution Calculator
Please enter the basic information of animal experiments:
-
-
-
-
Recommended: Prepare an additional quantity of animals to account for potential losses during experiments.
Working solution concentration: 0.22 mg/mL
This product has good water solubility, please refer to the measured solubility data in water/PBS/Saline for details.

Protocols
-
Fibrosis/Collagen Morphometry
Fibrosis and collagen morphometry is based on the quantitative visualization of fibrillar collagen deposition in tissue sections using histochemical stains such as Sirius Red (Picrosirius Red) or Masson's trichrome, followed by image-based or polarization-enhanced analysis to estimate collagen proportional area as a surrogate of extracellular matrix accumulation during fibrotic remodeling. Sirius Red combined with polarized light microscopy enhances detection of collagen fibers due to birefringence properties, enabling more specific visualization of collagen type I and III fibrils compared to conventional bright-field histology, while whole-section or region-restricted digital morphometry reduces field-selection bias in fibrosis assessment. Alternative quantitative approaches include second harmonic generation (SHG) and two-photon excited fluorescence microscopy, which enable label-free detection of fibrillar collagen and have been validated against histological staining and biochemica
-
Collagen: Sirius Red Staining
Sirius Red or picrosirius red staining is a histochemical method for visualizing collagen-rich extracellular matrix in tissue sections, and collagen fibers are detected as red-stained structures under bright-field microscopy with enhanced birefringence under polarized light. Picrosirius red is useful for assessing total collagen organization, distribution, and fibrosis burden, but polarized color should not be interpreted as a definitive collagen type I versus type III readout because color is affected by fiber orientation, thickness, and packing.
-
Neurotoxicity Study
This protocol assesses in vitro neurotoxicity by combining neuronal viability, mitochondrial/metabolic activity, neurite outgrowth, and optional neuronal network function readouts. Calcein-AM or resazurin/PrestoBlue readouts estimate viable or metabolically active cells; βIII-tubulin immunofluorescence detects neuronal morphology and neurite networks; TMRE detects mitochondrial membrane potential; and MEA recordings detect functional changes in neuronal network activity.
-
Cell Cytotoxicity Assay
Cytotoxicity assays are usually based on the assessment of cell membrane damage, which can also be indirectly detected by measuring cell viability. Detection methods include MTT assay, CKK-8 assay, LDH assay and ATP assay, etc.
-
Mammalian live/dead viability and cytotoxicity staining
Live/dead viability and cytotoxicity staining assays are based on the simultaneous detection of intracellular esterase activity in metabolically active (viable) cells and membrane integrity loss in non-viable cells. In commonly used dual-staining approaches, membrane-permeant fluorogenic substrates are converted by intracellular esterases into fluorescent products in live cells, while impermeant DNA-binding dyes selectively enter cells with compromised plasma membranes and label nucleic acids in dead or dying cells, enabling discrimination between viable and non-viable populations by fluorescence microscopy or flow cytometry.
-
ROS/oxidative-stress fluorescent staining
ROS/oxidative-stress fluorescent staining uses cell-permeant fluorogenic probes that become fluorescent after oxidation inside cells or tissues; commonly used examples include DCFH-DA/DCFDA for broad cellular oxidant detection, DHE for superoxide-related signal detection, MitoSOX for mitochondrial superoxide-related signal detection, and CellROX probes for oxidative-stress-associated fluorescence readouts. The assay detects probe oxidation rather than a single ROS species unless the probe and analysis method have been chemically validated for that species. DCFH-DA enters cells, is deacetylated by intracellular esterases to DCFH, and produces fluorescent DCF after oxidation, so the readout is used as an operational measure of total cellular oxidative stress rather than a species-specific ROS measurement. DHE and MitoSOX can report superoxide-related oxidation, but red fluorescence alone can include non-specific ethidium-like oxidation products; HPLC or optimized spectral approaches are
-
Connective Tissue: Masson's Trichrome/Collagen Trichrome Staining
Masson’s Trichrome (collagen/trichrome staining) is a histological technique that differentially stains tissue compartments using sequential acidic dyes to distinguish collagen from muscle and cytoplasmic components based on dye affinity and tissue permeability differences, enabling visualization of fibrosis and connective tissue architecture in histological sections. The classical formulation typically uses Weigert's iron hematoxylin for nuclear staining, Biebrich scarlet-acid fuchsin for cytoplasm and muscle, and aniline blue (or light green variants) for collagen, producing a characteristic blue/green collagen signal contrasted against red cytoplasm and dark nuclei. The staining principle relies on selective displacement of smaller dye molecules by larger anionic dyes in collagen-rich regions under controlled acidified conditions, which enhances collagen-specific dye retention. This property makes the method widely used for fibrosis assessment in organs such as heart, liver, lung, a
-
Transepithelial/transendothelial electrical resistance assay
TEER measures electrical resistance across epithelial or endothelial monolayers cultured on permeable supports, and the readout reflects ionic conductance through the cell barrier, especially the paracellular pathway regulated by junctional integrity. TEER can be measured without destroying the monolayer and is commonly used before or during transport, permeability, barrier-disruption, and barrier-maturation experiments. TEER values are influenced by biological maturation and technical conditions; reported factors include temperature, medium formulation, passage number, electrode geometry, membrane properties, and junctional length during early monolayer maturation. Therefore, TEER should be interpreted with blank-insert subtraction, area normalization, repeated readings, and, when possible, orthogonal barrier readouts such as FITC-dextran flux or tight-junction staining.
-
Amyloid: Congo Red Amyloid Staining
Congo red amyloid staining is a histochemical method used to detect extracellular amyloid deposits in tissue sections based on the affinity of Congo red dye for β-pleated sheet-rich protein aggregates. When bound to amyloid, Congo red produces characteristic apple-green birefringence under polarized light microscopy, which is widely regarded as a diagnostic feature of amyloid deposition in histopathology. The diagnostic principle relies on the combination of dye binding (congophilia) and optical anisotropy under polarized illumination, which distinguishes amyloid from most non-amyloid eosinophilic extracellular deposits in routine histological evaluation. Amyloid identification by Congo red staining remains a cornerstone in diagnostic pathology despite the availability of adjunct methods such as immunohistochemistry and mass spectrometry, particularly because of its ability to localize deposits directly within tissue architecture. The specificity of Congo red-positive deposits is incre
-
Genotoxicity/Mutagenicity Study
The bacterial reverse mutation assay detects point mutations that restore amino-acid prototrophy in auxotrophic Salmonella typhimurium or Escherichia coli tester strains; after exposure to a test article, mutagenic activity is read out as an increased number of revertant colonies on minimal agar compared with the vehicle control. The assay uses tester strains with different mutation targets so that base-substitution and frameshift mutagens can be detected, and testing is performed with and without exogenous mammalian metabolic activation because some chemicals require biotransformation to become mutagenic.
-
Cell Viability Determination by MTT Colorimetric Assay
The following protocol uses the MTT colorimetric assay as a classic literature-established method for assessing cell viability/metabolic activity in cultured mammalian cells. MTT[3-(4,5-dimethylthiazol-2-yl)-2,5-diphenyltetrazolium bromide] is reduced by metabolically active cells to a colored formazan product; the amount of formazan is quantified spectrophotometrically and provides an indirect measure of metabolically active viable cells. Importantly, MTT reduction reflects cellular oxidoreductase/metabolic activity rather than an absolute direct count of living cells, so changes in cellular metabolism can alter the signal independently of cell number.
-
Alzheimer’s Disease Modeling
Alzheimer’s Disease (AD) is a neurodegenerative disorder characterized by a progressive decline in cognitive functions and loss of specific types of neurons and synapses. Alzheimer's symptoms can be simulated in mice by injecting drugs (such as Aβ) or genetically modified.


Purity & Documentation
-
Data Sheet (285 KB)
-
SDS (396 KB)
- English - EN (396 KB)
- Français - FR (396 KB)
- Deutsch - DE (396 KB)
- Norwegian - NO (396 KB)
- Español - ES (396 KB)
- Swedish - SV (396 KB)
- Italian - IT (396 KB)
- Korean - KR (396 KB)
- Portuguese - PT (396 KB)
-
Handling Instructions (2659 KB)
References
[1]. Braconi D, et al. Homogentisic acid induces aggregation and fibrillation of amyloidogenic proteins. Biochim Biophys Acta Gen Subj. 2017;1861(2):135-146. [Content Brief]
[2]. Liu X, et al. Homogentisic Acid Disrupts the Blood-Brain Barrier and Promotes Aβ Aggregation in Alzheimer's Disease. Curr Med Sci. Published online February 5, 2026. [Content Brief]
[3]. Zannoni VG, et al. Oxidation of homogentisic acid to ochronotic pigment in connective tissue. Biochim Biophys Acta. 1969 Feb 18;177(1):94-105. [Content Brief]
[4]. MILCH RA, et al. Atmospheric oxidation of homogentisic acid: spectrophotometric studies. Science. 1957 Aug 2;126(3266):209-10. [Content Brief]
[5]. Huong DT, et al. Homogentisic acid derivatives from Miliusa balansae. J Nat Prod. 2004;67(3):445-447. [Content Brief]
[6]. Martin JP Jr, et al. Homogentisic acid autoxidation and oxygen radical generation: implications for the etiology of alkaptonuric arthritis. Free Radic Biol Med. 1987;3(4):241-250. [Content Brief]
[7]. Bory C, et al. Diagnosis of alcaptonuria: rapid analysis of homogentisic acid by HPLC. Clin Chim Acta. 1990;189(1):7-11. [Content Brief]
[8]. Schiavone ML, et al. Homogentisic acid affects human osteoblastic functionality by oxidative stress and alteration of the Wnt/β-catenin signaling pathway. J Cell Physiol. 2020;235(10):6808-6816. [Content Brief]


Complete Stock Solution Preparation Table
Please refer to the solubility information to select the appropriate solvent. Once prepared, please aliquot and store the solution to prevent product inactivation from repeated freeze-thaw cycles.
Storage method and period of stock solution: -80°C, 6 months; -20°C, 1 month. When stored at -80°C, please use it within 6 months. When stored at -20°C, please use it within 1 month.
| Optional Solvent | Concentration Solvent Mass | 1 mg | 5 mg | 10 mg | 25 mg |
|---|---|---|---|---|---|
| DMSO / H2O | 1 mM | 5.9471 mL | 29.7354 mL | 59.4707 mL | 148.6768 mL |
| 5 mM | 1.1894 mL | 5.9471 mL | 11.8941 mL | 29.7354 mL | |
| 10 mM | 0.5947 mL | 2.9735 mL | 5.9471 mL | 14.8677 mL | |
| 15 mM | 0.3965 mL | 1.9824 mL | 3.9647 mL | 9.9118 mL | |
| 20 mM | 0.2974 mL | 1.4868 mL | 2.9735 mL | 7.4338 mL | |
| 25 mM | 0.2379 mL | 1.1894 mL | 2.3788 mL | 5.9471 mL | |
| 30 mM | 0.1982 mL | 0.9912 mL | 1.9824 mL | 4.9559 mL | |
| 40 mM | 0.1487 mL | 0.7434 mL | 1.4868 mL | 3.7169 mL | |
| 50 mM | 0.1189 mL | 0.5947 mL | 1.1894 mL | 2.9735 mL | |
| 60 mM | 0.0991 mL | 0.4956 mL | 0.9912 mL | 2.4779 mL | |
| 80 mM | 0.0743 mL | 0.3717 mL | 0.7434 mL | 1.8585 mL | |
| 100 mM | 0.0595 mL | 0.2974 mL | 0.5947 mL | 1.4868 mL |
* Note: If you choose water as the stock solution, please dilute it to the working solution, then filter and sterilize it with a 0.22 μm filter before use.


Homogentisic acid Related Classifications
HY-113283 Related Classifications
 Powered by Bioz