



BODIPY FL-DHPE

Based on 1 Customer Validation
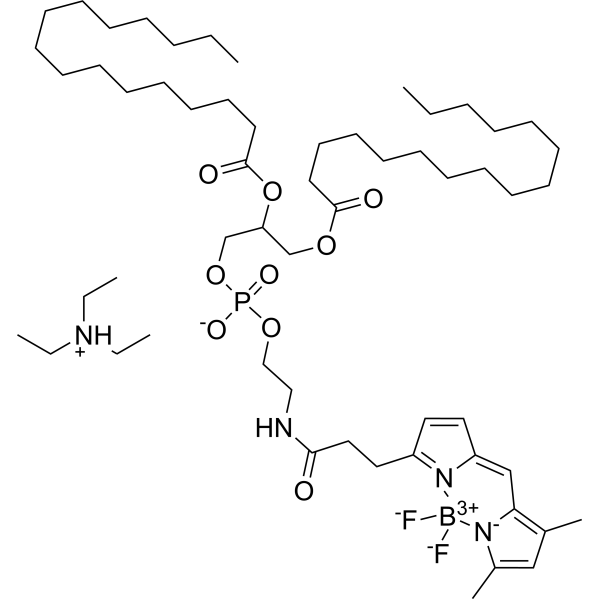
BODIPY FL-DHPE is a fluorescent lipid probe composed of phosphatidylethanolamine (DHPE) labeled with a BODIPY FL fluorophore, which is used for fluorescent labeling of cell membranes, differentiation between liposome membrane fusion and endocytic pathways, and studies of membrane dynamics. The two C16 alkyl chains of BODIPY FL-DHPE insert into the lipid bilayer of membranes, and its fluorescence exhibits concentration dependence: it exists as monomers and emits green fluorescence at low mole fractions; it forms dimers with a red-shifted emission peak at high mole fractions; this spectral change is independent of enzymes, pH, and membrane potential. When liposomes enter the plasma membrane via membrane fusion, the dye is diluted, leading to attenuation of the dimer peak and enhancement of the monomer peak; when entry occurs via endocytosis, the dye remains in endosomes at high concentration with no change in the dimer peak, allowing differentiation between the two uptake pathways. Ex = 488 nm; monomer Em = 515 nm, dimer Em ≈ 620 nm.
For research use only. We do not sell to patients.
- Purity : 95.0%
- CAS No.: 217075-07-5
- Formula: C57H102BF2N4O9P
- Molecular Weight:1067.22
-
Storage:
4°C, sealed storage, away from moisture and light
* In solvent : -80°C, 6 months; -20°C, 1 month (sealed storage, away from moisture and light)

To place orders, for customer services and technical support, please contact: MedChemExpress USA
Tel: 609-228-6898 E-mail: [email protected] [email protected]


-
 Biological Activity
-
Chemical Information
- Protocols
- Purity & Documentation
- References
-
 Help & FAQs




Biological Activity
Description
In Vitro
Operating Instructions (The following is a recommended experimental protocol for guidance only, and should be adjusted according to your specific requirements)
1. Stock Solution Preparation
1.1 Solvent: Chloroform.
1.2 Concentration Recommendation: The mixing molar ratio of BODIPY FL-DHPE to DOPE/DOTAP is 1/1/0.01-0.1 mol/mol.
1.3 Notes: Avoid repeated freeze-thaw cycles.
2. Working Solution Preparation
2.1 Diluent: The liposome stock solution is diluted with PBS (pH 7.4) (1/50 dilution) for cell incubation; it can also be diluted with cell culture medium (1/100 dilution).
2.2 Working Concentration: The total lipid concentration is 0.02 mg/mL (for the lipid mixture stock solution).
2.3 Notes: Adjust the working solution concentration as needed; prepare it immediately before use.
3. Staining Procedure
3.1 Sample Type Description: CHO cells, HEK293 cells, myofibroblasts, cortical neurons, macrophages, smooth muscle cells, keratinocytes, HeLa cells, MEF, etc.
3.2 Incubation Conditions: Aspirate the culture medium, add the diluted liposome solution (pH 7.4), and incubate in a 37 °C, 5% CO2 incubator.
3.3 Washing Steps: After incubation, directly replace with fresh medium for imaging; before flow cytometry detection, digest cells with trypsin-EDTA for 2-5 min, wash with PBS (pH 7.4), and centrifuge at 200 ×g for 5 min.
4. Control Setup
4.1 Unstained Control: Use untreated cells to adjust the photomultiplier tube voltage, so that the signal intensity of green and red channels is lower than 10 counts, thereby eliminating cell autofluorescence.
4.2 Endocytosis Control: Prepare non-fusogenic (endocytic) liposomes by replacing DOPE with DMPC as a control for the endocytic pathway; cells treated with endocytic liposomes show punctate green signals, with a high dimer/monomer ratio.
5. Detection and Analysis
5.1 Instrument Types: Laser confocal microscope and flow cytometer.
5.2 Excitation/Emission Wavelengths
5.2.1 Confocal Microscope: Excitation at 488 nm, BP 495-550 nm (monomer / green), LP 619 nm (dimer / red).
5.2.2 Flow Cytometer: Excitation at 488 nm, 525/30 nm (monomer / green), 690/50 nm (dimer / red).
5.2.3 Fluorescence Spectrophotometer: Excitation at 488 nm, emission at 500-700 nm.
5.3 Result Analysis
5.3.1 Changes in Fluorescence Intensity: After membrane fusion, BODIPY FL-DHPE dilutes in the plasma membrane, leading to enhanced fluorescence at the monomer peak (515 nm) and weakened fluorescence at the dimer peak (620 nm); after endocytosis, the dye remains in endosomes with high local concentration, so the dimer peak remains unchanged. The fluorescence intensity ratio of green/red channels serves as a reliable indicator of cellular uptake pathways (fusion vs endocytosis).
5.3.2 Fluorescence Localization: During membrane fusion, fluorescence distributes uniformly across the entire plasma membrane, clearly outlining the cell; during endocytosis, fluorescence shows punctate distribution inside the cell, corresponding to endosomal localization.
5.3.3 Color Changes: At low concentrations (≤5 mol%), green monomer fluorescence dominates; at high concentrations (≥5 mol%), red dimer fluorescence appears. After fusion, the red dimer signal weakens while the green monomer signal enhances; during endocytosis, the ratio of red to green signals remains unchanged.
MedChemExpress (MCE) has not independently confirmed the accuracy of these methods. They are for reference only. Further protocols information, click here.
Emission (Em)
511


Chemical Information
-
CAS No. 217075-07-5
-
Appearance Solid
-
Molecular Weight 1067.22
-
Formula C57H102BF2N4O9P
-
Color Orange to red
-
SMILES
[F-][B+3]1([F-])[N]2=C(CCC(NCCOP(OCC(OC(CCCCCCCCCCCCCCC)=O)COC(CCCCCCCCCCCCCCC)=O)([O-])=O)=O)C=CC2=CC3=C(C)C=C(C)[N-]13.CC[NH+](CC)CC
-
Shipping
Room temperature in continental US; may vary elsewhere.
-
Storage
4°C, sealed storage, away from moisture and light
* In solvent : -80°C, 6 months; -20°C, 1 month (sealed storage, away from moisture and light)

Protocols
-
Fluorescent plasma-membrane potential dye assay
Fluorescent plasma-membrane potential dye assays measure changes in cell membrane potential using voltage-sensitive dyes whose fluorescence changes when cells depolarize or hyperpolarize. Anionic bis-oxonol dyes such as DiBAC4(3) enter depolarized cells more readily and show increased fluorescence after intracellular binding, while hyperpolarization reduces dye accumulation and fluorescence. FMP/FLIPR membrane-potential dyes are used for faster, homogeneous microplate assays of ion-channel or receptor-mediated membrane-potential changes.


Purity & Documentation
-
Data Sheet (294 KB)
-
SDS (252 KB)
- English - EN (252 KB)
- Français - FR (252 KB)
- Deutsch - DE (252 KB)
- Norwegian - NO (252 KB)
- Español - ES (252 KB)
- Swedish - SV (252 KB)
- Italian - IT (252 KB)
- Korean - KR (252 KB)
- Portuguese - PT (252 KB)
-
Handling Instructions (2659 KB)
References

Calculators
Concentration (start) × Volume (start) = Concentration (final) × Volume (final)


BODIPY FL-DHPE Related Classifications
HY-D1602 Related Classifications
 Powered by Bioz