



MMPP

Based on 1 Customer Validation
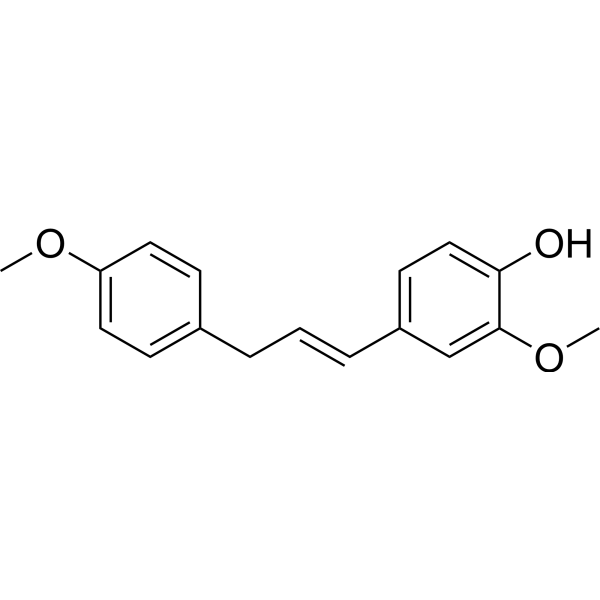
MMPP is an orally active inhibitor of STAT3 and VEGFR2, as well as an activator of PPARγ. MMPP blocks the VEGFR2/AKT/ERK/NF-κB signaling pathway to inhibit angiogenesis. MMPP inhibits ferroptosis and inflammation, and alleviates sepsis-induced myocardial injury. MMPP induces G1-phase cell cycle arrest and apoptosis, and inhibits the growth of non-small cell lung cancer (NSCLC) and solid tumors. MMPP promotes adipogenesis and glucose uptake. MMPP can be used in research related to NSCLC, type 2 diabetes and myocardial injury.
For research use only. We do not sell to patients.
- Purity : 98.06%
- CAS No.: 1895957-18-2
- Formula: C17H18O3
- Molecular Weight:270.32
-
Storage:Powder -20°C, 3 years , 4°C, 2 years ; In solvent -80°C, 6 months , -20°C, 1 month

To place orders, for customer services and technical support, please contact: MedChemExpress USA
Tel: 609-228-6898 E-mail: [email protected] [email protected]


-
 Biological Activity
-
Chemical Information
-
Solvent & Solubility
- Protocols
- Purity & Documentation
- References
-
 Help & FAQs


All VEGFR Isoforms
More

Biological Activity
Description
|
STAT3 |
VEGFR2 |
PPARγ |
In Vitro
MMPP inhibits the viability of NCI-H460 non-small cell lung cancer cells, with an IC50 value of 12.3 μg/mL[1].
MMPP (10 μg/mL; 1.5 h) inhibits the VEGFR2/AKT/ERK signaling pathway in HUVECs by reducing the phosphorylation levels of VEGFR2, AKT and ERK[2].
MMPP (10 μg/mL; 16 h) significantly inhibits VEGFA-induced angiogenesis in HUVECs[2].
MMPP (10 μg/mL; 2 h) inhibits VEGFA-induced nuclear translocation of NF-κB p65 in HUVECs[2].
MMPP (10 μg/mL; 24 h) significantly inhibits VEGFA-induced migration of human umbilical vein endothelial cells (HUVECs) in scratch wound healing assays[2].
MMPP (10 μg/mL; 25 h) significantly downregulates the mRNA expression of VEGFA, VEGFR2, MMP2 and MMP9 in HUVECs[2].
MMPP (100 μg/mL; 12.5 h) reduces the Ptgs2 mRNA expression level in neonatal rat ventricular myocytes treated with LPS after 12 h of incubation[4].
MMPP (100 μg/mL; 12.5 h) reduces the PTGS2 protein expression level in LPS-treated neonatal rat ventricular myocytes after 12 h of incubation[4].
MMPP (7.5-15 μg/mL; 2-8 days) dose-dependently promotes lipid accumulation in differentiated 3T3-L1 MBX adipocytes[3].
MMPP (7.5-15 μg/mL; 2-8 days) enhances the expression of adipogenesis-related genes and reduces Il6 mRNA levels in mature 3T3-L1 MBX adipocytes[3].
MMPP (7.5-15 μg/mL; 2-8 days) enhances the expression of adipogenesis-related proteins in fully differentiated 3T3-L1 MBX adipocytes[3].
MMPP (7.5-15 μg/mL; 2-8 days) upregulates the expression of C/ebpb mRNA in early-stage (day 2) 3T3-L1 MBX adipocytes[3].
MMPP (7.5-15 μg/mL; 2-8 days) upregulates the expression of C/EBPβ protein in early-stage (day 2) 3T3-L1 MBX adipocytes[3].
MMPP (100 μg/mL; 12.5 h) maintains the mitochondrial membrane potential of lipopolysaccharide-treated neonatal rat ventricular cardiomyocytes after 12 h of incubation[4].
MMPP (100 μg/mL; 12.5 h) reduces the MDA level in neonatal rat ventricular myocytes treated with LPS after 12 h of incubation[4].
MMPP (100 μg/mL; 12.5 h) restores SOD levels in LPS-treated neonatal rat ventricular myocytes after 12 hours of incubation[4].
MMPP (100-1000 mg/L) scavenges O2•- in a cell-free system, with a scavenging rate of 61.24% at 1000 mg/L[4].
MMPP (100-500 mg/L; 1 h) chelates Fe2+ in a cell-free system, with a chelating efficiency of up to 51.0% at the concentration of 500 mg/L[4].
MMPP (40-200 mg/L) scavenges •OH in a cell-free system, with a scavenging rate of 48.14% at 200 mg/L[4].
MMPP (5-100 mg/L; 10 min) potently scavenges ABTS•+ in a cell-free system, and achieves nearly complete inhibition at a concentration of 100 mg/L[4].
MedChemExpress (MCE) has not independently confirmed the accuracy of these methods. They are for reference only.
-
Cell Line:multiple cancer cell lines (colon: HCT116, SW480; prostate: PC3, LNCaP; ovary: PA-1, SK-OV-3; liver: Hep-G2, Huh-7; breast: MCF-7; skin: SK-MEL-28; lung: A549, NCI-H460) and non-cancerous LL-24 lung epithelial cells
-
Concentration:5, 10, 15 and 20 μg/mL
-
Incubation Time:24 h
-
Result:Significantly reduced viability of all tested cancer cell lines at 10 μg/mL.
Reduced viability of NCI-H460 cells in a concentration-dependent manner with an IC50 of 11.99 μg/mL.
Showed no toxicity to non-cancerous LL-24 lung epithelial cells at tested concentrations.
-
Cell Line:NCI-H460 and A549 NSCLC cells
-
Concentration:5, 10 and 15 μg/mL
-
Incubation Time:24 h
-
Result:Induced apoptosis in NCI-H460 and A549 cells in a concentration-dependent manner, with the apoptotic index increasing from near 0% in vehicle controls to ~60% at 15 μg/mL MMPP in NCI-H460 cells.
-
Cell Line:NCI-H460 and A549 NSCLC cells
-
Concentration:5, 10 and 15 μg/mL
-
Incubation Time:24 h
-
Result:Increased expression of pro-apoptotic proteins Bax, cleaved caspase-3, and cleaved caspase-8, and decreased expression of anti-apoptotic protein Bcl-2 in a concentration-dependent manner.
Increased expression of cell cycle inhibitor p21, and decreased expression of CDK6 and cyclin D1 in a concentration-dependent manner.
-
Cell Line:NCI-H460 and A549 NSCLC cells transfected with wild-type or T456A mutant STAT3
-
Concentration:10 μg/mL
-
Incubation Time:24 h
-
Result:Inhibited viability and induced G1-phase cell cycle arrest in cells transfected with wild-type STAT3, but these inhibitory effects were attenuated in cells transfected with STAT3-T456A mutant.
-
Cell Line:human umbilical vein endothelial cells (HUVECs)
-
Concentration:10 μg/mL
-
Incubation Time:24 h
-
Result:Resulted in a wider scratched area compared to VEGFA-stimulated controls.
Significantly inhibited VEGFA-induced HUVEC migration.
-
Cell Line:human umbilical vein endothelial cells (HUVECs)
-
Concentration:10 μg/mL
-
Incubation Time:1 h pre-incubation, followed by 30 min VEGFA stimulation
-
Result:Reduced the phosphorylation levels of VEGFR2, AKT, and ERK.
Left total protein levels unchanged.
-
Cell Line:human umbilical vein endothelial cells (HUVECs)
-
Concentration:10 μg/mL
-
Incubation Time:1 h pre-incubation, followed by 24 h VEGFA stimulation
-
Result:Significantly suppressed the mRNA expressions of VEGFA, VEGFR2, MMP2, and MMP9.
-
Cell Line:fully differentiated 3T3-L1 MBX adipocytes
-
Concentration:7.5 and 15 μg/mL
-
Incubation Time:added on day 2, day 4, and day 6 of differentiation, with incubation through day 8
-
Result:Increased the protein expression levels of adipogenic transcription factors (PPARγ, C/EBPα) and markers (GLUT4, FAS, ACC) in a dose-dependent manner, compared to the MDI-only control group.
-
Cell Line:early-stage (day 2) 3T3-L1 MBX adipocytes
-
Concentration:7.5 and 15 μg/mL
-
Incubation Time:48 h (from day 0 to day 2 of differentiation)
-
Result:Increased the mRNA expression level of C/ebpb in a dose-dependent manner, with significantly higher levels at 15 μg/mL compared to the MDI-only control group.
-
Cell Line:early-stage (day 2) 3T3-L1 MBX adipocytes
-
Concentration:7.5 and 15 μg/mL
-
Incubation Time:48 h (from day 0 to day 2 of differentiation)
-
Result:Increased the protein expression level of C/EBPβ in a dose-dependent manner, with significantly higher levels at both tested concentrations compared to the MDI-only control group.
-
Cell Line:3T3-L1 MBX cells
-
Concentration:7.5 and 15 μg/mL
-
Incubation Time:1 h (co-treatment with MDI)
-
Result:Enhanced the phosphorylation levels of AKT, GSK3, and AMPKα in a dose-dependent manner, with significantly higher phosphorylation levels at both tested concentrations compared to the MDI-only control group.
-
Cell Line:H9c2 cells
-
Concentration:100 μg/mL
-
Incubation Time:12 h (after 30 min LPS pre-treatment)
-
Result:Restored H9c2 cell viability from ~60% (LPS-treated group) to ~90% relative to the control group.
-
Cell Line:neonatal rat ventricular cardiomyocytes
-
Concentration:100 μg/mL
-
Incubation Time:12 h (after 30 min LPS pre-treatment)
-
Result:Reduced Ptgs2 mRNA levels from ~3.5-fold change (LPS-treated group) to ~2-fold change relative to the control group.
-
Cell Line:neonatal rat ventricular cardiomyocytes
-
Concentration:100 μg/mL
-
Incubation Time:12 h (after 30 min LPS pre-treatment)
-
Result:Reduced PTGS2 protein levels from ~1.8-fold change (LPS-treated group) to ~1-fold change relative to the control group.
Restored cytoplasmic Cyt c levels from ~0.7 relative units (vs. mitochondrial VDAC1) to ~1 relative unit, and reduced levels from ~1 relative unit (vs. cytoplasmic GAPDH) to ~0.3 relative units.
In Vivo
MMPP (5 mg/kg; i.p.; twice weekly; for 3 consecutive weeks) inhibits tumor growth and STAT3 activity in BALB/c nude mice bearing A549 non-small cell lung cancer xenografts[1].
MMPP (5 mg/kg; i.p.; twice weekly; for 3 consecutive weeks) inhibits tumor growth and STAT3 activity in BALB/c nude mice bearing HCT116 colon cancer xenografts[1].
MMPP (5 mg/kg; p.o.; three times per week; for 1 month) significantly inhibits tumor growth in patient-derived NSCLC xenograft models in immunodeficient mice by suppressing STAT3 activity, with no observed toxicity[1].
MedChemExpress (MCE) has not independently confirmed the accuracy of these methods. They are for reference only.
-
Animal Model:BALB/c nude mice[1]
-
Dosage:2.5 mg/kg; 5 mg/kg
-
Administration:i.p.; twice a week; 3 weeks; p.o.; three times a week; 3 weeks
-
Result:Significantly reduced tumor volume and weight compared to vehicle controls at 2.5 mg/kg i.p..
Produced a greater, dose-dependent reduction in tumor volume and weight at 5 mg/kg i.p..
Significantly inhibited tumor growth at 5 mg/kg p.o..
Reduced expression of p-STAT3, PCNA, and cyclin D1, and increased active caspase-3 in treated tumors via immunohistochemical staining.
Decreased levels of Cdk4, Cdk6, cyclin D1, and Bcl-2, and increased levels of Bax, cleaved caspase-3, and cleaved caspase-8 in tumor tissues via western blot analysis.
Inhibited STAT3 DNA-binding activity and nuclear translocation of p-STAT3 in tumor tissues.
-
Animal Model:Immunodeficient mice[1]
-
Dosage:5 mg/kg
-
Administration:p.o.; three times a week; 1 month
-
Result:Significantly reduced final tumor volume and weight compared to vehicle controls.
Suppressed p-STAT3 expression in tumor tissues via immunohistochemical analysis.
Inhibited STAT3 DNA-binding activity and reduced nuclear translocation of p-STAT3 via EMSA and western blot analysis.
Showed no signs of body weight loss or liver toxicity in treated animals.
-
Animal Model:BALB/c nude mice[1]
-
Dosage:5 mg/kg
-
Administration:i.p.; twice a week; 3 weeks
-
Result:Effectively suppressed tumor growth and STAT3 activity in A549 xenograft tumors.
-
Animal Model:BALB/c nude mice[1]
-
Dosage:5 mg/kg
-
Administration:i.p.; twice a week; 3 weeks
-
Result:Effectively suppressed tumor growth and STAT3 activity in HCT116 xenograft tumors.
-
Animal Model:BALB/c nude mice[1]
-
Dosage:5 mg/kg
-
Administration:i.p.; twice a week; 3 weeks
-
Result:Effectively suppressed tumor growth and STAT3 activity in PA-1 xenograft tumors.
Demonstrated superior antitumor activity to cisplatin (5 mg/kg) and similar antitumor activity to docetaxel (5 mg/kg).
-
Animal Model:C57BL/6J (adult male, 7-8 weeks old, 18 g-20 g, intravenous injection of 10 mg/kg LPS to induce sepsis)[4]
-
Dosage:1 mg
-
Administration:i.v.; single dose
-
Result:Increased 14-day survival rate significantly compared to the LPS-only group.
Reduced serum CK-MB from ~10000 pg/mL to ~5000 pg/mL.
Reduced serum LDH from ~45 U/mL to ~25 U/mL.
Restored left ventricular ejection fraction (EF%) from ~40% to ~60%.
Restored left ventricular fractional shortening (FS%) from ~20% to ~30%.
Reduced cardiac Ptgs2 mRNA fold change from ~7 to ~2.
Reduced cardiac PTGS2 protein fold change from ~2 to ~1.
Reduced cardiac MDA levels from ~650 nmol/g protein to ~400 nmol/g protein.
Increased cardiac SOD levels from ~25 U/g protein to ~35 U/g protein.
Reduced cardiac iron levels from ~8 μmol/g protein to ~6 μmol/g protein.
Reduced serum IL-1β from ~30 pg/mL to ~10 pg/mL.
Reduced serum TNF-α from ~80 pg/mL to ~30 pg/mL.
Reduced serum IL-6 from ~35000 pg/mL to ~20000 pg/mL.
Alleviated sepsis-induced cardiac inflammation, hemorrhage, and structural disorders.
- Human pluripotent stem cell endothelial-cell differentiation
- Vascular/Branching Fractal Analysis
- Annexin V plus membrane-impermeant dye apoptosis staining
- BrdU Incorporation Assay
- Protocol for Cell Cycle
- Research Protocol for Inflammation-related Diseases
- Research Protocol for Metabolic Diseases
- 3T3-L1 preadipocyte-to-adipocyte differentiation
- Detection of Apoptosis
- TUNEL staining for apoptotic DNA fragmentation
- LPS-Induced Endotoxemia/Systemic Inflammation
- Flow cytometric DNA-content cell-cycle staining
- Endothelial Tube Formation Assay
- Apoptosis Solutions
- Ferroptosis Solutions
- Endothelial Cell Migration/Angiogenic Sprouting Assay
- Lipid Droplets: Oil Red O/Sudan Dye Lipid Staining


Chemical Information
-
CAS No. 1895957-18-2
-
Appearance Solid
-
Molecular Weight 270.32
-
Formula C17H18O3
-
Color Off-white to light brown
-
SMILES
OC1=CC=C(C=C1OC)/C=C/CC2=CC=C(C=C2)OC
-
Shipping
Room temperature in continental US; may vary elsewhere.
-
Storage
Powder -20°C 3 years 4°C 2 years In solvent -80°C 6 months -20°C 1 month


Solvent & Solubility
In Vitro:
DMSO : 100 mg/mL (369.93 mM; Need ultrasonic; Hygroscopic DMSO has a significant impact on the solubility of product, please use newly opened DMSO)
Please refer to the solubility information to select the appropriate solvent. Once prepared, please aliquot and store the solution to prevent product inactivation from repeated freeze-thaw cycles.
Storage method and period of stock solution: -80°C, 6 months; -20°C, 1 month. When stored at -80°C, please use it within 6 months. When stored at -20°C, please use it within 1 month.
Please refer to the solubility information to select the appropriate solvent. Once prepared, please aliquot and store the solution to prevent product inactivation from repeated freeze-thaw cycles.
Storage method and period of stock solution: -80°C, 6 months; -20°C, 1 month. When stored at -80°C, please use it within 6 months. When stored at -20°C, please use it within 1 month.
Concentration (start) × Volume (start) = Concentration (final) × Volume (final)
In Vivo:
Select the appropriate dissolution method based on your experimental animal and administration route.
- For the following dissolution methods, please ensure to first prepare a clear stock solution using an In Vitro approach and then sequentially add co-solvents:
- To ensure reliable experimental results, the clarified stock solution can be appropriately stored based on storage conditions. As for the working solution for In Vivo experiments, it is recommended to prepare freshly and use it on the same day.
- The percentages shown for the solvents indicate their volumetric ratio in the final prepared solution. If precipitation or phase separation occurs during preparation, heat and/or sonication can be used to aid dissolution.
Add each solvent one by one: 10% DMSO 40% PEG300 5% Tween-80 45% Saline
Solubility: ≥ 2.5 mg/mL (9.25 mM); Clear solution
This protocol yields a clear solution of ≥ 2.5 mg/mL (saturation unknown).
Taking 1 mL working solution as an example, add 100 μL DMSO stock solution (25.0 mg/mL) to 400 μL PEG300, and mix evenly; then add 50 μL Tween-80 and mix evenly; then add 450 μL Saline to adjust the volume to 1 mL.
Preparation of Saline: Dissolve 0.9 g sodium chloride in ddH₂O and dilute to 100 mL to obtain a clear Saline solution.
Add each solvent one by one: 10% DMSO 90% (20% SBE-β-CD in Saline)
Solubility: ≥ 2.5 mg/mL (9.25 mM); Clear solution
This protocol yields a clear solution of ≥ 2.5 mg/mL (saturation unknown).
Taking 1 mL working solution as an example, add 100 μL DMSO stock solution (25.0 mg/mL) to 900 μL 20% SBE-β-CD in Saline, and mix evenly.
Preparation of 20% SBE-β-CD in Saline (4°C, storage for one week): 2 g SBE-β-CD powder is dissolved in 10 mL Saline, completely dissolve until clear.
In Vivo Dissolution Calculator
Please enter the basic information of animal experiments:
-
-
-
-
Recommended: Prepare an additional quantity of animals to account for potential losses during experiments.
Please enter your animal formula composition:
-
%DMSO +
Recommended: Keep the proportion of DMSO in working solution below 2% if your animal is weak.
-
%+
-
+%Tween-80 + +
-
%Saline +
The co-solvents required include: DMSO, . All of co-solvents are available by MedChemExpress (MCE). , Tween 80. All of co-solvents are available by MedChemExpress (MCE).
Working solution concentration: 0.22 mg/mL
Method for preparing stock solution: mg drug dissolved in μL DMSO. Stock solution concentration: mg/mL.
1. Take μL DMSO stock solution;
2. Add μL .
μL , mix evenly;
3. Then add μL Tween 80, mix evenly;
4. Then add μL
Please ensure that the stock solution in the first step is dissolved to a clear state, and add co-solvents in sequence. You can use ultrasonic heating (ultrasonic cleaner, recommended frequency 20-40 kHz), vortexing, etc. to assist dissolution.


Purity & Documentation
-
Data Sheet (304 KB)
-
SDS (393 KB)
- English - EN (393 KB)
- Français - FR (393 KB)
- Deutsch - DE (393 KB)
- Norwegian - NO (393 KB)
- Español - ES (393 KB)
- Swedish - SV (393 KB)
- Italian - IT (393 KB)
- Korean - KR (393 KB)
- Portuguese - PT (393 KB)
-
Handling Instructions (2659 KB)
References
[1]. Son DJ, et al. MMPP Attenuates Non-Small Cell Lung Cancer Growth by Inhibiting the STAT3 DNA-Binding Activity Direct Binding to the STAT3 DNA-Binding Domain. Theranostics. 2017;7(18):4632-4642. [Content Brief]
[2]. Kim NY, et al. MMPP is a novel VEGFR2 inhibitor that suppresses angiogenesis via VEGFR2/AKT/ERK/NF-κB pathway. BMB reports. 2024 May;57(5):244-249. [Content Brief]
[3].
Kim NY, et al. MMPP promotes adipogenesis and glucose uptake via binding to the PPARγ ligand binding domain in 3T3-L1 MBX cells. Front Pharmacol. 2022 Oct 21;13:994584.
[Content Brief]
[4]. Liu C, et al. Melanin nanoparticles alleviate sepsis-induced myocardial injury by suppressing ferroptosis and inflammation. Bioactive materials. 2023 Jun;24:313-321. [Content Brief]


Complete Stock Solution Preparation Table
Please refer to the solubility information to select the appropriate solvent. Once prepared, please aliquot and store the solution to prevent product inactivation from repeated freeze-thaw cycles.
Storage method and period of stock solution: -80°C, 6 months; -20°C, 1 month. When stored at -80°C, please use it within 6 months. When stored at -20°C, please use it within 1 month.
| Optional Solvent | Concentration Solvent Mass | 1 mg | 5 mg | 10 mg | 25 mg |
|---|---|---|---|---|---|
| DMSO | 1 mM | 3.6993 mL | 18.4966 mL | 36.9932 mL | 92.4830 mL |
| 5 mM | 0.7399 mL | 3.6993 mL | 7.3986 mL | 18.4966 mL | |
| 10 mM | 0.3699 mL | 1.8497 mL | 3.6993 mL | 9.2483 mL | |
| 15 mM | 0.2466 mL | 1.2331 mL | 2.4662 mL | 6.1655 mL | |
| 20 mM | 0.1850 mL | 0.9248 mL | 1.8497 mL | 4.6241 mL | |
| 25 mM | 0.1480 mL | 0.7399 mL | 1.4797 mL | 3.6993 mL | |
| 30 mM | 0.1233 mL | 0.6166 mL | 1.2331 mL | 3.0828 mL | |
| 40 mM | 0.0925 mL | 0.4624 mL | 0.9248 mL | 2.3121 mL | |
| 50 mM | 0.0740 mL | 0.3699 mL | 0.7399 mL | 1.8497 mL | |
| 60 mM | 0.0617 mL | 0.3083 mL | 0.6166 mL | 1.5414 mL | |
| 80 mM | 0.0462 mL | 0.2312 mL | 0.4624 mL | 1.1560 mL | |
| 100 mM | 0.0370 mL | 0.1850 mL | 0.3699 mL | 0.9248 mL |


MMPP Related Classifications
HY-119487 Related Classifications
 Powered by Bioz