



Verruculogen

Based on 1 Customer Validation
Verruculogen is a tremorgenic mycotoxin and inhibitor of the M phase of the mammalian cell cycle. Verruculogen is produced by Penicillium and Aspergillus species. Verruculogen enhances the binding of ChTX to maxi-k channels with a K1/2 value of 170 nM. Verruculogen inhibits the amplitude of Ca2+-activated K+ currents. Verruculogen induces severe tremors in infected animals.
For research use only. We do not sell to patients.
- Purity : 98.08%
- CAS No.: 12771-72-1
- Formula: C27H33N3O7
- Molecular Weight:511.57
-
Storage:Powder -20°C, 3 years , 4°C, 2 years ; In solvent -80°C, 6 months , -20°C, 1 month

To place orders, for customer services and technical support, please contact: MedChemExpress USA
Tel: 609-228-6898 E-mail: [email protected] [email protected]


-
 Biological Activity
-
Chemical Information
-
Solvent & Solubility
- Protocols
- Purity & Documentation
- References
-
 Help & FAQs


-
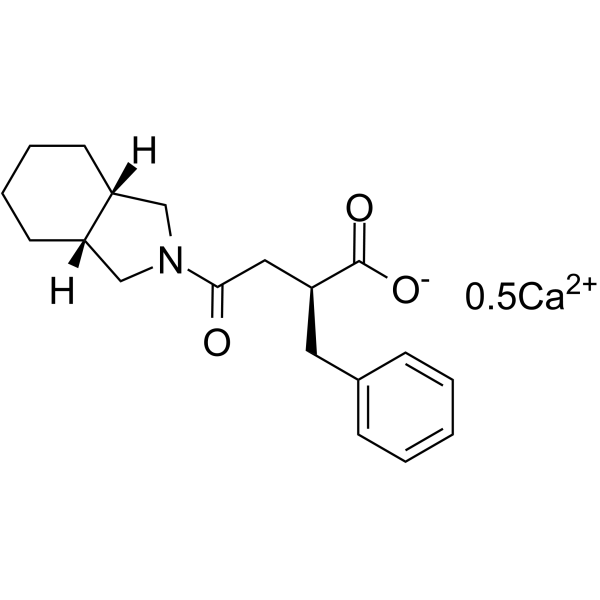
HY-17398
Mitiglinide calciumK(ATP) Channel Antagonist -
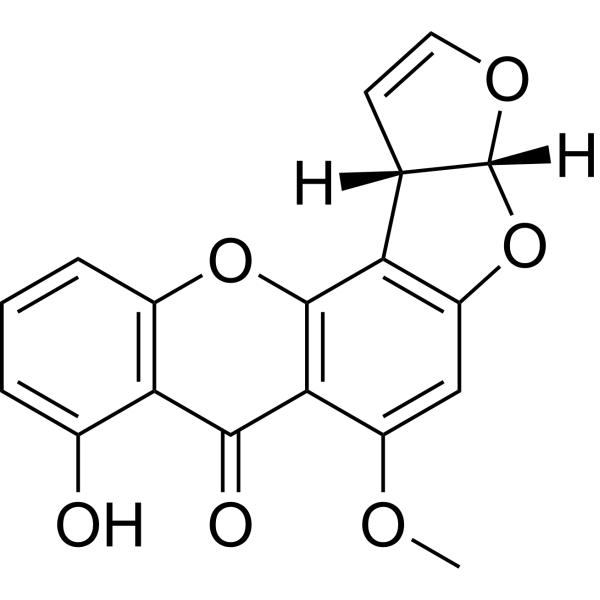
HY-N6725
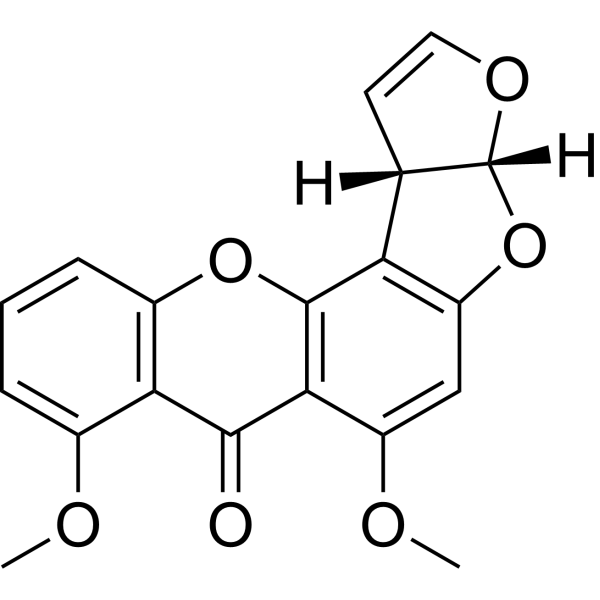
SterigmatocystineDNA Synthesis Inhibitor -
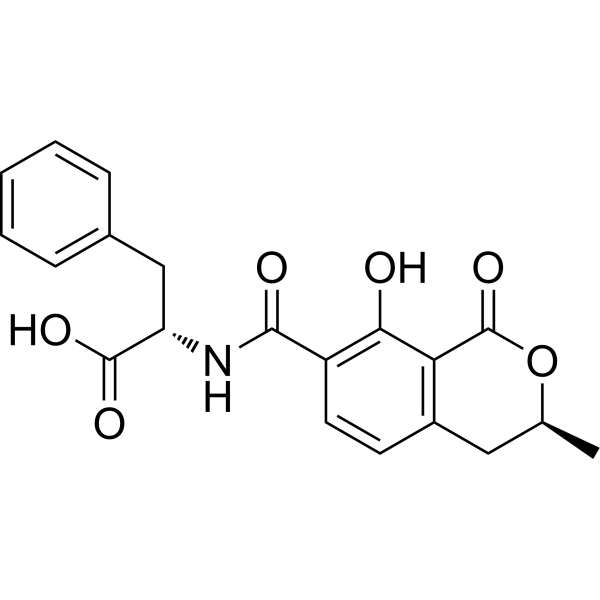
HY-N6786
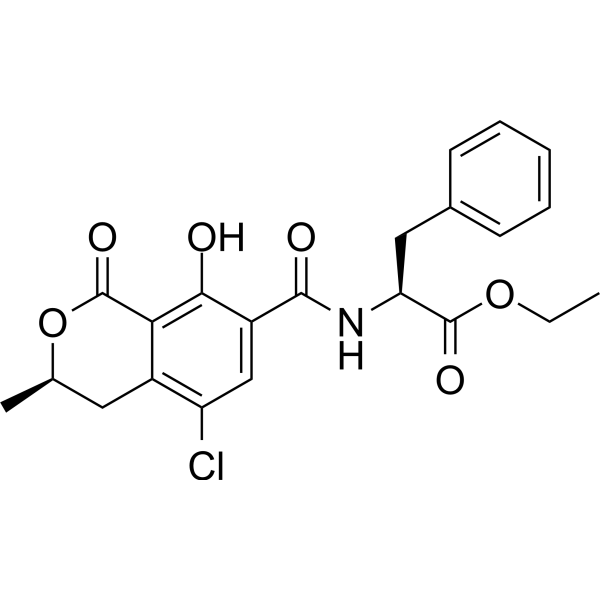
Ochratoxin BMycotoxin -
HY-116909
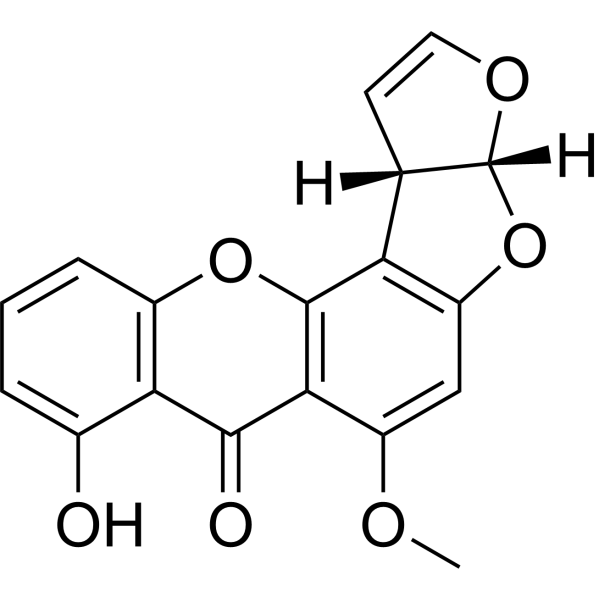
O-MethylsterigmatocystinFungal Metabolites -
HY-125699
Ochratoxin CMycotoxin -
HY-126765
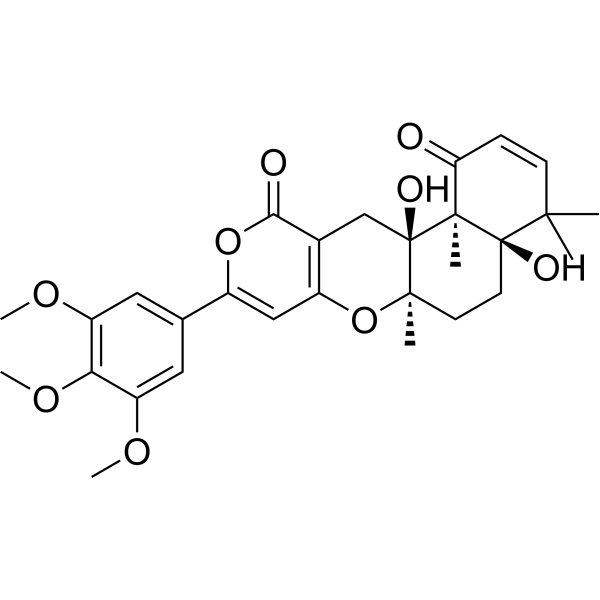
Territrem BFungal Meroterpenoid -

HY-17398R
Mitiglinide calcium (Standard)K(ATP) Channel Antagonist -
HY-N6725R
Sterigmatocystine (Standard) -

HY-N6786R
Ochratoxin B (Standard)Standard of Ochratoxin B


Biological Activity
Description
Cellular Effect
|
Cell Line

|
Type | Value | Description | References |
|---|---|---|---|---|
| HeLa | IC50 |
20 μM
Compound: 9
|
Cytotoxicity against human HeLa cells
Cytotoxicity against human HeLa cells
|
[PMID: 27865702] |
| HT-29 | IC50 |
20 μM
Compound: 9
|
Cytotoxicity against human HT-29 cells
Cytotoxicity against human HT-29 cells
|
[PMID: 27865702] |
| Jurkat | IC50 |
20 μM
Compound: 9
|
Cytotoxicity against human Jurkat cells
Cytotoxicity against human Jurkat cells
|
[PMID: 27865702] |
| MCF7 | IC50 |
20 μM
Compound: 9
|
Cytotoxicity against human MCF7 cells
Cytotoxicity against human MCF7 cells
|
[PMID: 27865702] |
In Vitro
Verruculogen enhances ChTX binding to maxi-k channels, with a K1/2 value of 170 nM[2].
Verruculogen (1 μM) significantly inhibits the amplitude of Thymol (HY-N6810)-stimulated Ca2+-activated K+ current (IK(Ca)) in pituitary GH3 cells[4].
MedChemExpress (MCE) has not independently confirmed the accuracy of these methods. They are for reference only. Further protocols information, click here.
In Vivo
MedChemExpress (MCE) has not independently confirmed the accuracy of these methods. They are for reference only.


Chemical Information
-
CAS No. 12771-72-1
-
Appearance Solid
-
Molecular Weight 511.57
-
Formula C27H33N3O7
-
Color White to light brown
-
SMILES
C/C(C)=C\[C@@H]1N2C3=C([C@@H]([C@@]4(N(C([C@@]5([H])N(CCC5)C4=O)=O)[C@@]3([H])CC(C)(OO1)C)O)O)C6=CC=C(OC)C=C62
-
Structure Classification
-
Initial Source
Penicillium verruculosum
-
Shipping
Room temperature in continental US; may vary elsewhere.
-
Storage
Powder -20°C 3 years 4°C 2 years In solvent -80°C 6 months -20°C 1 month


Solvent & Solubility
In Vitro:
DMSO : ≥ 50 mg/mL (97.74 mM; Hygroscopic DMSO has a significant impact on the solubility of product, please use newly opened DMSO)
* "≥" means soluble, but saturation unknown.
Please refer to the solubility information to select the appropriate solvent. Once prepared, please aliquot and store the solution to prevent product inactivation from repeated freeze-thaw cycles.
Storage method and period of stock solution: -80°C, 6 months; -20°C, 1 month. When stored at -80°C, please use it within 6 months. When stored at -20°C, please use it within 1 month.
Please refer to the solubility information to select the appropriate solvent. Once prepared, please aliquot and store the solution to prevent product inactivation from repeated freeze-thaw cycles.
Storage method and period of stock solution: -80°C, 6 months; -20°C, 1 month. When stored at -80°C, please use it within 6 months. When stored at -20°C, please use it within 1 month.
Concentration (start) × Volume (start) = Concentration (final) × Volume (final)

Protocols
-
Flow cytometric DNA-content cell-cycle staining
Flow cytometric DNA-content cell-cycle staining measures the fluorescence intensity of DNA-bound fluorochromes in single cells or nuclei to estimate DNA content distributions, allowing assignment of populations to G0/G1, S, and G2/M phases by DNA histogram deconvolution. Propidium iodide (PI) intercalates into DNA, and PI fluorescence is proportional to cellular DNA content when staining is performed under conditions that make DNA accessible and minimize non-DNA signal. Cells with G2/M DNA content are expected to show approximately twice the fluorescence intensity of G0/G1 cells, while S-phase cells occupy intermediate fluorescence values. PI-based DNA-content analysis can also detect cells with fractional DNA content, often reported as sub-G1, when DNA fragmentation and extraction during staining reduce retained DNA signal in apoptotic cells. DAPI is an alternative DNA fluorochrome for univariate DNA-content analysis, while bivariate approaches combining DNA content with proliferation
-
BrdU Incorporation Assay
Bromodeoxyuridine (BrdU) incorporation assay is based on the principle that BrdU, a thymidine analog, is incorporated into newly synthesized DNA during the S phase of the cell cycle, thereby serving as a marker of DNA replication and cellular proliferation. Incorporated BrdU can be detected using anti-BrdU antibodies following DNA denaturation, enabling visualization or quantification of proliferating cells through immunochemical detection methods such as immunofluorescence or immunohistochemistry.
-
Protocol for Cell Cycle
Cell-cycle analysis by flow cytometry measures DNA content in single cells to estimate the fraction of cells in G0/G1, S, and G2/M phases. Propidium iodide intercalates into DNA, and after RNA removal with RNase, fluorescence intensity reflects cellular DNA content: 2N cells are assigned to G0/G1, cells between 2N and 4N to S phase, and 4N cells to G2/M. DNA-content analysis alone cannot reliably separate G0 from G1 or G2 from M. Ki-67 can distinguish quiescent G0 cells from cycling cells, EdU or BrdU incorporation marks active DNA synthesis in S phase, and phospho-histone H3 staining identifies mitotic cells within the 4N population.
-
Ca2+ Staining Technique
Ca2+ staining is an experimental technique that utilizes specific fluorescent probes (such as Fluo-4 AM, Fura-2, etc.) to qualitatively or quantitatively detect dynamic changes in intracellular Ca2+ concentrations; this is achieved by monitoring the changes in fluorescent signals generated when these probes bind to free intracellular calcium ions. The underlying principle relies primarily on the presence of chelating groups within the probe's molecular structure that possess high affinity for calcium ions.


Purity & Documentation
-
Data Sheet (281 KB)
-
SDS (480 KB)
- English - EN (480 KB)
- Français - FR (480 KB)
- Deutsch - DE (480 KB)
- Norwegian - NO (480 KB)
- Español - ES (480 KB)
- Swedish - SV (480 KB)
- Italian - IT (480 KB)
- Korean - KR (480 KB)
- Portuguese - PT (480 KB)
-
Handling Instructions (2659 KB)
References
[2]. Knaus HG, et al. Tremorgenic indole alkaloids potently inhibit smooth muscle high-conductance calcium-activated potassium channels. Biochemistry. 1994 May 17;33(19):5819-28. [Content Brief]
[3]. Cui CB, et al. Novel mammalian cell cycle inhibitors, tryprostatins A, B and other diketopiperazines produced by Aspergillus fumigatus. II. Physico-chemical properties and structures. J Antibiot (Tokyo). 1996 Jun;49(6):534-40. [Content Brief]
[4]. Huang MH, et al. Stimulatory actions of thymol, a natural product, on Ca(2+)-activated K(+) current in pituitary GH(3) cells. Planta Med. 2005 Dec;71(12):1093-8. [Content Brief]


Complete Stock Solution Preparation Table
Please refer to the solubility information to select the appropriate solvent. Once prepared, please aliquot and store the solution to prevent product inactivation from repeated freeze-thaw cycles.
Storage method and period of stock solution: -80°C, 6 months; -20°C, 1 month. When stored at -80°C, please use it within 6 months. When stored at -20°C, please use it within 1 month.
| Optional Solvent | Concentration Solvent Mass | 1 mg | 5 mg | 10 mg | 25 mg |
|---|---|---|---|---|---|
| DMSO | 1 mM | 1.9548 mL | 9.7738 mL | 19.5477 mL | 48.8692 mL |
| 5 mM | 0.3910 mL | 1.9548 mL | 3.9095 mL | 9.7738 mL | |
| 10 mM | 0.1955 mL | 0.9774 mL | 1.9548 mL | 4.8869 mL | |
| 15 mM | 0.1303 mL | 0.6516 mL | 1.3032 mL | 3.2579 mL | |
| 20 mM | 0.0977 mL | 0.4887 mL | 0.9774 mL | 2.4435 mL | |
| 25 mM | 0.0782 mL | 0.3910 mL | 0.7819 mL | 1.9548 mL | |
| 30 mM | 0.0652 mL | 0.3258 mL | 0.6516 mL | 1.6290 mL | |
| 40 mM | 0.0489 mL | 0.2443 mL | 0.4887 mL | 1.2217 mL | |
| 50 mM | 0.0391 mL | 0.1955 mL | 0.3910 mL | 0.9774 mL | |
| 60 mM | 0.0326 mL | 0.1629 mL | 0.3258 mL | 0.8145 mL | |
| 80 mM | 0.0244 mL | 0.1222 mL | 0.2443 mL | 0.6109 mL |


Verruculogen Related Classifications
HY-N6688 Related Classifications
 Powered by Bioz