



DiSC3(5) (solution)

Based on 1 Customer Validation
DiSC3 (5) (solution) is a fluorescent probe commonly used as a tracer dye to evaluate mitochondrial membrane potential. The excitation/emission wavelength of DiSC3 (5) is up to 622/670 nm. DiSC3 (5) can inhibit the respiratory system associated with mitochondrial NAD, and the IC50 value is 8 μM. DiSC3 (5) in the presence of Na+/K+-ATPase inhibitor ouabain 2 can induce membrane hyperpolarization of Ehrlich ascites tumor cells.
Solvent and concentration: DMSO: 1 mM
The 1 mL volume is defined as the base specification. All larger sizes correspond to incremental volumes of this base.
For research use only. We do not sell to patients.
- CAS No.: 53213-94-8
- Formula: C25H27IN2S2
- Molecular Weight:546.53
-
Storage:
Please store the product under the recommended conditions in the Certificate of Analysis.


To place orders, for customer services and technical support, please contact: MedChemExpress USA
Tel: 609-228-6898 E-mail: [email protected] [email protected]


-
 Biological Activity
-
Chemical Information
- Protocols
- Purity & Documentation
- References
-
 Help & FAQs


-
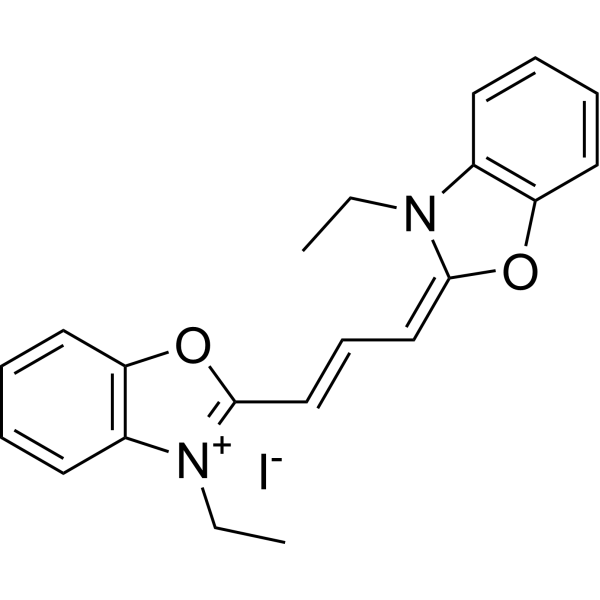
HY-W040258
3,3'-Diethyloxacarbocyanine iodideMicroviscosity Fluorescent Probe -
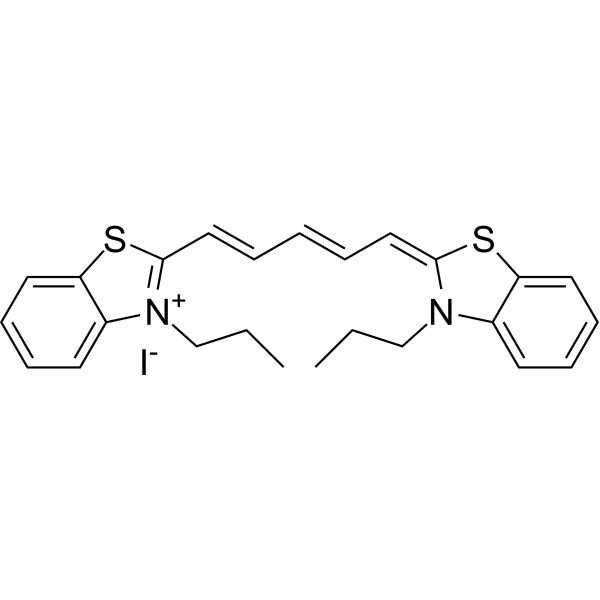
HY-D0085
DiSC3(5)Fluorescent Probe -
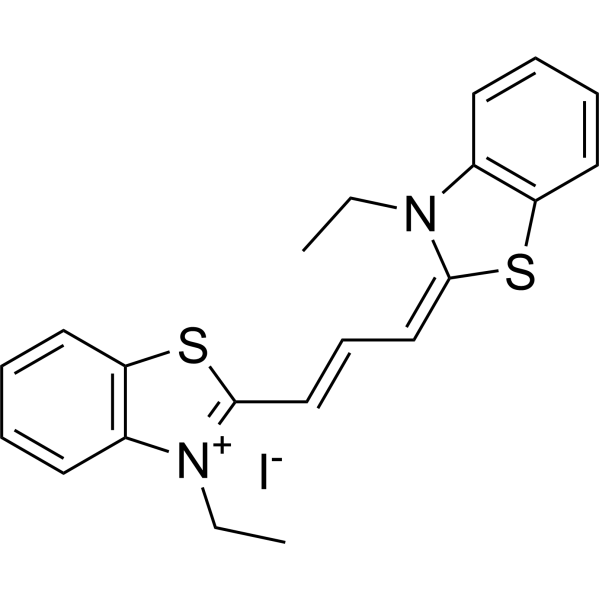
HY-W111907
3,3-Diethylthiacarbocyanine iodideCyanine Dye -
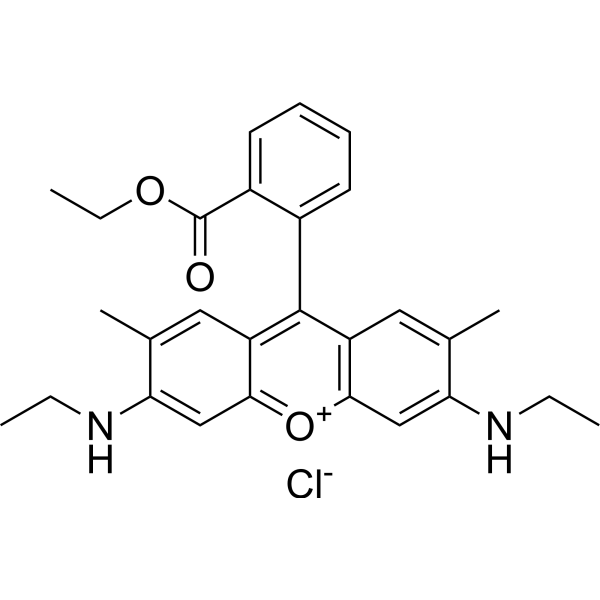
HY-D0309
Rhodamine 6GLaser Dye -
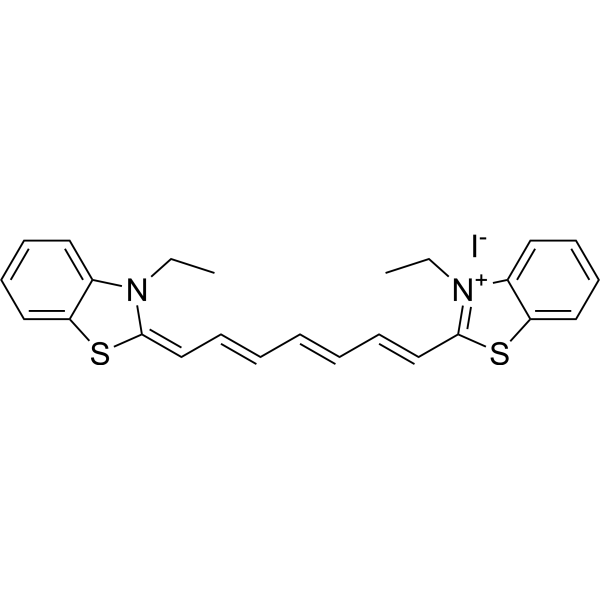
HY-D1180
DTTCISensitizing Dye -
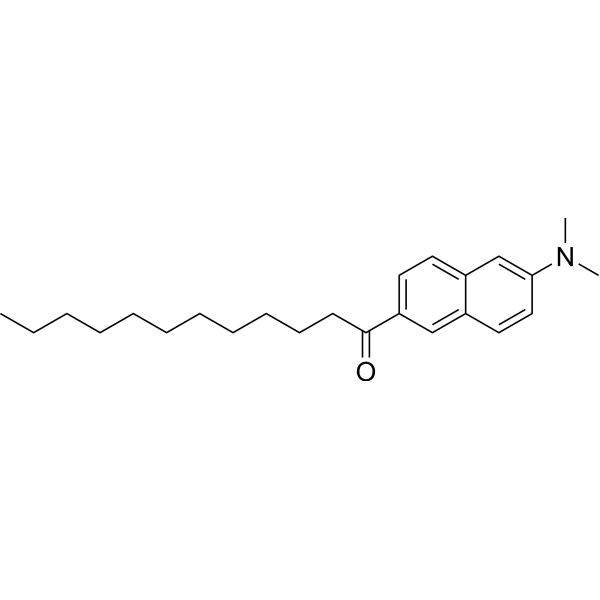
HY-D0080
LaurdanFluorescent Probe -
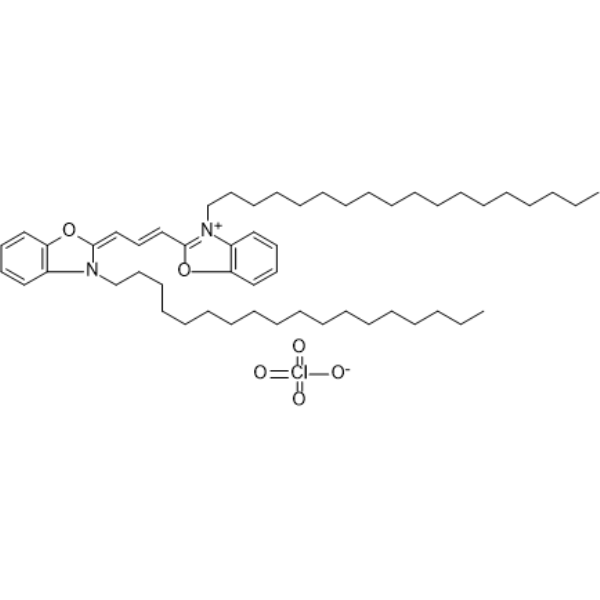
HY-D0969
DiOFluorescent Probe -
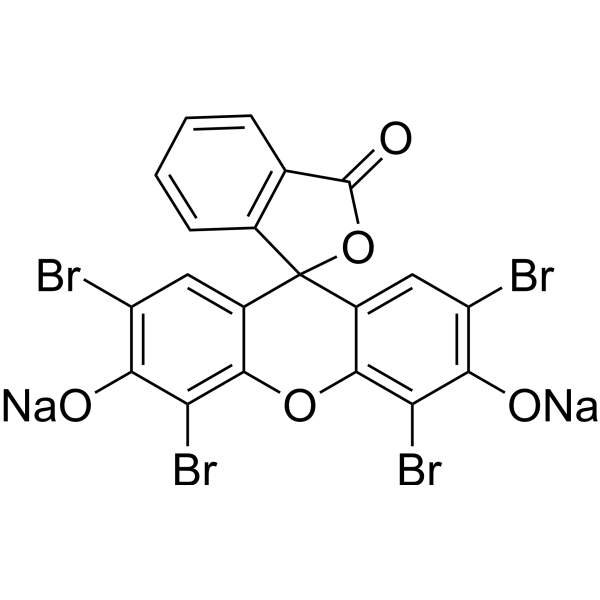
HY-D0505A
Eosin Y disodiumDye Molecule -
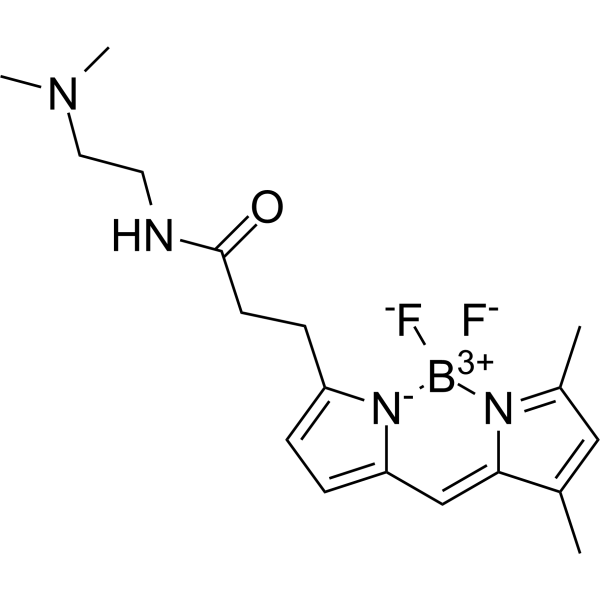
HY-D1296
Green DND-26Lysosome-Specific Fluorescent Dye -
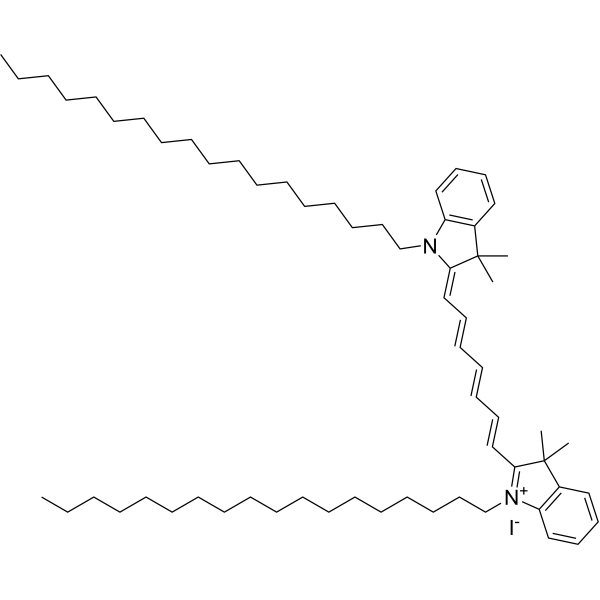
HY-D1048
DiRMembrane Dye -
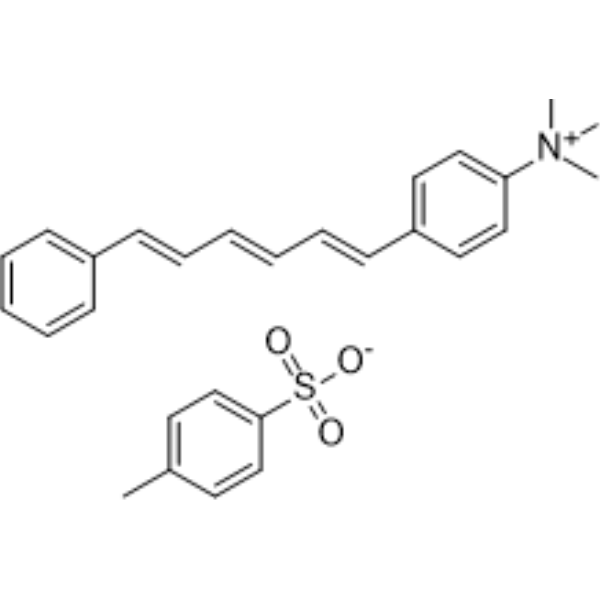
HY-D0986
TMA-DPHMembrane Fluidity Fluorescent Probe -
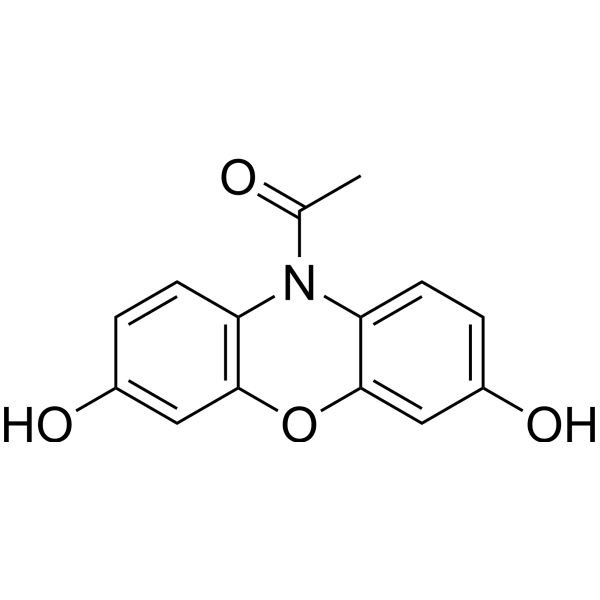
HY-101880
ADHPPeroxidase Substrate


Biological Activity
Description
Solvent and concentration: DMSO: 1 mM
The 1 mL volume is defined as the base specification. All larger sizes correspond to incremental volumes of this base.
In Vitro
Guidelines (Following is our recommended protocol. This protocol only provides a guideline, and should be modified according to your specific needs).
1.1 Stock solution:
The unused portion of the reserve solution should be stored at -20°C. Avoid repeated freezing/thawing cycles.
1.2 Prepare the working solution: Dilute the reserve solution into a suitable buffer, such as serum-free medium, HBSS or PBS. The corresponding stock solution can be diluted according to the actual situation. Note that if the solvent is DMSO, the cytotoxicity of DMSO must be considered, and a solvent control should be prepared; if the solvent is pure water, the working solution needs to be filtered and sterilized before adding cells.
Note 2) : For different cell types and/or experimental conditions, the concentration of the working solution should be determined according to experience. It is recommended to test at concentrations at least in excess of the ten-fold range.
2. Dye the cells into a suspension:
2.1 The suspended cell density in the dye working solution was 1×10⁶/ mL.
2.2 Incubate at 37°C for 2-20 minutes. The culture time depends on the cell type. It is incubated first for 20 minutes and then optimized as needed to obtain even labeling.
2.3 Centrifuge the labeled suspension tubes at 1000 to 1500rpm for 5 minutes.
2.4 Remove the supernatant and gently re-suspend the cells in a preheated (37°C) growth medium.
2.5 Wash twice according to steps 2.3 and 2.4.
3. Staining adherent cells:
3.1 The adherent cells were cultured on a sterile glass cover slide.
3.2 Remove the cover glass from the growth medium and gently drain the excess medium. Place the cover glass in the humidity box.
3.3 Transfer the 100 μL dye working solution to the corner of the cover glass and stir gently until all cells are covered.
3.4 Incubate the cover glass at 37°C for 2-20 minutes. The culture time varies according to cell type. Incubation is started for 20 minutes and then optimized as needed to obtain even labeling.
3.5 Drain the dye working solution and clean the cover glass with growth medium two to three times. For each wash cycle, cover the cells with preheated growth medium, incubate for 5-10 minutes, and then drain the medium.
4. Microscope inspection.
5. Flow cytometry detection:
DiSC3 (5) -labeled cells can be analyzed using conventional FL3 flow cytometry detection channels.
MedChemExpress (MCE) has not independently confirmed the accuracy of these methods. They are for reference only.


Chemical Information
-
CAS No. 53213-94-8
-
Appearance Liquid
-
Molecular Weight 546.53
-
Formula C25H27IN2S2
-
Color Blue to dark blue
-
SMILES
CCCN1/C(SC2=CC=CC=C12)=C\C=C\C=C\C3=[N+](CCC)C4=CC=CC=C4S3.[I-]
-
Shipping
Room temperature in continental US; may vary elsewhere.
-
Storage
Please store the product under the recommended conditions in the Certificate of Analysis.


Purity & Documentation
-
Data Sheet (272 KB)
-
SDS (251 KB)
- English - EN (251 KB)
- Français - FR (251 KB)
- Deutsch - DE (251 KB)
- Norwegian - NO (251 KB)
- Español - ES (251 KB)
- Swedish - SV (251 KB)
- Italian - IT (251 KB)
- Korean - KR (251 KB)
- Portuguese - PT (251 KB)
-
Handling Instructions (2659 KB)
References
[1]. Yamamoto T, et al. Multiple effects of DiS-C3(5) on mitochondrial structure and function. Eur J Biochem. 2004;271(17):3573-3579. [Content Brief]
[2]. Sims PJ, et al. Studies on the mechanism by which cyanine dyes measure membrane potential in red blood cells and phosphatidylcholine vesicles. Biochemistry. 1974 Jul 30;13(16):3315-30. [Content Brief]
[3]. Smith TC, et al. The effect of the fluorescent probe, 3,3'-dipropylthiodicarbocyanine iodide, on the membrane potential of Ehrlich ascites tumor cells. Biochem Biophys Res Commun. 1980 Jul 31;95(2):722-7. [Content Brief]

Calculators
Concentration (start) × Volume (start) = Concentration (final) × Volume (final)


DiSC3(5) (solution) Related Classifications
HY-DY1021 Related Classifications
 Powered by Bioz