PHY34
Based on 1 Customer Validation
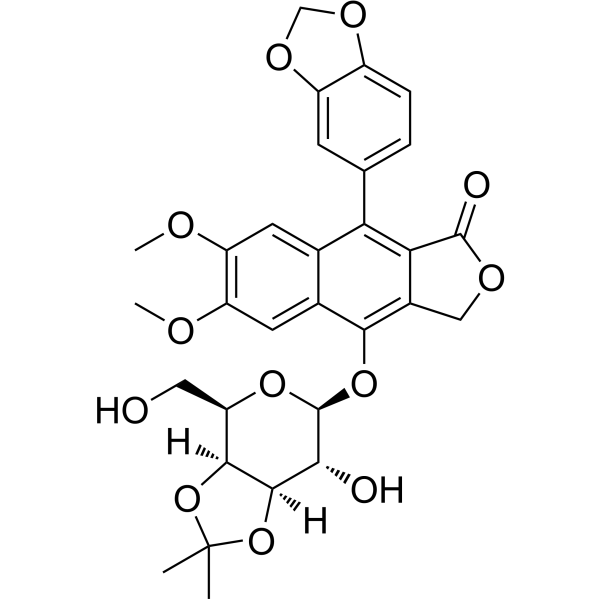
PHY34 is an inhibitor that inhibits ATP6V0A2 and CAS thereby inhibiting autophagy, and has a nanomolar effect. PHY34 inhibits cancer cell growth by inducing apoptosis and inhibits tumor growth in xenograft models. PHY34 can be used for research on high grade serous ovarian cancer.
Nur für Forschungszwecke. Wir verkaufen nicht an Patienten.
- Reinheit : 98.43%
- CAS. Nr.: 2130033-55-3
- Formel: C30H30O12
- Molecular Weight:582.55
-
Speicherung:Powder -20°C, 3 years , 4°C, 2 years ; In solvent -80°C, 6 months , -20°C, 1 month
Biologische Aktivität
Beschreibung
IC50 & Target
ATP6V0A2, cellular apoptosis susceptibility (CAS)[2]
Cellular Effect
|
Cell Line
|
Type | Value | Description | References |
|---|---|---|---|---|
| HT-29 | IC50 |
0.043 μM
Compound: 114; PHY34
|
Antiproliferative activity against human HT-29 cells assessed as reduction in cell viability
|
[PMID: 30830783] |
| OVCAR-3 | IC50 |
0.0042 μM
Compound: 114; PHY34
|
Antiproliferative activity against human OVCAR3 cells assessed as reduction in cell viability
|
[PMID: 30830783] |
| OVCAR-8 | IC50 |
0.004 μM
Compound: 114; PHY34
|
Antiproliferative activity against human OVCAR8 cells assessed as reduction in cell viability
|
[PMID: 30830783] |
In Vitro
PHY34 (0.001 nM-50 μM, 72 h) inhibits various cancer cells growth with nanomolar potency through activation of apoptosis based on enhanced cPARP levels and has the highest potency in HGSOC cell lines[1].
PHY34 (100 nM, 1 μM; 24 h) blocks the final breakdown of the autolysosomes in OVCAR8 at 100 nM, and in OVCAR3 at 1 μM, respectively[1].
PHY34 (10 nM, 24 h) inhibits the late-stage autophagy that precedes apoptosis induction in OVCAR8[1].
PHY34 (100 nM, 48 h) inhibits the late-stage autophagy that precedes apoptosis induction in OVCAR3[1].
PHY34 (0.01 nM-2 μM, 72 h) induces cell death in the presence of wild-type V0A2, but not V823I mutants in H4 cell[2].
PHY34 (10, 100 nM; 48 h, 72 h) changes subcellular localization of nuclear multiple proteins[2].
PHY34 (20 μM, 1 h) binds specificity with ATP6V0A2 subunit[2].
MedChemExpress (MCE) has not independently confirmed the accuracy of these methods. They are for reference only. Further protocols information, click here.
-
Cell Line:OVCAR8, OVCAR3, HT-29, MDA-MB-435, MDA-MB-231, IOSE80, FT33
-
Concentration:0.001 nM-50 μM
-
Incubation Time:72 h
-
Result:Inhibited the growth of various cancer cells with IC50 values of 4 nM(OVCAR8, OVCAR3), 43.3 nM(HT-29) , 23 nM(MDA-MB-435) , 5.2 nM(MDA-MB-231).
Exhibited no toxicity to IOSE80 and FT33 (IC50 >50 μM).
-
Cell Line:H4
-
Concentration:0.01 nM-2 μM
-
Incubation Time:72 h
-
Result:Inhibited mutant cell with an IC50 value of 246 pM that was 1000-fold more potent than HTP-013(434 nM).
Conferred resistance in V8231 mutation and no impact activity in T216A mutation.
-
Cell Line:OVCAR8, OVCAR3
-
Concentration:10 nM, 100 nM
-
Incubation Time:72 h
-
Result:Increased the number of cells in early and late apoptosis in OVCAR8 and OVCAR3 at 10 nM and 100 nM, respectively.
-
Cell Line:Hela
-
Concentration:9.31 fM-20 μM
-
Incubation Time:4 h
-
Result:Sustained high levels of LC3B puncta with an EC50 value of 2 nM.
Inhibited autophagy with an EC50 value of 3.9 nM.
-
Cell Line:OVCAR3
-
Concentration:5 nM
-
Incubation Time:4 h
-
Result:Inhibited autophagy with an ED50 value of 6.29 nM, and was more potent than bafilomycin A1 (HY-100558) with an ED50 value of 29.1 nM.
-
Cell Line:OVCAR8, OVCAR3, OVCAR4
-
Concentration:10 nM, 100 nM
-
Incubation Time:48 h, 72 h
-
Result:Increased cPARP levels in OVCAR8 after 48 h at 10 nM, in OVCAR4 and OVCAR3 after 72 h at 100 nM, respectively.
Reversed the conversion of PARP to cPARP combined with RAP (HY-10219) of 1 μM.
-
Cell Line:OVCAR8, OVCAR3, OVCAR4
-
Concentration:10 nM
-
Incubation Time:24 h, 48 h, 72 h
-
Result:Promoted histone H3, LAMP1/2, ACSS2, and PCNA nuclear protein accumulation at 48 h.
Reduced expression of KPNA2 (Karyopherin subunit alpha 2) with time-dependent manner.
Increased nuclear accumulation of mutant p53 at 48 h.
In Vivo
PHY34 Pharmacokinetics[1]
| Parameter | Units | IV | IP | PO |
| Dose | mg/kg | 0.6 | 1.8 | 75 |
| Dose | nmol | 1029.9 | 3089.8 | 128742.1 |
| T1/2 | hr | 6.2 | 8.4 | 12.3 |
| Tmax | hr | 0.08 | 0.25 | 0.25 |
| Cmax | nmol/L | 288.8 | 519.5 | 323.6 |
| AUClast | hr*nmol/L | 198.8 | 360.5 | 599.9 |
| AUCinf | hr*nmol/L | 215.8 | 366.5 | 663.3 |
| Vz | L/kg | 42.7 | 101.6 | 3430.3 |
| CI | L/hr/kg | 4.8 | 8.4 | 194.1 |
| MRT | hr | 6.1 | 1.9 | 7.8 |
| F* | % | - | 56.6 | 2.5 |
MedChemExpress (MCE) has not independently confirmed the accuracy of these methods. They are for reference only.
-
Animal Model:OVCAR8-induced xenograft models in female nude mice[1].
-
Dosage:0.75 mg/kg, three times a week for three weeks
-
Administration:Intraperitoneal injection (i.p.)
-
Result:Decreased tumor burden based on average abdominal radiant efficiency with no gross toxicity through analysis of fluorescence imaging.
Chemical Information
-
CAS. Nr. 2130033-55-3
-
Appearance Solid
-
Molecular Weight 582.55
-
Formel C30H30O12
-
Color White to off-white
-
SMILES
O=C1C2=C(C3=CC=C(OCO4)C4=C3)C5=CC(OC)=C(OC)C=C5C(O[C@H]6[C@@H]([C@]7([H])[C@](OC(C)(O7)C)([H])[C@H](O6)CO)O)=C2CO1
-
Versand
Room temperature in continental US; may vary elsewhere.
-
Speicherung
Powder -20°C 3 years 4°C 2 years In solvent -80°C 6 months -20°C 1 month
Lösungsmittel & Löslichkeit
In Vitro:
DMSO : 100 mg/mL (171.66 mM; Need ultrasonic; Hygroscopic DMSO has a significant impact on the solubility of product, please use newly opened DMSO)
Please refer to the solubility information to select the appropriate solvent. Once prepared, please aliquot and store the solution to prevent product inactivation from repeated freeze-thaw cycles.
Storage method and period of stock solution: -80°C, 6 months; -20°C, 1 month. When stored at -80°C, please use it within 6 months. When stored at -20°C, please use it within 1 month.
Please refer to the solubility information to select the appropriate solvent. Once prepared, please aliquot and store the solution to prevent product inactivation from repeated freeze-thaw cycles.
Storage method and period of stock solution: -80°C, 6 months; -20°C, 1 month. When stored at -80°C, please use it within 6 months. When stored at -20°C, please use it within 1 month.
Konzentration (Stammlösung) × Volumen (Stammlösung) = Konzentration (Ziellösung) × Volumen (Ziellösung)
In Vivo:
Select the appropriate dissolution method based on your experimental animal and administration route.
- For the following dissolution methods, please ensure to first prepare a clear stock solution using an In Vitro approach and then sequentially add co-solvents:
- To ensure reliable experimental results, the clarified stock solution can be appropriately stored based on storage conditions. As for the working solution for In Vivo experiments, it is recommended to prepare freshly and use it on the same day.
- The percentages shown for the solvents indicate their volumetric ratio in the final prepared solution. If precipitation or phase separation occurs during preparation, heat and/or sonication can be used to aid dissolution.
In Vivo Dissolution Calculator
Please enter the basic information of animal experiments:
-
-
-
-
Recommended: Prepare an additional quantity of animals to account for potential losses during experiments.
Please enter your animal formula composition:
-
%DMSO +
Recommended: Keep the proportion of DMSO in working solution below 2% if your animal is weak.
-
%+
-
+%Tween-80 + +
-
%Saline +
The co-solvents required include: DMSO, . All of co-solvents are available by MedChemExpress (MCE). , Tween 80. All of co-solvents are available by MedChemExpress (MCE).
Working solution concentration: 0.22 mg/mL
Method for preparing stock solution: mg drug dissolved in μL DMSO. Stock solution concentration: mg/mL.
1. Take μL DMSO stock solution;
2. Add μL .
μL , mix evenly;
3. Then add μL Tween 80, mix evenly;
4. Then add μL
Please ensure that the stock solution in the first step is dissolved to a clear state, and add co-solvents in sequence. You can use ultrasonic heating (ultrasonic cleaner, recommended frequency 20-40 kHz), vortexing, etc. to assist dissolution.
Protokoll
-
Annexin V plus membrane-impermeant dye apoptosis staining
Annexin V-based apoptosis assays rely on the detection of phosphatidylserine (PS) externalization from the inner leaflet of the plasma membrane to the outer leaflet, an early biochemical hallmark of apoptosis. Fluorescently labeled Annexin V binds PS in a calcium-dependent manner, enabling identification of early apoptotic cells by flow cytometry or fluorescence microscopy. When combined with a membrane-impermeant DNA-binding dye (e. g. , propidium iodide), this approach allows discrimination between viable (Annexin V−/dye−), early apoptotic (Annexin V+/dye−), and late apoptotic or necrotic (Annexin V+/dye+) cell populations by assessing membrane integrity and PS exposure.
-
Somatic Cell Culture
A method of simulating the in vivo environment in vitro to maintain the cell growth, differentation and main functions.
-
Patient-Derived Orthotopic Xenograft (PDOX)
Patient-derived orthotopic xenograft (PDOX) modeling implants fresh patient tumor tissue or patient-derived tumor cells into the anatomically corresponding organ or tissue site of immunodeficient mice, usually by surgical orthotopic implantation, to preserve patient tumor histology, local microenvironmental context, invasion, metastatic behavior, and treatment-response features better than subcutaneous implantation. PDOX readouts include tumor engraftment, orthotopic tumor growth, local invasion, metastasis, recurrence after resection, histologic similarity to the donor tumor, biomarker retention, molecular concordance, survival, and response or resistance to therapy. PDOX models are used for preclinical drug testing and individualized therapy evaluation, but engraftment success varies by tumor type and specimen quality.
-
CCK-8/WST-8 Cell Proliferation Assay
The CCK-8/WST-8 assay is based on the reduction of the water-soluble tetrazolium salt WST-8 to a water-soluble formazan product by cellular dehydrogenases in metabolically active cells, where the generated formazan amount is proportional to the number of living cells and is quantified by measuring absorbance in the visible range, providing a colorimetric readout for cell viability and proliferation assessment. This class of tetrazolium-based assays improves upon earlier MTT-based systems by producing a water-soluble formazan, eliminating the need for organic solubilization steps and enabling direct spectrophotometric measurement in culture medium.
-
Cell Counting-Based Growth Curve Assay
Cell counting-based growth curve assays quantify cell proliferation by directly measuring changes in viable cell number over time using manual or automated counting methods such as hemocytometer-based counting or instrument-assisted cell enumeration, enabling construction of growth curves that reflect population expansion dynamics in response to culture conditions. A widely used approach is trypan blue exclusion with hemocytometer counting, where membrane-compromised (non-viable) cells take up the dye, allowing discrimination between viable and non-viable cells while simultaneously enabling total cell number quantification. Repeated sampling across time points allows estimation of proliferation rate, growth phases, and comparative growth kinetics between experimental conditions.
-
Cell Viability Determination by MTT Colorimetric Assay
The following protocol uses the MTT colorimetric assay as a classic literature-established method for assessing cell viability/metabolic activity in cultured mammalian cells. MTT[3-(4,5-dimethylthiazol-2-yl)-2,5-diphenyltetrazolium bromide] is reduced by metabolically active cells to a colored formazan product; the amount of formazan is quantified spectrophotometrically and provides an indirect measure of metabolically active viable cells. Importantly, MTT reduction reflects cellular oxidoreductase/metabolic activity rather than an absolute direct count of living cells, so changes in cellular metabolism can alter the signal independently of cell number.
-
Apoptosis
Apoptosis, also called programmed cell death, is generally characterized by distinct morphological characteristics.
-
TUNEL staining for apoptotic DNA fragmentation
TUNEL staining detects DNA strand breaks by using terminal deoxynucleotidyl transferase to add labeled nucleotides to exposed 3′-OH DNA termini, generating either microscopic staining in fixed cells or tissue sections, or fluorescence/cytometric signal in cell suspensions. TUNEL positivity reflects DNA fragmentation but should not be interpreted alone as definitive apoptosis, because TUNEL can also label necrotic, autolytic, mechanically damaged, or DNA-repair-associated DNA breaks.
-
Protocol for Cell Counting and Cell Density Analysis
Cell counting and cell-density analysis estimate the number of cells in a known volume or field area. Manual hemocytometer counting uses a chamber of defined geometry to convert counted cells into cells/mL, while automated counters and image-analysis workflows detect cell objects from optical, brightfield, fluorescence, impedance, or digital-image features. Trypan blue viability counting is based on dye exclusion: viable cells with intact membranes exclude dye, while non-viable cells with compromised membranes stain blue. The readout is total cell density, viable-cell density, dead-cell density, and percent viability. Cell density can also be estimated from microscopy images by counting objects per image area, from flow cytometry using calibrated volume or reference particles, or from in situ microscopy in bioreactors after calibration against reference methods such as hemocytometer or flow cytometry.
-
Autophagy
Autophagy is a process in which eukaryotic cells use lysosomes to degrade their own cytoplasmic proteins and damaged organelles under the regulation of autophagy related gene (Atg). Microtubule-associated proteins light chain 3 (LC3) is recognized as autophagy marker, which transfers from cytoplasmic LC3 (LC3-I) to membrane type (LC3-II). LC3-II/I ratio could be detected by Western Blot and fluorescence microscopy.
-
Patient-Derived Xenograft (PDX)
Patient-derived xenograft (PDX) models are generated by engrafting primary human tumor tissue directly into immunodeficient mice, allowing in vivo propagation of patient tumor biology without initial in vitro adaptation. These models are used to preserve key histopathological and molecular characteristics of the original tumor and enable assessment of tumor growth dynamics and therapeutic response in a living organism. The biological readout is tumor engraftment and subsequent growth in the murine host, which reflects the ability of human tumor cells to survive, vascularize, and expand in an immunocompromised microenvironment.
-
Apoptosis Solutions
Apoptosis is a regulated, generally non-lytic cell-death pathway that removes unwanted, damaged, infected, or abnormal cells through coordinated morphological changes, caspase activation, DNA fragmentation, and membrane remodeling. The intrinsic apoptosis pathway is controlled mainly by mitochondrial outer membrane permeabilization, BCL-2 family proteins, cytochrome c release, apoptosome formation, caspase-9 activation, and downstream executioner caspase-3/7 activation. The extrinsic apoptosis pathway is initiated by death receptors such as Fas, TNFR, and TRAIL receptors, which recruit adaptor proteins and activate caspase-8 before engaging executioner caspases or mitochondrial amplification through BID cleavage. Apoptosis is linked to many phenotypes, including cancer cell killing, tissue homeostasis, immune regulation, neurodegeneration, infection response, and treatment-induced cytotoxicity; unresolved questions include how apoptosis interacts with necroptosis, pyroptosis, ferroptos
-
Splenic/Portal-Vein Liver Metastasis Xenograft
Splenic and portal-vein liver metastasis xenograft models deliver tumor cells into the portal circulation so that cells reach the liver first and form hepatic metastatic lesions; splenic injection uses the spleen as an access route to the portal system, while direct portal-vein injection introduces cells into the portal vein without requiring splenectomy. The assay detects liver colonization, intrahepatic tumor growth, tumor distribution, treatment response, survival, and liver-metastasis microenvironment changes; readouts include bioluminescence or fluorescence imaging, gross liver nodule counts, liver weight or tumor burden, histology, and survival.
-
Lysosome and acidic-vesicle live-cell staining
Lysosome and acidic-vesicle live-cell staining detects acidic intracellular compartments by using membrane-permeant acidotropic probes that accumulate in low-pH vesicles, including lysosomes, late endosomes, autolysosomes, and acidic phagosomes. LysoTracker staining is commonly used as an intensity-based readout of acidic lysosomal compartment abundance or enlargement, while acridine orange produces green fluorescence in less concentrated compartments and red fluorescence after concentration-dependent accumulation in acidic vesicular organelles. Loss or reduction of acridine-orange red signal can be used as a readout of lysosomal membrane permeabilization or reduced acidic-vesicle integrity. This protocol is designed for live cultured cells and can be adapted for fluorescence microscopy, high-content imaging, plate-reader readout, or flow cytometry when the selected literature supports the readout. Because these dyes report acidotropic accumulation rather than lysosome identity alone,
-
MTT Cell Proliferation Assay
The MTT assay is a colorimetric endpoint assay for estimating viable cell number, cell growth, cytotoxicity, or cell activation in cultured mammalian cells. Living cells reduce the yellow tetrazolium salt MTT into purple/blue formazan, while dead cells do not generate the same signal; the resulting color can be quantified with a multiwell spectrophotometer. MTT reduction is commonly interpreted as a readout of metabolic activity that often correlates with viable cell number, but it should not be treated as a direct cell-counting method unless the assay is optimized for the cell type and experimental condition. Studies show that MTT reduction can involve mitochondrial and non-mitochondrial reducing systems, and formazan may accumulate in intracellular lipid droplets rather than simply marking mitochondria.
-
Subcutaneous Cell-Line-Derived Xenograft
Subcutaneous cell-line-derived xenograft (CDX) models are established by implanting cultured human cancer cell lines into immunodeficient mice, where the injected cells form localized tumors that can be monitored in vivo as a measure of tumorigenic potential, growth kinetics, and treatment response. These models are widely used in oncology research because they allow reproducible tumor formation and enable comparative assessment of tumor growth between different cell lines or genetic manipulations in a controlled in vivo microenvironment. Subcutaneous implantation of cancer cells in immunodeficient mice is a standard approach for evaluating tumor growth behavior and therapeutic response across multiple cancer types, including prostate, esophageal, pancreatic, and colon cancer models.
-
Macroautophagy Solutions
Macroautophagy is a conserved lysosome-dependent degradation pathway in which cytoplasmic material is sequestered into double-membrane autophagosomes and delivered to lysosomes for degradation and recycling. The pathway supports cellular homeostasis during nutrient limitation, organelle stress, protein-aggregate accumulation, infection, differentiation, and tissue remodeling by coupling cargo sequestration, autophagosome maturation, lysosomal fusion, and degradation of cargo-derived macromolecules. The core molecular sequence includes initiation by nutrient- and stress-regulated autophagy machinery, autophagosome nucleation, LC3/ATG8-family conjugation to autophagosomal membranes, cargo selection through receptors such as SQSTM1/p62, autophagosome-lysosome fusion, and lysosomal degradation. LC3 was identified as a mammalian homolog of yeast Atg8 that localizes to autophagosomal membranes after processing, and p62/SQSTM1 was shown to connect ubiquitinated cargo with autophagic degradati
-
Orthotopic Cell-Line Xenograft
Orthotopic cell-line xenograft models involve implantation of human cancer cell lines into the anatomically corresponding organ of immunodeficient mice to reproduce tumor growth within a native microenvironment, enabling more clinically relevant tumor behavior compared with subcutaneous models. These models are widely used because orthotopic placement better recapitulates tumor progression, including invasion and metastatic spread, which are often underrepresented in heterotopic implantation systems. Compared with conventional xenografts, orthotopic implantation is described as more technically complex but provides improved simulation of tumor-microenvironment interactions and metastatic behavior, making it particularly valuable for translational oncology research. Surgical orthotopic implantation approaches have been emphasized as enabling faithful reproduction of clinical cancer features, including metastasis and disease progression patterns that align with the tumor’s organ of origi
-
Intraperitoneal/Peritoneal Dissemination Xenograft
Intraperitoneal (IP) or peritoneal dissemination xenograft models are based on the introduction of human cancer cells into the peritoneal cavity of immunodeficient mice, where they attach to peritoneal surfaces, form multicellular aggregates or spheroids, and progressively generate disseminated tumor nodules that mimic advanced peritoneal metastatic disease. These models are widely used to study ovarian cancer progression, tumor-microenvironment interactions, and intraperitoneal therapeutic responses, often incorporating bioluminescence or fluorescence imaging to longitudinally monitor tumor burden in vivo. The biological principle relies on the capacity of tumor cells such as SKOV3 or related ovarian carcinoma lines to survive in suspension, aggregate within ascites-like fluid, adhere to mesothelial surfaces, and invade peritoneal organs, thereby recapitulating human peritoneal carcinomatosis patterns observed in advanced disease.
Reinheit & Dokumentation
-
Data Sheet (290 KB)
-
SDS (251 KB)
- English - EN (251 KB)
- Français - FR (251 KB)
- Deutsch - DE (251 KB)
- Norwegian - NO (251 KB)
- Español - ES (251 KB)
- Swedish - SV (251 KB)
- Italian - IT (251 KB)
- Korean - KR (251 KB)
- Portuguese - PT (251 KB)
-
Handling Instructions (2659 KB)
Verweise
[1]. Young AN,et al. Phyllanthusmin Derivatives Induce Apoptosis and Reduce Tumor Burden in High-Grade Serous Ovarian Cancer by Late-Stage Autophagy Inhibition. Mol Cancer Ther. 2018 Oct;17(10):2123-2135. [Content Brief]
[2]. Salvi A, et al. PHY34 inhibits autophagy through V-ATPase V0A2 subunit inhibition and CAS/CSE1L nuclear cargo trafficking in high grade serous ovarian cancer. Cell Death Dis. 2022 Jan 10;13(1):45. [Content Brief]
Complete Stock Solution Preparation Table
Please refer to the solubility information to select the appropriate solvent. Once prepared, please aliquot and store the solution to prevent product inactivation from repeated freeze-thaw cycles.
Storage method and period of stock solution: -80°C, 6 months; -20°C, 1 month. When stored at -80°C, please use it within 6 months. When stored at -20°C, please use it within 1 month.
| Optional Solvent | Concentration Solvent Mass | 1 mg | 5 mg | 10 mg | 25 mg |
|---|---|---|---|---|---|
| DMSO | 1 mM | 1.7166 mL | 8.5830 mL | 17.1659 mL | 42.9148 mL |
| 5 mM | 0.3433 mL | 1.7166 mL | 3.4332 mL | 8.5830 mL | |
| 10 mM | 0.1717 mL | 0.8583 mL | 1.7166 mL | 4.2915 mL | |
| 15 mM | 0.1144 mL | 0.5722 mL | 1.1444 mL | 2.8610 mL | |
| 20 mM | 0.0858 mL | 0.4291 mL | 0.8583 mL | 2.1457 mL | |
| 25 mM | 0.0687 mL | 0.3433 mL | 0.6866 mL | 1.7166 mL | |
| 30 mM | 0.0572 mL | 0.2861 mL | 0.5722 mL | 1.4305 mL | |
| 40 mM | 0.0429 mL | 0.2146 mL | 0.4291 mL | 1.0729 mL | |
| 50 mM | 0.0343 mL | 0.1717 mL | 0.3433 mL | 0.8583 mL | |
| 60 mM | 0.0286 mL | 0.1430 mL | 0.2861 mL | 0.7152 mL | |
| 80 mM | 0.0215 mL | 0.1073 mL | 0.2146 mL | 0.5364 mL | |
| 100 mM | 0.0172 mL | 0.0858 mL | 0.1717 mL | 0.4291 mL |