



EGFR-IN-44
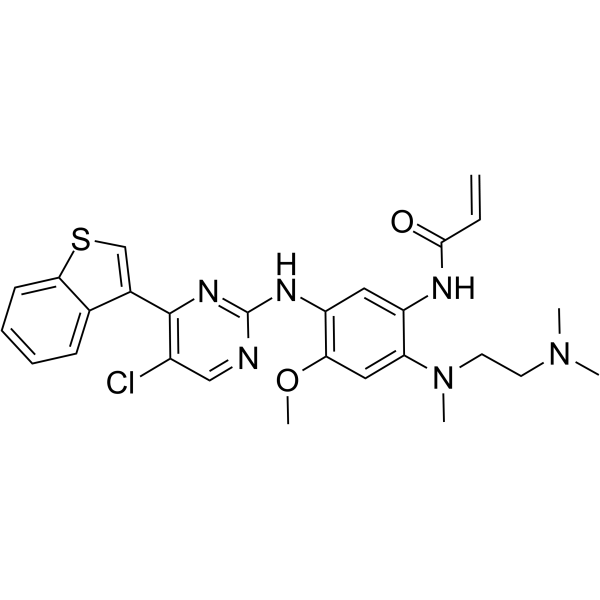
EGFR-IN-44 (Compound 6a) is a potent, orally active EGFR tyrosine kinase inhibitor with an IC50 of 4.11 nM. EGFR-IN-44 induces cell apoptosis and shows an oral bioavailability value of 33.57%. EGFR-IN-44 can be studied for non-small-cell lung cancers.
For research use only. We do not sell to patients.
- Formula: C27H29ClN6O2S
- Molecular Weight:537.08
-
Storage:
Please store the product under the recommended conditions in the Certificate of Analysis.

To place orders, for customer services and technical support, please contact: MedChemExpress USA
Tel: 609-228-6898 E-mail: [email protected] [email protected]


-
 Biological Activity
-
Chemical Information
- Protocols
- Purity & Documentation
- References
-
 Help & FAQs


All EGFR Isoforms
More

Biological Activity
Description
IC50 & Target
IC50: 0.26 nM (EGFR T790M/L858R), 1.33 nM (EGFR L858R), 4.11 nM (EGFR)[1]
In Vitro
EGFR-IN-44 (Compound 6a) (0-10 µM, 72 h) shows anti-proliferative activities against tumor cell lines[1].
EGFR-IN-44 binds to the ATP binding site of EGFR[1].
EGFR-IN-44 (0-10 nM, 48 h) induces H1975 cell apoptosis via the mitochondrial pathway, arrests cell cycle in G0/G1 phase, and suppresses cell migration[1].
EGFR-IN-44 (0-10 nM, 48 and 72h) shows hypotoxicity against normal cells[1].
MedChemExpress (MCE) has not independently confirmed the accuracy of these methods. They are for reference only. Further protocols information, click here.
-
Cell Line:H1975 (EGFRT790M/L858R), PC9 (EGFRdel19), and H292 (EGFRWT)
-
Concentration:0-10 µM
-
Incubation Time:72 h
-
Result:Showed anti-proliferative activities with IC50 values of 0.0022 ± 0.001, 0.0048 ± 0.001, and 4.499 ± 0.057 µM against H1975, PC9, and H292 cells, respectively.
-
Cell Line:H1975
-
Concentration:1, 5, and 10 nM
-
Incubation Time:48 h
-
Result:Effectively induced cell apoptosis in a dose-dependent manner. Resulted in 33.7%, 52.4%, and 56.2% apoptosis at 1, 5, and 10 µM, respectively, compared to 5.81% apoptosis in the control group.
-
Cell Line:H1975
-
Concentration:5, 10, and 25 nM
-
Incubation Time:48 h and 72 h
-
Result:Dose-dependently upregulated the expression levels of the proapoptotic proteins Bad and Bax and downregulated the expression level of the antiapoptotic protein Bcl-2. Sufficiently reduced the phosphorylation of EGFR and AKT.
-
Cell Line:H1975
-
Concentration:5 nM
-
Incubation Time:0, 12, 24, or 48 h
-
Result:Exhibited a significant increase in the G0/G1 cell population and a dramatic decrease in G2/M phase.
-
Cell Line:LO2, HK2, HLF, and 293A
-
Concentration:0.1, 1, 5, and 10 µM
-
Incubation Time:48 h and 72 h
-
Result:Showed hypotoxicity with IC50 values of 7.247, 4.586, 3.787, and 2.925 µM against LO2, HK2, HLF, and 293A cells, respectively. The cell morphology was changed compared to the control.
In Vivo
MedChemExpress (MCE) has not independently confirmed the accuracy of these methods. They are for reference only.
-
Animal Model:Male BALB/c nude mice (5 weeks old, 18 - 20 g), H1975 xenograft model[1]
-
Dosage:25 mg/kg
-
Administration:Intragastric administration, daily, 7 days
-
Result:Showed strong tumor inhibition (TGI = 90.24%) without obvious toxicity.
-
Animal Model:Male Sprague–Dawley (SD) rats[1]
-
Dosage:1 mg/kg and 5 mg/kg
-
Administration:Intravenous injection and oral administration (Pharmacokinetic Analysis)
-
Result:In Vivo PK parameters of EGFR-IN-44 [1]
Parameters
Dose(mg/kg)EGFR-IN-44
5 (po)
1 (iv)t1/2 (h) 8.60 ± 1.8 1.42 ± 0.1 Tmax (h) 4.00 ± 0.002 / Cmax (ng/mL) 80.40 ± 2.7 / Vz F_pred (L/kg) 220.80 ± 41.2 6.83 ± 08 AUC0-t (H.ng/mL) 490.41 ± 29.9 291.91 ± 38.2 AUC0-∞ (H.ng/mL) 491.02 ± 44.2 295.76 ± 38.8 MRT0-last (h) 7.93 ± 0.8 1.35 ± 01 CL (mL/h/kg) 17.79 ± 3.9 3.12 ± 0.4 F(%) 33.57 ± 5.9 /
F = (AUC0-inf-PO × DOSEIV)/(AUC0-inf-IV × DOSE PO)*100%.


Chemical Information
-
Molecular Weight 537.08
-
Formula C27H29ClN6O2S
-
SMILES
C=CC(NC1=CC(NC2=NC(C3=CSC4=CC=CC=C43)=C(C=N2)Cl)=C(C=C1N(CCN(C)C)C)OC)=O
-
Shipping
Room temperature in continental US; may vary elsewhere.
-
Storage
Please store the product under the recommended conditions in the Certificate of Analysis.

Protocols
-
Apoptosis
Apoptosis, also called programmed cell death, is generally characterized by distinct morphological characteristics.
-
TUNEL staining for apoptotic DNA fragmentation
TUNEL staining detects DNA strand breaks by using terminal deoxynucleotidyl transferase to add labeled nucleotides to exposed 3′-OH DNA termini, generating either microscopic staining in fixed cells or tissue sections, or fluorescence/cytometric signal in cell suspensions. TUNEL positivity reflects DNA fragmentation but should not be interpreted alone as definitive apoptosis, because TUNEL can also label necrotic, autolytic, mechanically damaged, or DNA-repair-associated DNA breaks.
-
Cell Cytotoxicity Assay
Cytotoxicity assays are usually based on the assessment of cell membrane damage, which can also be indirectly detected by measuring cell viability. Detection methods include MTT assay, CKK-8 assay, LDH assay and ATP assay, etc.
-
Annexin V plus membrane-impermeant dye apoptosis staining
Annexin V-based apoptosis assays rely on the detection of phosphatidylserine (PS) externalization from the inner leaflet of the plasma membrane to the outer leaflet, an early biochemical hallmark of apoptosis. Fluorescently labeled Annexin V binds PS in a calcium-dependent manner, enabling identification of early apoptotic cells by flow cytometry or fluorescence microscopy. When combined with a membrane-impermeant DNA-binding dye (e. g. , propidium iodide), this approach allows discrimination between viable (Annexin V−/dye−), early apoptotic (Annexin V+/dye−), and late apoptotic or necrotic (Annexin V+/dye+) cell populations by assessing membrane integrity and PS exposure.
-
Protocol for Pharmacokinetic Study
Pharmacokinetic studies quantify how an organism handles a drug over time through absorption, distribution, metabolism, and excretion, and the core experimental readout is the concentration-time profile of parent drug and, when relevant, metabolites in biological matrices such as plasma, whole blood, urine, bile, or tissue. Pharmacokinetic analysis links dose, route, exposure, clearance, half-life, distribution, bioavailability, and systemic exposure to drug efficacy and toxicity hypotheses rather than measuring a signaling pathway directly. The literature links pharmacokinetics to drug-development phenotypes by showing that drug metabolism and pharmacokinetics influence compound progression, exposure-response interpretation, safety margins, dosing strategy, and failure risk during discovery and development. DMPK science contributes to compound optimization by integrating physicochemical properties, in vitro metabolism, transporter behavior, in vivo exposure, and pharmacodynamic contex
-
Apoptosis Solutions
Apoptosis is a regulated, generally non-lytic cell-death pathway that removes unwanted, damaged, infected, or abnormal cells through coordinated morphological changes, caspase activation, DNA fragmentation, and membrane remodeling. The intrinsic apoptosis pathway is controlled mainly by mitochondrial outer membrane permeabilization, BCL-2 family proteins, cytochrome c release, apoptosome formation, caspase-9 activation, and downstream executioner caspase-3/7 activation. The extrinsic apoptosis pathway is initiated by death receptors such as Fas, TNFR, and TRAIL receptors, which recruit adaptor proteins and activate caspase-8 before engaging executioner caspases or mitochondrial amplification through BID cleavage. Apoptosis is linked to many phenotypes, including cancer cell killing, tissue homeostasis, immune regulation, neurodegeneration, infection response, and treatment-induced cytotoxicity; unresolved questions include how apoptosis interacts with necroptosis, pyroptosis, ferroptos


Purity & Documentation
References

Calculators
Concentration (start) × Volume (start) = Concentration (final) × Volume (final)


EGFR-IN-44 Related Classifications
HY-145844 Related Classifications
 Powered by Bioz