



NHI-2

Based on 1 Customer Validation
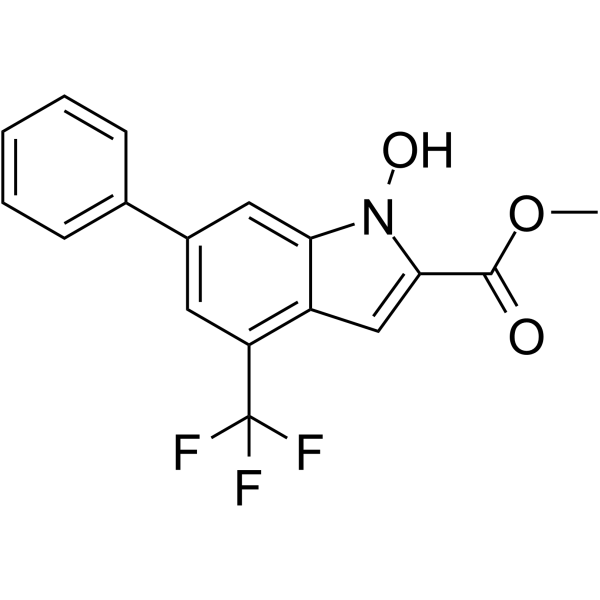
NHI-2 is a lactate dehydrogenase A (LDHA) inhibitor with an IC50 of 14.7 µM. NHI-2 shows selective for LDHA over LDHB (IC50 = 55.8 µM). NHI-2 is an efficient anti-glycolytic agent. NHI-2 enhances apoptosis, induces cell cycle arrest at S and G2 phases. NHI-2 has a broad spectrum anti-proliferative activity in cancer cells. NHI-2 affects extracellular acidification rate and ATP production. NHI-2 suppresses tumor growth in murine B78 melanoma tumor model.
For research use only. We do not sell to patients.
- Purity : 99.10%
- CAS No.: 1269802-97-2
- Formula: C17H12F3NO3
- Molecular Weight:335.28
-
Storage:Powder -20°C, 3 years ; In solvent -80°C, 6 months , -20°C, 1 month

To place orders, for customer services and technical support, please contact: MedChemExpress USA
Tel: 609-228-6898 E-mail: [email protected] [email protected]


-
 Biological Activity
-
Chemical Information
-
Solvent & Solubility
- Protocols
- Purity & Documentation
- References
-
 Help & FAQs


-
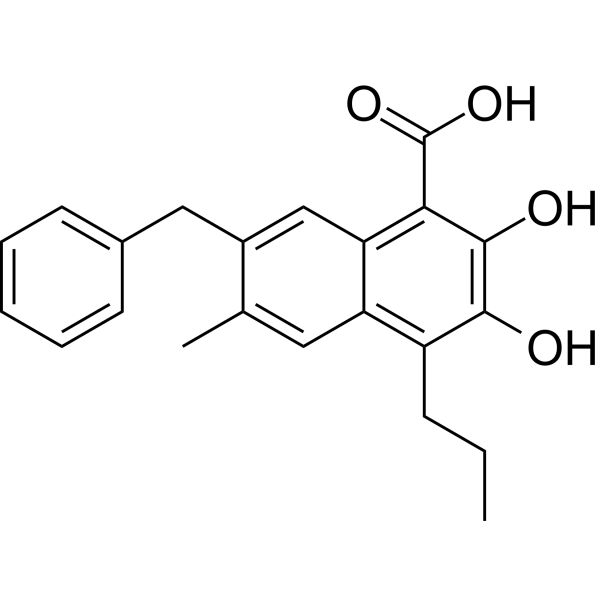
HY-16214
FX-11LDHA Inhibitor -
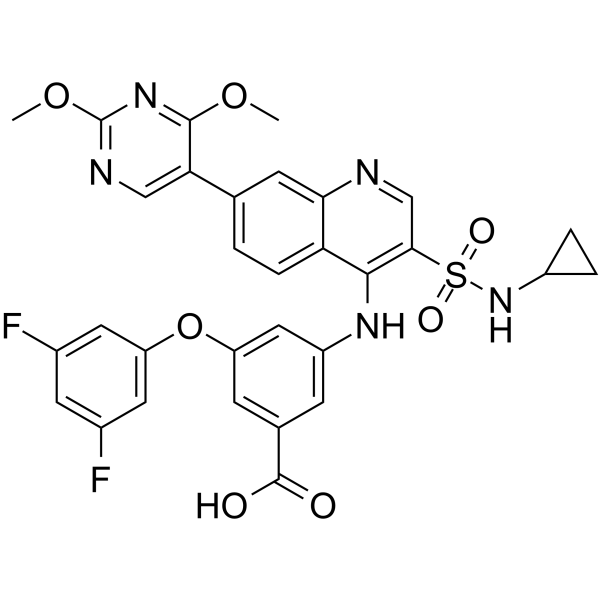
HY-100681
GSK2837808ALDHA Inhibitor -
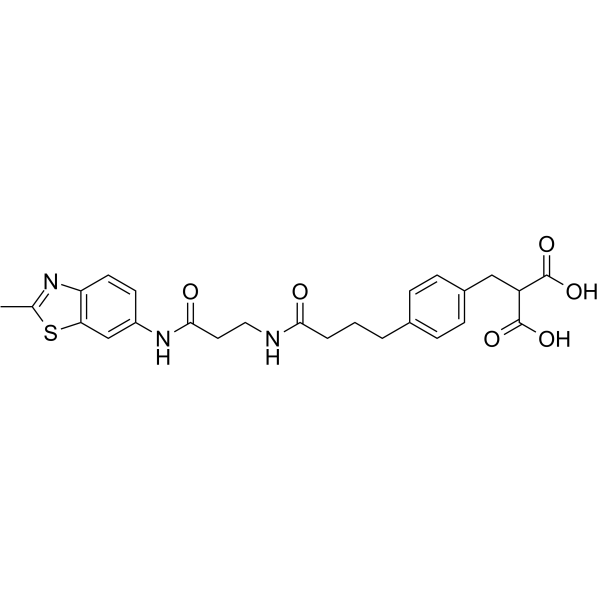
HY-18968
AZ-33LDHA Inhibitor -
HY-W013032A
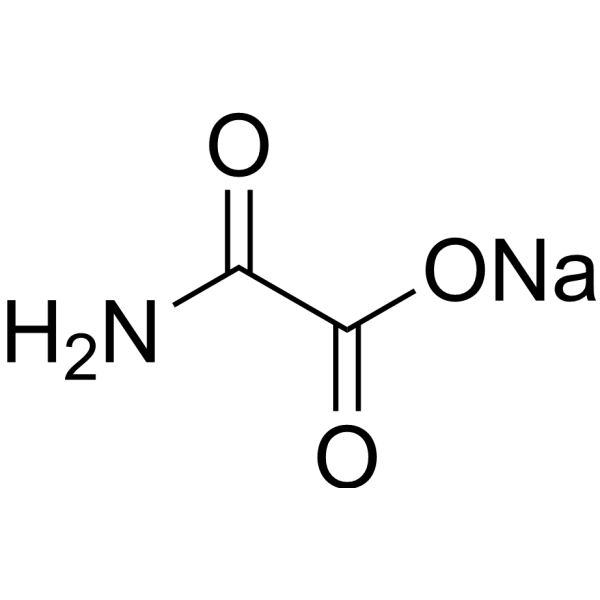
Oxamic acid sodiumLDH-A Inhibitor -
HY-100742A
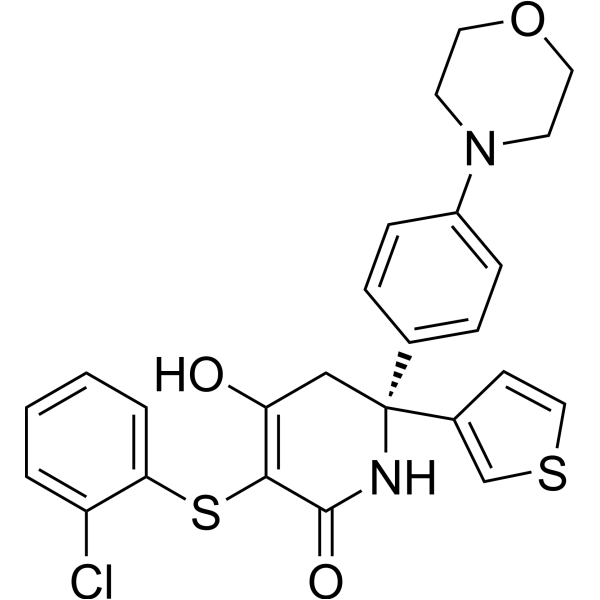
(R)-GNE-140LDHA Inhibitor -
HY-111108
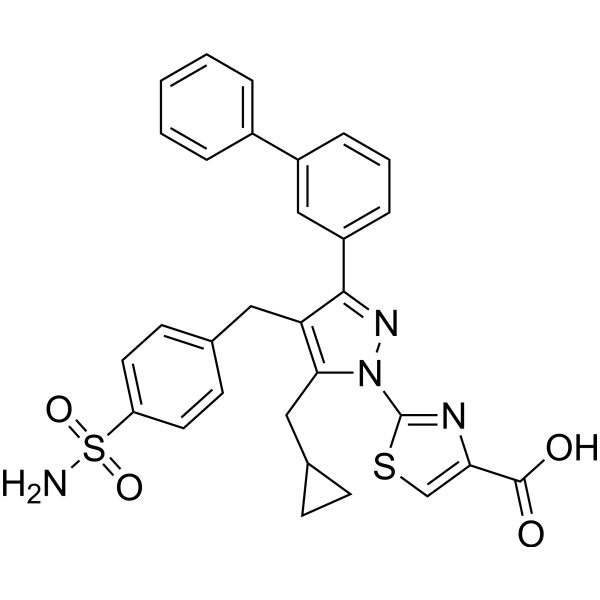
LDH-IN-1LDH Inhibitor -
HY-100742
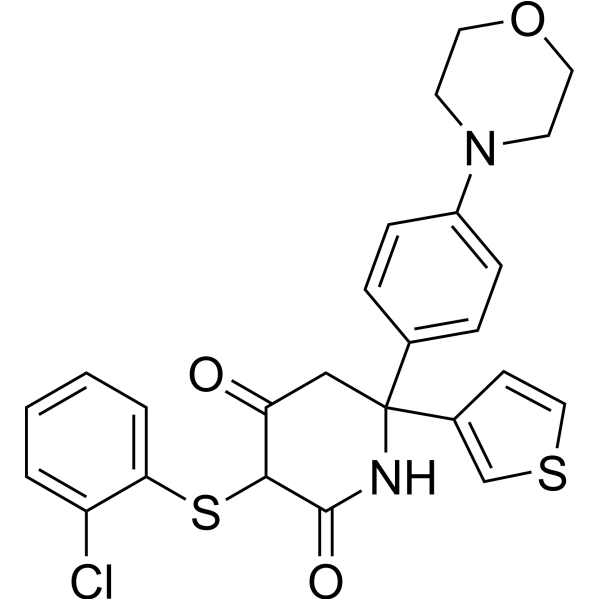
GNE-140 racemateLactate Dehydrogenase Inhibitor -

HY-100681R
GSK2837808A (Standard)LDHA Inhibitor -
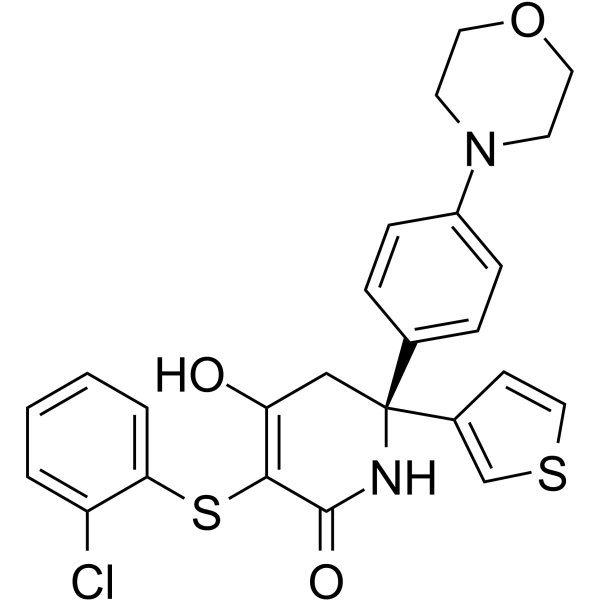
HY-100742B
(S)-GNE-140LDHA/LDHB Inhibitor -
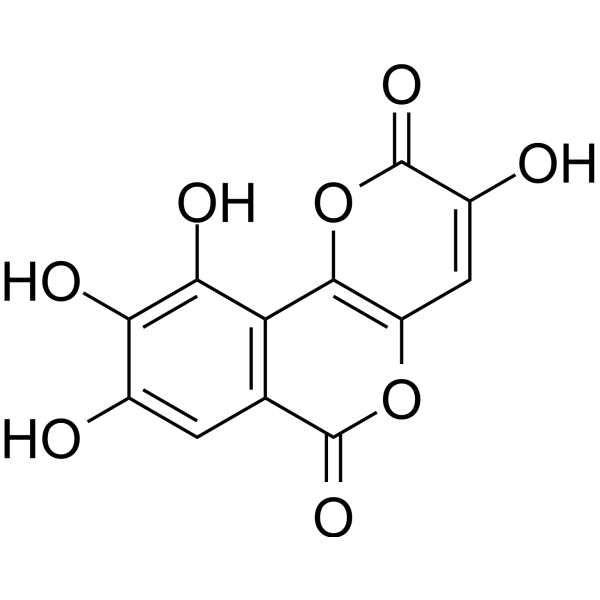
HY-W040118
GalloflavinLactate Dehydrogenase Inhibitor -
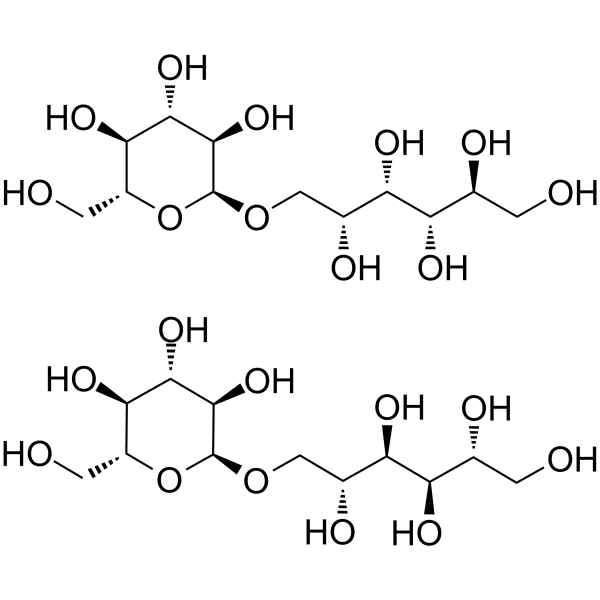
HY-N7393
IsomaltProtein-Stabilizing Excipient/Sweetener -
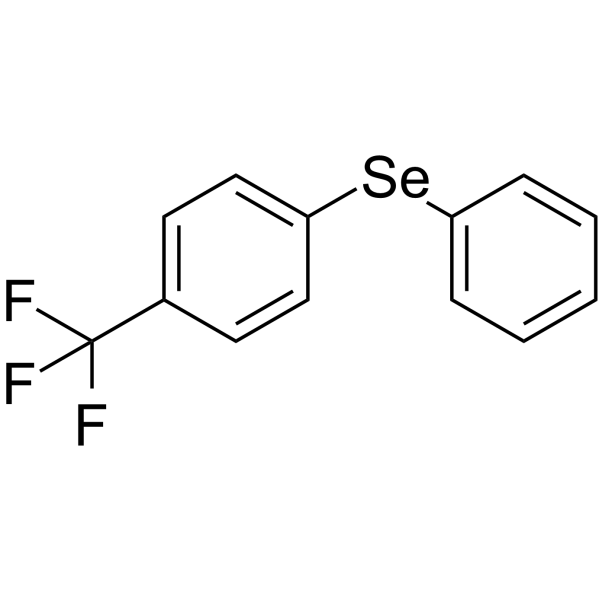
HY-139319
LDHA-IN-3LDHA Inhibitor


Biological Activity
Description
In Vitro
NHI-2 (50-200 μM, 8 h) inhibits lactate production in HeLa cells[1].
NHI-2 (12-40 μM, 72 h) inhibits proliferation in B78 cells[2].
NHI-2 (0.1-100 μM, 48 h) has an EC50 of 32 μM against B78 cells[2].
NHI-2 (40 μM, 24 h) increases cell apoptosis when combined with either 30 or 60 mM Oxamate (Oxa) (HY-W013032A)[2].
NHI-2 (40 μM, 24 h) induces cell cycle arrest at S/G2 phases[2].
NHI-2 affects extracellular acidification rate (ECAR) (12-26 μM, 80 min) and ATP (18 μM, 24 h) production, and has a synergistic effect with Oxa[2].
NHI-2 acts as NADH competitor, not
only affects glycolysis but also impacts mitochondrial metabolism and the NAD+/NADH
balance[2].
MedChemExpress (MCE) has not independently confirmed the accuracy of these methods. They are for reference only. Further protocols information, click here.
-
Cell Line:B78-D14 melanoma cells
-
Concentration:0.1-100 μM
-
Incubation Time:48 h
-
Result:The EC50 values of 32 μM.
-
Cell Line:B78-D14 melanoma cells
-
Concentration:12, 18, 26, 40, μM
-
Incubation Time:72 h
-
Result:Exhibited no effect on B78 cell proliferation at lower concentrations. but decreased cell proliferation at concentrations beginning from 26 μM.
-
Cell Line:B78-D14 melanoma cells
-
Concentration:40 μM
-
Incubation Time:24 h
-
Result:Increased cell apoptosis when combined with either 30 or 60 mM Oxa.
-
Cell Line:B78-D14 melanoma cells
-
Concentration:40 μM
-
Incubation Time:24 h
-
Result:Led to an increased cell population in the S and G2 phases.
In Vivo
MedChemExpress (MCE) has not independently confirmed the accuracy of these methods. They are for reference only.
-
Animal Model:C57BL/6 female mice (6-8 weeks) were intradermally implanted with B78 syngeneic melanoma cells[2]
-
Dosage:0.9 mg/kg
-
Administration:Intra-tumoral (IT) via percutaneous needle puncture; once daily for 15 days
-
Result:Suppressed tumor volume when combined with checkpoint inhibitors (ICIs).


Chemical Information
-
CAS No. 1269802-97-2
-
Appearance Solid
-
Molecular Weight 335.28
-
Formula C17H12F3NO3
-
Color White to off-white
-
SMILES
ON1C2=CC(C3=CC=CC=C3)=CC(C(F)(F)F)=C2C=C1C(OC)=O
-
Shipping
Room temperature in continental US; may vary elsewhere.
-
Storage
Powder -20°C 3 years In solvent -80°C 6 months -20°C 1 month


Solvent & Solubility
In Vitro:
DMSO : 25 mg/mL (74.56 mM; Need ultrasonic and warming; Hygroscopic DMSO has a significant impact on the solubility of product, please use newly opened DMSO)
Please refer to the solubility information to select the appropriate solvent. Once prepared, please aliquot and store the solution to prevent product inactivation from repeated freeze-thaw cycles.
Storage method and period of stock solution: -80°C, 6 months; -20°C, 1 month. When stored at -80°C, please use it within 6 months. When stored at -20°C, please use it within 1 month.
Please refer to the solubility information to select the appropriate solvent. Once prepared, please aliquot and store the solution to prevent product inactivation from repeated freeze-thaw cycles.
Storage method and period of stock solution: -80°C, 6 months; -20°C, 1 month. When stored at -80°C, please use it within 6 months. When stored at -20°C, please use it within 1 month.
Concentration (start) × Volume (start) = Concentration (final) × Volume (final)

Protocols
-
Annexin V plus membrane-impermeant dye apoptosis staining
Annexin V-based apoptosis assays rely on the detection of phosphatidylserine (PS) externalization from the inner leaflet of the plasma membrane to the outer leaflet, an early biochemical hallmark of apoptosis. Fluorescently labeled Annexin V binds PS in a calcium-dependent manner, enabling identification of early apoptotic cells by flow cytometry or fluorescence microscopy. When combined with a membrane-impermeant DNA-binding dye (e. g. , propidium iodide), this approach allows discrimination between viable (Annexin V−/dye−), early apoptotic (Annexin V+/dye−), and late apoptotic or necrotic (Annexin V+/dye+) cell populations by assessing membrane integrity and PS exposure.
-
BrdU Incorporation Assay
Bromodeoxyuridine (BrdU) incorporation assay is based on the principle that BrdU, a thymidine analog, is incorporated into newly synthesized DNA during the S phase of the cell cycle, thereby serving as a marker of DNA replication and cellular proliferation. Incorporated BrdU can be detected using anti-BrdU antibodies following DNA denaturation, enabling visualization or quantification of proliferating cells through immunochemical detection methods such as immunofluorescence or immunohistochemistry.
-
Patient-Derived Orthotopic Xenograft (PDOX)
Patient-derived orthotopic xenograft (PDOX) modeling implants fresh patient tumor tissue or patient-derived tumor cells into the anatomically corresponding organ or tissue site of immunodeficient mice, usually by surgical orthotopic implantation, to preserve patient tumor histology, local microenvironmental context, invasion, metastatic behavior, and treatment-response features better than subcutaneous implantation. PDOX readouts include tumor engraftment, orthotopic tumor growth, local invasion, metastasis, recurrence after resection, histologic similarity to the donor tumor, biomarker retention, molecular concordance, survival, and response or resistance to therapy. PDOX models are used for preclinical drug testing and individualized therapy evaluation, but engraftment success varies by tumor type and specimen quality.
-
Protocol for Cell Cycle
Cell-cycle analysis by flow cytometry measures DNA content in single cells to estimate the fraction of cells in G0/G1, S, and G2/M phases. Propidium iodide intercalates into DNA, and after RNA removal with RNase, fluorescence intensity reflects cellular DNA content: 2N cells are assigned to G0/G1, cells between 2N and 4N to S phase, and 4N cells to G2/M. DNA-content analysis alone cannot reliably separate G0 from G1 or G2 from M. Ki-67 can distinguish quiescent G0 cells from cycling cells, EdU or BrdU incorporation marks active DNA synthesis in S phase, and phospho-histone H3 staining identifies mitotic cells within the 4N population.
-
Cell Viability Determination by MTT Colorimetric Assay
The following protocol uses the MTT colorimetric assay as a classic literature-established method for assessing cell viability/metabolic activity in cultured mammalian cells. MTT[3-(4,5-dimethylthiazol-2-yl)-2,5-diphenyltetrazolium bromide] is reduced by metabolically active cells to a colored formazan product; the amount of formazan is quantified spectrophotometrically and provides an indirect measure of metabolically active viable cells. Importantly, MTT reduction reflects cellular oxidoreductase/metabolic activity rather than an absolute direct count of living cells, so changes in cellular metabolism can alter the signal independently of cell number.
-
Apoptosis
Apoptosis, also called programmed cell death, is generally characterized by distinct morphological characteristics.
-
TUNEL staining for apoptotic DNA fragmentation
TUNEL staining detects DNA strand breaks by using terminal deoxynucleotidyl transferase to add labeled nucleotides to exposed 3′-OH DNA termini, generating either microscopic staining in fixed cells or tissue sections, or fluorescence/cytometric signal in cell suspensions. TUNEL positivity reflects DNA fragmentation but should not be interpreted alone as definitive apoptosis, because TUNEL can also label necrotic, autolytic, mechanically damaged, or DNA-repair-associated DNA breaks.
-
Cell Cytotoxicity Assay
Cytotoxicity assays are usually based on the assessment of cell membrane damage, which can also be indirectly detected by measuring cell viability. Detection methods include MTT assay, CKK-8 assay, LDH assay and ATP assay, etc.
-
Flow cytometric DNA-content cell-cycle staining
Flow cytometric DNA-content cell-cycle staining measures the fluorescence intensity of DNA-bound fluorochromes in single cells or nuclei to estimate DNA content distributions, allowing assignment of populations to G0/G1, S, and G2/M phases by DNA histogram deconvolution. Propidium iodide (PI) intercalates into DNA, and PI fluorescence is proportional to cellular DNA content when staining is performed under conditions that make DNA accessible and minimize non-DNA signal. Cells with G2/M DNA content are expected to show approximately twice the fluorescence intensity of G0/G1 cells, while S-phase cells occupy intermediate fluorescence values. PI-based DNA-content analysis can also detect cells with fractional DNA content, often reported as sub-G1, when DNA fragmentation and extraction during staining reduce retained DNA signal in apoptotic cells. DAPI is an alternative DNA fluorochrome for univariate DNA-content analysis, while bivariate approaches combining DNA content with proliferation
-
Patient-Derived Xenograft (PDX)
Patient-derived xenograft (PDX) models are generated by engrafting primary human tumor tissue directly into immunodeficient mice, allowing in vivo propagation of patient tumor biology without initial in vitro adaptation. These models are used to preserve key histopathological and molecular characteristics of the original tumor and enable assessment of tumor growth dynamics and therapeutic response in a living organism. The biological readout is tumor engraftment and subsequent growth in the murine host, which reflects the ability of human tumor cells to survive, vascularize, and expand in an immunocompromised microenvironment.
-
Apoptosis Solutions
Apoptosis is a regulated, generally non-lytic cell-death pathway that removes unwanted, damaged, infected, or abnormal cells through coordinated morphological changes, caspase activation, DNA fragmentation, and membrane remodeling. The intrinsic apoptosis pathway is controlled mainly by mitochondrial outer membrane permeabilization, BCL-2 family proteins, cytochrome c release, apoptosome formation, caspase-9 activation, and downstream executioner caspase-3/7 activation. The extrinsic apoptosis pathway is initiated by death receptors such as Fas, TNFR, and TRAIL receptors, which recruit adaptor proteins and activate caspase-8 before engaging executioner caspases or mitochondrial amplification through BID cleavage. Apoptosis is linked to many phenotypes, including cancer cell killing, tissue homeostasis, immune regulation, neurodegeneration, infection response, and treatment-induced cytotoxicity; unresolved questions include how apoptosis interacts with necroptosis, pyroptosis, ferroptos
-
Subcutaneous Cell-Line-Derived Xenograft
Subcutaneous cell-line-derived xenograft (CDX) models are established by implanting cultured human cancer cell lines into immunodeficient mice, where the injected cells form localized tumors that can be monitored in vivo as a measure of tumorigenic potential, growth kinetics, and treatment response. These models are widely used in oncology research because they allow reproducible tumor formation and enable comparative assessment of tumor growth between different cell lines or genetic manipulations in a controlled in vivo microenvironment. Subcutaneous implantation of cancer cells in immunodeficient mice is a standard approach for evaluating tumor growth behavior and therapeutic response across multiple cancer types, including prostate, esophageal, pancreatic, and colon cancer models.
-
Orthotopic Cell-Line Xenograft
Orthotopic cell-line xenograft models involve implantation of human cancer cell lines into the anatomically corresponding organ of immunodeficient mice to reproduce tumor growth within a native microenvironment, enabling more clinically relevant tumor behavior compared with subcutaneous models. These models are widely used because orthotopic placement better recapitulates tumor progression, including invasion and metastatic spread, which are often underrepresented in heterotopic implantation systems. Compared with conventional xenografts, orthotopic implantation is described as more technically complex but provides improved simulation of tumor-microenvironment interactions and metastatic behavior, making it particularly valuable for translational oncology research. Surgical orthotopic implantation approaches have been emphasized as enabling faithful reproduction of clinical cancer features, including metastasis and disease progression patterns that align with the tumor’s organ of origi


Purity & Documentation
-
Data Sheet (279 KB)
-
SDS (251 KB)
- English - EN (251 KB)
- Français - FR (251 KB)
- Deutsch - DE (251 KB)
- Norwegian - NO (251 KB)
- Español - ES (251 KB)
- Swedish - SV (251 KB)
- Italian - IT (251 KB)
- Korean - KR (251 KB)
- Portuguese - PT (251 KB)
-
Handling Instructions (2659 KB)
References


Complete Stock Solution Preparation Table
Please refer to the solubility information to select the appropriate solvent. Once prepared, please aliquot and store the solution to prevent product inactivation from repeated freeze-thaw cycles.
Storage method and period of stock solution: -80°C, 6 months; -20°C, 1 month. When stored at -80°C, please use it within 6 months. When stored at -20°C, please use it within 1 month.
| Optional Solvent | Concentration Solvent Mass | 1 mg | 5 mg | 10 mg | 25 mg |
|---|---|---|---|---|---|
| DMSO | 1 mM | 2.9826 mL | 14.9129 mL | 29.8258 mL | 74.5645 mL |
| 5 mM | 0.5965 mL | 2.9826 mL | 5.9652 mL | 14.9129 mL | |
| 10 mM | 0.2983 mL | 1.4913 mL | 2.9826 mL | 7.4565 mL | |
| 15 mM | 0.1988 mL | 0.9942 mL | 1.9884 mL | 4.9710 mL | |
| 20 mM | 0.1491 mL | 0.7456 mL | 1.4913 mL | 3.7282 mL | |
| 25 mM | 0.1193 mL | 0.5965 mL | 1.1930 mL | 2.9826 mL | |
| 30 mM | 0.0994 mL | 0.4971 mL | 0.9942 mL | 2.4855 mL | |
| 40 mM | 0.0746 mL | 0.3728 mL | 0.7456 mL | 1.8641 mL | |
| 50 mM | 0.0597 mL | 0.2983 mL | 0.5965 mL | 1.4913 mL | |
| 60 mM | 0.0497 mL | 0.2485 mL | 0.4971 mL | 1.2427 mL |


NHI-2 Related Classifications
HY-124309 Related Classifications
 Powered by Bioz