



QL9
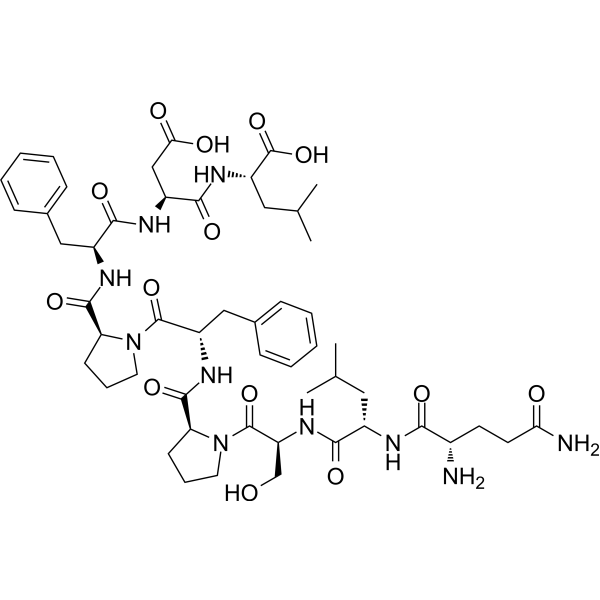
QL9 (QLSPFPFDL) is a high-affinity alloantigen for the 2C T cell receptor (TCR).
For research use only. We do not sell to patients.
- CAS No.: 159646-83-0
- Formula: C52H74N10O14
- Molecular Weight:1063.20
-
Storage:
Sealed storage, away from moisture.
Powder -80°C, 2 years , -20°C, 1 year* In solvent : -80°C, 6 months; -20°C, 1 month (sealed storage, away from moisture)

To place orders, for customer services and technical support, please contact: MedChemExpress USA
Tel: 609-228-6898 E-mail: [email protected] [email protected]


-
 Biological Activity
-
Chemical Information
- Protocols
- Purity & Documentation
- References
-
 Help & FAQs




Biological Activity
Description
IC50 & Target
TCR[1]
In Vitro
Mouse T cell clone 2C recognizes two different major histocompatibility (MHC) ligands, the self MHC Kb and the allogeneic MHC Ld. Two distinct peptides, SIY (SIYRYYGL) and QL9 (QLSPFPFDL), act as strong and specific agonists when bind to Kb and Ld, respectively. QL9 binding to MHC Ld is influenced by the majority of peptide side chains, distributed across the entire length of the peptide. Findings with both systems, but QL9-Ld in particular, suggest that many single-residue substitutions, introduced into peptides to improve their binding to MHC and thus their vaccine potential, could impair T cell reactivity due to their dual impact on TCR binding. T cell activation assays are performed to measure effects of peptide SIY and QL9 residues on T cell function[2].
MedChemExpress (MCE) has not independently confirmed the accuracy of these methods. They are for reference only.


Chemical Information
-
CAS No. 159646-83-0
-
Appearance Solid
-
Molecular Weight 1063.20
-
Formula C52H74N10O14
-
Color White to off-white
-
Sequence
Gln-Leu-Ser-Pro-Phe-Pro-Phe-Asp-Leu
-
Sequence Shortening
QLSPFPFDL
-
Shipping
Room temperature in continental US; may vary elsewhere.
-
Storage
Sealed storage, away from moisture
Powder -80°C 2 years -20°C 1 year * In solvent : -80°C, 6 months; -20°C, 1 month (sealed storage, away from moisture)


Purity & Documentation
-
Data Sheet (263 KB)
-
SDS (252 KB)
- English - EN (252 KB)
- Français - FR (252 KB)
- Deutsch - DE (252 KB)
- Norwegian - NO (252 KB)
- Español - ES (252 KB)
- Swedish - SV (252 KB)
- Italian - IT (252 KB)
- Korean - KR (252 KB)
- Portuguese - PT (252 KB)
-
Handling Instructions (2659 KB)
References
[1]. Speir JA, et al. Structural basis of 2C TCR allorecognition of H-2Ld peptide complexes. Immunity. 1998 May;8(5):553-62. [Content Brief]
[2]. Bowerman NA, et al. Different strategies adopted by K(b) and L(d) to generate T cell specificity directed against their respective bound peptides. J Biol Chem. 2009 Nov 20;284(47):32551-61. [Content Brief]

Calculators
Concentration (start) × Volume (start) = Concentration (final) × Volume (final)


QL9 Related Classifications
HY-P0287 Related Classifications
 Powered by Bioz