Cancer remains the leading cause of death worldwide, with significant heterogeneity at the protein level driving differential treatment responses and disease progression. Mass spectrometry (MS)-based proteomics offers a powerful approach to characterize this heterogeneity, allowing the identification of biomarkers, therapeutic targets, and molecular mechanisms, paving the way for innovative strategies to improve the precision of treatment strategies.
This review examines three interconnected aspects: sample preparation technologies and workflows for MS-based proteomics; isotope-labeled and label-free quantification approaches; and applications and frontiers in cancer proteomics.
- Sample Preparation Technologies and Workflows
- Quantitative Proteomics Approaches
- Applications and Frontiers in Cancer Proteomics
(1).jpg)
Figure 1. Comparison of bottom-up and top-down[1].
Modern proteomics primarily relies on liquid chromatography-tandem mass spectrometry (LC-MS/MS) for high-throughput and sensitive analysis of complex proteomes, largely replacing earlier gel-based methods that were limited in throughput and coverage. LC-MS/MS workflows are broadly categorized into bottom-up and top-down strategies.
Bottom-up | Top-down | |
|---|---|---|
| Analysis target | Peptides (generated from proteins via enzymatic hydrolysis) | Intact Proteins (no enzymatic digestion required) |
| Applicability | (1) Widely used for routine proteomics analysis (2) Suitable for studies on complex biological samples, such as cells, tissues, or biofluids | Particularly suitable for detailed structural characterization of specific proteins, including the identification and analysis of post-translational modifications (PTMs). |
Currently, the bottom-up approach is preferred because peptides are generally easier to separate and identify than intact proteins[2]. The following sections focus on the bottom-up methodology.
The LC-MS/MS-based proteomics workflow consists of three main steps: sample preparation, protein/peptide separation, and data analysis[3]. Sample preparation is a critical stage that significantly influences the overall efficiency of proteomics research; however, it is prone to variability and can exhibit low reproducibility.
(1).jpg)
Figure 2. Bottom-up proteomics analysis workflow[3].
A typical bottom-up proteomics sample preparation workflow includes protein extraction, reduction/alkylation, enzymatic digestion, fractionation, and desalting. The desalted sample is subsequently enriched and analyzed by LC-MS/MS.
Among these steps, protein extraction and enzymatic digestion are particularly critical, as they directly impact the accuracy of protein quantification and downstream MS analysis. These two steps are discussed in detail below.
1. Protein Extraction
The first step in a bottom-up proteomics workflow involves obtaining a protein mixture from a biological sample. This process typically includes sample pretreatment, enzyme inhibition, homogenization, protein extraction/precipitation, and protein fractionation, with specific procedures varying according to sample type.
| Sample type | Processing method |
|---|---|
| Cell samples | Cells are generally homogenized in a lysis buffer containing enzyme inhibitors at low temperatures, followed by sonication. |
| Blood / Urine | (1) Proteins from urine can be extracted using solvent precipitation, ultrafiltration, centrifugation, dialysis, and lyophilization. (2) Blood samples are typically processed via centrifugation to obtain plasma or serum. Note: MS is subject to ion suppression effects, where low-abundance ions can be suppressed by high-abundance ions, making them difficult to detect. Therefore, plasma and serum are often preprocessed to remove high-abundance proteins, allowing detection of low-abundance proteins. |
| Tissue samples | Tissue samples are rinsed with pre-chilled PBS to remove blood and fat. The tissue is then lysed using liquid nitrogen grinding or homogenization, followed by RIPA buffer-assisted sonication. Unlysed tissue fragments and other impurities, such as connective tissue, are removed by centrifugation to collect the supernatant. |
2. Enzymatic Digestion
Enzymatic digestion involves cleaving proteins into peptides using proteases for subsequent MS analysis.
Prior to digestion, reducing agents such as DTT or TCEP are added to break disulfide bonds, and alkylating agents such as iodoacetamide (IAA) or chloroacetamide (CAA) are used to block free thiols, further disrupting the protein secondary structures and improving digestion efficiency.
Various proteases can be employed, including chymotrypsin, trypsin, endopeptidase Lys-C, endopeptidase Glu-C, and endopeptidase Asp-N.
| Product name | Protease type | Cleavage site | Enzymes/protein ratio (wt/wt) | Reaction temperature (°C) |
|---|---|---|---|---|
| Trypsin (MS grade) | Serine protease | C-terminal of R and K | 1/20-1/100 | 37 |
| Endoproteinase Lys-C | Serine protease | C-terminal of K | 1/50-1/200 | 37 |
| Endoproteinase Glu-C | Serine protease | C-terminal of D | 1/20-1/100 | 25 |
| Endoproteinase Asp-N | Metalloproteinases | N-terminal of D | 1/10-1/50 | 37 |
These preparation steps yield peptide mixtures suitable for downstream LC-MS/MS analysis.
Beyond sample preparation, the next critical step is protein quantification—the conversion of peptide signals into measures of relative abundance. Current strategies are broadly divided into two categories: label-free methods, which correlate ion intensities across discrete LC-MS acquisitions, and stable isotope labeling, which introduces mass tags at defined stages—such as metabolic incorporation (SILAC; Stable Isotope Labeling by Amino acids in Cell culture) or post-digest chemical modification (TMT; Tandem Mass Tag)—enabling multiplexed analysis within a single run.
(1).jpg)
Figure 3. General workflow for label-free MS-based proteomics. Arrows indicate the sequential stages of the workflow, starting with sample processing[4].
Label-free quantification was the earliest practical approach for MS-based protein quantification, requiring no chemical derivatization and relying solely on correlating peptide MS signal intensities with relative abundance.
However, stochastic precursor ion selection in data-dependent acquisition (DDA) often generates high rates of missing values, and chromatographic variability introduces substantial quantitative noise. These limitations prompted the development of stable isotope labeling methods, which allow multiple samples to be analyzed simultaneously within a single MS run, improving both accuracy and reproducibility.
Stable isotope labeling strategies enable the pooling of multi-channel samples by introducing mass tags at defined workflow stages, thereby minimizing batch effects and achieving high quantitative accuracy. This section focuses on SILAC and TMT as representative examples of metabolic and chemical isobaric labeling approaches, respectively, which together represent the majority of quantitative proteomics applications in cancer research. Other chemical labeling strategies, such as dimethylation and isotope-coded affinity tags (ICAT), provide cost-effective alternatives for lower-plex experiments while adhering to similar quantitative principles.
(1).jpg)
Figure 4. Overview of SILAC experiment[5].
(a) Adaptation phase: cells are cultured in light or heavy SILAC medium until complete incorporation of heavy amino acids. (b) Experimental phase: cell populations undergo differential treatments, are mixed, and analyzed by MS.
Metabolic Labeling with SILAC
Stable isotope labeling by amino acids in cell culture (SILAC), first described by Ong and Mann in 2002, incorporates stable isotopes during active protein synthesis by culturing cells in media containing heavy amino acids such as 13C6-lysine and 13C6-arginine. As illustrated in Figure 4, after approximately five cell doublings, the heavy amino acids are fully incorporated into the cellular proteome.
Because differently labeled samples can be combined immediately after cell lysis—prior to protein extraction and enzymatic digestion—this approach effectively eliminates quantitative errors arising from downstream sample handling, establishing SILAC as the gold standard for cell culture–based quantitative proteomics.
Chemical Isobaric Tagging with TMT
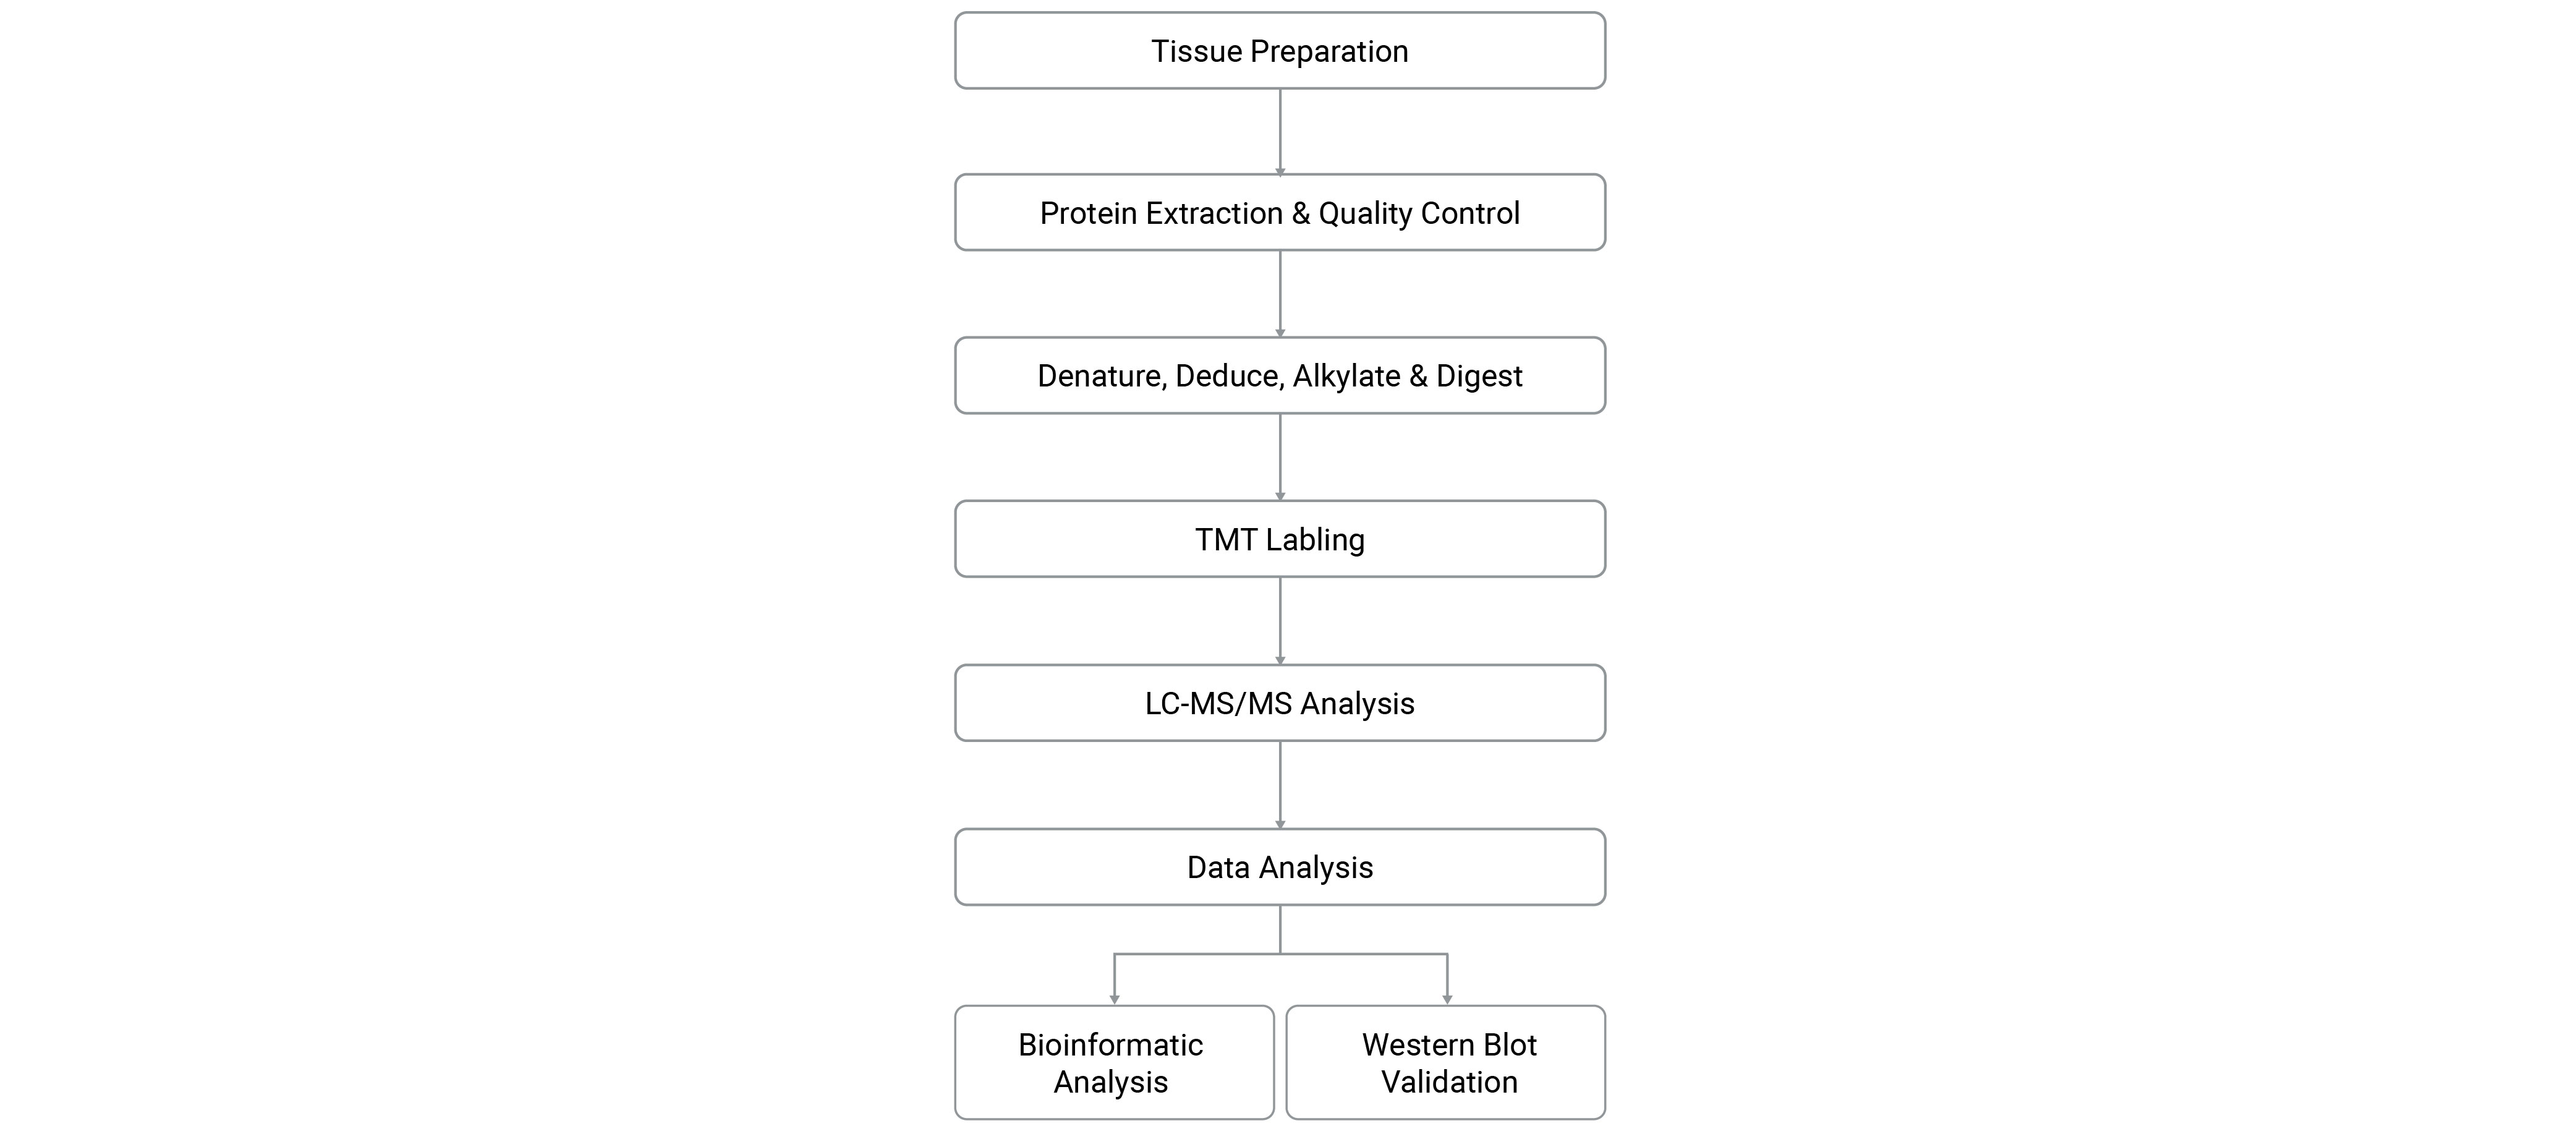
Figure 5. General workflow for LC-MS/MS analysis coupled with TMT reagent labeling[6].
For clinical specimens where metabolic labeling is impractical, tandem mass tag (TMT) reagents provide a versatile solution for multiplexed quantitative proteomics. TMT consists of isobaric mass tags containing an amine-reactive NHS-ester group, a mass balancer, and a reporter group with differential 13C and 15N isotopes. Labeled peptides from distinct samples coelute as a single peak in the MS1 spectra, whereas fragmentation in MS2 releases sample-specific reporter ions, enabling 16-plex to 18-plex quantification.
This high degree of multiplexing makes TMT particularly suitable for large-scale clinical cohort studies involving tissue biopsies and biofluids.
Collectively, these quantitative strategies transform proteomics from a primarily qualitative inventory into a precise measurement of protein abundance dynamics. Whether through label-free chromatographic alignment, metabolic incorporation of heavy isotopes, or isobaric chemical tagging, MS-based quantification provides the numerical foundation for identifying disease-associated protein alterations and prioritizing candidates for clinical validation.
MS-based proteomics has enabled the discovery of novel biomarkers with clinical potential across a variety of high-mortality cancers. Representative studies leveraging quantitative proteomics for cancer biomarker identification are summarized in Table 4.
Cancer type | Sample type | Labeling strategy | Potential biomarkers | Biomarker feature |
|---|---|---|---|---|
| Liver | clinical tissue | TMT | pyrroline-5-carboxylate reductase 2 (PYCR2), alcohol dehydrogenase 1A (ADH1A), phospho-aldolase A (ALDOA) | involved in HCC metabolic reprogramming, enhanced glycolysis, and cell proliferation |
| Prostate | LAPC4 | SILAC | α(1,6)-fucosyltransferase (FUT8) | increased oncogenic activity and metastasis |
| clinical serum | iTRAQ | CD59, haptoglobin, tetranectin | correlated with bone metastasis | |
| Pancreas | clinical serum | iTRAQ | apolipoprotein A-1 (APOA1), transferrin (TF) | correlated with histological differentiation |
| clinical tissue | TMT | melanocyte inducing transcription factor (MITF), transcription factor binding to IGHM enhancer 3 (TFE3), transcription factor EB (TFEB) | increased activation of anabolic pathways, autophagy, and lysosomal catabolism | |
| Breast | clinical tissue | TMT | fatty acid-binding protein-7 (FABP7) | increased progression and metastasis |
| MCF7, MDA-MB-231 | DiLeu | methylated pyruvate kinase M2 (PKM2) | increased cell proliferation, migration, and metastasis | |
| Ovarian | OV-90 | SILAC | calcium-activated chloride channel 1 (CLCA1) | increased cell aggregation |
| clinical plasma | TMT | fibrinogen alpha chain (FGA), gelsolin (GSN) | correlated with tumorigenesis and metastasis | |
| Lung | A549 | TMT | threonine tyrosine kinase (TTK) | increased tumorigenesis |
| CL1-5 | SILAC | karyopherin alpha 2 (KPNA2) | increased cell migration |
Beyond diagnostics, proteomics provides actionable insights to guide therapeutic strategies:
• Chemotherapy resistance prediction: Li et al. performed proteomics profiling of 254 colorectal cancer patients and developed a resistance prediction model for various treatment regimens (FOLFOX, FOLFOX + radiotherapy, FOLFOX + cetuximab), offering a rational basis for selecting alternative therapies[8].
• Molecular subtype-guided targeted therapy: Shi et al.'s proteomic and phosphoproteomic analysis of gastric cancer revealed that diffuse-type gastric cancer may respond to CDK4/6 inhibitors, whereas intestinal-type gastric cancer may benefit from ATM/ATR inhibitors[9].
• Precise HER2 quantification: CPTAC developed a targeted MS assay for accurate quantification of HER2 in breast cancer. This method, applied in CLIA-certified laboratories, provides a reliable alternative when traditional immunohistochemistry (IHC) results are ambiguous[10].
The tumor microenvironment (TME) comprises diverse cell types—including cancer cells, immune cells, and fibroblasts—and its heterogeneity critically influences drug response and prognosis. Traditional bulk analyses fail to capture this complexity, whereas single-cell proteomics integrated with spatial information provides a powerful tool for dissecting cellular heterogeneity.
For instance, SISPOT combined with laser capture microdissection (LCM) or IHC has successfully resolved the proteomes of specific cell types in colon tumors—including cancer cells, lymphocytes, intestinal epithelial cells, and myocytes—and revealed signaling interactions between cancer-associated fibroblasts (CAFs) and cancer cells in hepatocellular carcinoma[11-12]. Similarly, LCM-nanoPOTS technology has been applied to region-specific proteomic analysis in pancreatic, liver, uterine, and brain tissues[13].
In recent years, Deep Visual Proteomics (DVP) has emerged, combining high-resolution imaging, AI-driven image analysis, laser microdissection, and ultrasensitive MS to profile cell- and subcellular-level phenotypes in complex tissues while preserving spatial information[14]. Its enhanced version single-cell DVP (scDVP), further enables the direct mapping of single-cell proteomes within intact tissue architecture. Additionally, DISCO-MS technology integrates 3D imaging with proteomics analysis at the whole-organ or organismal level, providing a systemic perspective on complex disease biology[15].
MS-based proteomics has evolved into a robust framework for investigating cancer biology at the protein level. Advances in sample preparation strategies and quantitative proteomics approaches have established a solid technical foundation for high-resolution and reproducible protein analysis. Building on this, proteomics not only enables the identification of potential biomarkers in tissues and body fluids but also supports molecular subtyping, drug resistance prediction, and targeted therapy. Moreover, advances in single-cell and spatial proteomics technologies now enable the analysis of complex TME heterogeneity, offering new insights into tumorigenesis, disease progression, and therapeutic response.
Category | Product Name | Cat. No. | Description |
|---|---|---|---|
| Isotope-Labeled Compounds | L-Arginine-d7 hydrochloride | HY-N0455AS2 | The deuterium labeled L-Arginine hydrochloride. |
| L-Leucine-13C | HY-N0486S1 | The 13C-labeled L-Leucine. | |
| L-Methionine-15N | HY-N0326S | The 15N-labeled L-Methionine. | |
| L-Proline-13C5 | HY-Y0252S | The 13C-labeled L-Proline. | |
| Reference Standards | L-Arginine (Standard) | HY-N0455R | The analytical standard of L-Arginine. |
| L-Leucine (Standard) | HY-N0486R | The analytical standard of L-Leucine. | |
| L-Methionine (Standard) | HY-N0326R | The analytical standard of L-Methionine. | |
| L-Proline (Standard) | HY-Y0252R | The analytical standard of L-Proline. |
Note: MCE can provide products for research use only. We do not sell to patients.
 LinkedIn
 Researchgate
 Instagram
 X
X Facebook
 WhatsApp
 Reddit
 Mail
Mail- [1]. Zhang Z, et al. Annu Rev Anal Chem (Palo Alto Calif). 2014;7:427-454. [Content Brief]
- [2]. Miller RM, et al. Analyst. 2023 Jan 31;148(3):475-486. [Content Brief]
- [3]. Duong V.-A, et al. Appl. Sci. 2021, 11(8):2076-3417.
- [4]. Connolly EA, et al. Front Oncol. 2023 May 1;13:1126736. [Content Brief]
- [5]. Ong SE, et al. Mol Cell Proteomics. 2002 May;1(5):376-86. [Content Brief]
- [6]. Dai J, et al. J Cancer. 2020 Aug 25;11(20):6122-6132. [Content Brief]
- [7]. Wang, Zicong, et al. ACS Meas Sci Au. 2024 Apr 15;4(4):315-337. 2024. [Content Brief]
- [8]. Li Y, et al. Cell Rep Med. 2023 Dec 19;4(12):101311. [Content Brief]
- [9]. Shi W, et al. Nat Commun. 2023 Feb 14;14(1):835. [Content Brief]
- [10]. Kennedy JJ, et al. Anal Chem. 2022 Jul 12;94(27):9540-9547. [Content Brief]
- [11]. Xu R, et al. Anal Chem. 2018;90(9):5879-5886. [Content Brief]
- [12]. Huang P, et al. Anal Chim Acta. 2020 Aug 29;1127:140-148. [Content Brief]
- [13]. Xiang P, et al. ACS Meas Sci Au. 2023 Oct 20;3(6):459-468. [Content Brief]
- [14]. Mund A, et al. Nat Biotechnol. 2022 Aug;40(8):1231-1240. [Content Brief]
- [15]. Rosenberger FA, et al. Nat Methods. 2023 Oct;20(10):1530-1536. [Content Brief]