



NIR-Red Dead Cell-1 Dye

Based on 1 Customer Validation
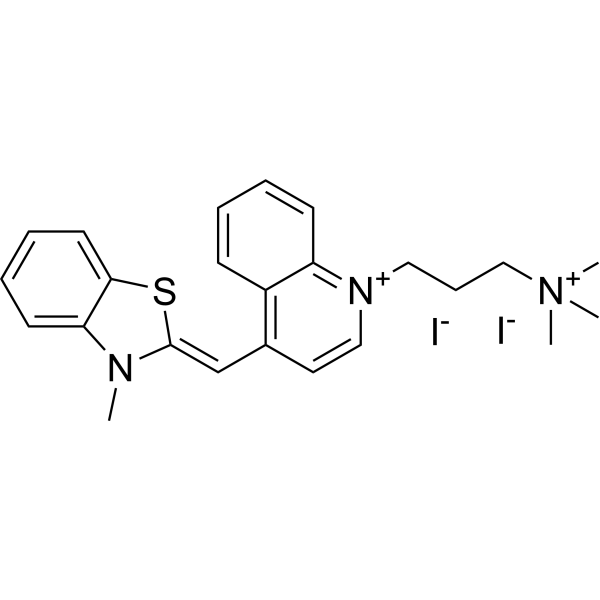
NIR-Red Dead Cell-1 Dye is a DNA-binding fluorescent dye for non-living cells (Ex/Em=515 nm/531 nm). NIR-Red Dead Cell-1 Dye can intercalate into base pairs of double-stranded DNA and produce stronger fluorescence. NIR-Red Dead Cell-1 Dye is suitable for necrotic cells or late apoptotic cells with damaged cell membranes, showing green fluorescence under fluorescence microscopy or flow cytometry. NIR-Red Dead Cell-1 Dye can be used to distinguish live cells from dead cells and distinguish cell membrane integrity. NIR-Red Dead Cell-1 Dye can be attached to the surface of Feraheme (FH) nanoparticles (NPs) to obtain fluorescent dye-functionalized NPs for drug delivery studies.
For research use only. We do not sell to patients.
- Purity : 95%
- CAS No.: 157199-59-2
- Formula: C24H29I2N3S
- Molecular Weight:645.38
-
Storage:
Solution, -20°C, protect from light, 2 years

To place orders, for customer services and technical support, please contact: MedChemExpress USA
Tel: 609-228-6898 E-mail: [email protected] [email protected]


-
 Biological Activity
-
Chemical Information
- Protocols
- Purity & Documentation
- References
-
 Help & FAQs




Biological Activity
Description
In Vitro
NIR-Red Dead Cell-1 Dye (100 nM; 15 min) can accurately distinguish necrotic cells (binding to both) from live cells (showing only red autofluorescence) in flow cytometry experiments of Jurkat and HT-29 cells when co-stained with Annexin V-Cy5.5[1].
NIR-Red Dead Cell-1 Dye (64.5 μg/mL; 15 min) colocalizes with DAPI in confocal microscopy experiments and binds to nuclear DNA specifically labeled with green fluorescence in Jurkat cells treated with Camptothecin (HY-16560)[1].
NIR-Red Dead Cell-1 Dye (100 nM; 15 min) reflects cell death more accurately than 5-CFDA-AM (HY-131131) in viability assays of algal cells such as Brachiomonas submarina and Tetraselmis suecica[2].
NIR-Red Dead Cell-1 Dye can be used to directly measure live and dead cells adhering to diatoms[3]. TO-PRO-1 can only stain dead cells. When NIR-Red Dead Cell-1 Dye was used to stain the marine diatom Nitzchia closterium, live and dead cells were identified as red and yellow, respectively, under a blue-excited epifluorescence microscope. Live cells appear red due to the autofluorescence of intracellular chlorophyll, while dead cells appear yellow due to the fluorescence of TO-PRO-1[3].
Guide (The following is our recommended solution. This solution is merely a guideline and should be modified according to your specific needs.)
1. Cell Preparation
The cells (such as Jurkat, HT-29 or algal cells) are suspended in phosphate-buffered saline (PBS) at a density of 1×10⁵-1×10⁶ cells/mL.
Induce cell necrosis by treating with Camptothecin (HY-16560) (5 μM, 10 h), 5-FU (HY-90006)/Oxaliplatin (HY-17371), or γ-irradiation (lethal dose: 2400-4800 Gy).
2. Staining Protocol
Dye Preparation: Prepare the 1 mM DMSO stock solution of NIR-Red Dead Cell-1 Dye and dilute it to 100 nM (for mammalian cells) or 64.5 μg/mL (for algal cells) using PBS.
Sample Incubation: Add 5 μL of the dye to 30 μL of the cell suspension, mix gently, and incubate at room temperature in the dark for 15 minutes.
Cleaning (for algal cells): Centrifuge at 2,500 g for 2 minutes, discard the supernatant, and resuspend in fresh PBS to reduce background fluorescence.
3. Detection Method
① Fluorescence Microscopy Method: Use a confocal fluorescence microscope with a blue filter (excitation: 400-550 nm, emission: 531 nm) to detect the green fluorescence of NIR-Red Dead Cell-1 Dye.
Count at least 300 cells, and distinguish between dead cells (bright green cell nucleus) and live cells (red chlorophyll autofluorescence in algae or no green fluorescence in mammalian cells).
② Flow Cytometry Method: Use 488 nm excitation light to detect the emission at 530-550 nm.
Set gates based on forward/side scatter and fluorescence intensity to quantify the necrotic cell population.
4. Control Settings
Positive Control: 100% live cells (untreated, expected low binding rate of NIR-Red Dead Cell-1 Dye).
Negative Control: 100% non-living cells (radiation killed, expected high binding rate of NIR-Red Dead Cell-1 Dye).
MedChemExpress (MCE) has not independently confirmed the accuracy of these methods. They are for reference only.


Chemical Information
-
CAS No. 157199-59-2
-
Appearance Liquid
-
Molecular Weight 645.38
-
Formula C24H29I2N3S
-
Color Brown to red
-
SMILES
C[N+](CCC[N+]1=C2C=CC=CC2=C(/C=C3SC4=CC=CC=C4N\3C)C=C1)(C)C.[I-].[I-]
-
Shipping
Room temperature in continental US; may vary elsewhere.
-
Storage
Solution, -20°C, protect from light, 2 years


Purity & Documentation
-
Data Sheet (273 KB)
-
SDS (251 KB)
- English - EN (251 KB)
- Français - FR (251 KB)
- Deutsch - DE (251 KB)
- Norwegian - NO (251 KB)
- Español - ES (251 KB)
- Swedish - SV (251 KB)
- Italian - IT (251 KB)
- Korean - KR (251 KB)
- Portuguese - PT (251 KB)
-
Handling Instructions (2659 KB)
References
[1]. Hoonsung Cho, et al. Fluorochrome-functionalized nanoparticles for imaging DNA in biological systems. ACS Nano. 2013 Mar 26;7(3):2032-41. [Content Brief]
[2]. Gorokhova E, et al. A comparison of TO-PRO-1 iodide and 5-CFDA-AM staining methods for assessing viability of planktonic algae with epifluorescence microscopy. J Microbiol Methods. 2012 Jun;89(3):216-21. [Content Brief]

Calculators
Concentration (start) × Volume (start) = Concentration (final) × Volume (final)


NIR-Red Dead Cell-1 Dye Related Classifications
HY-D0917 Related Classifications
 Powered by Bioz