



Dimethyl 2-oxoglutarate
Based on 4 publication(s) in Google Scholar
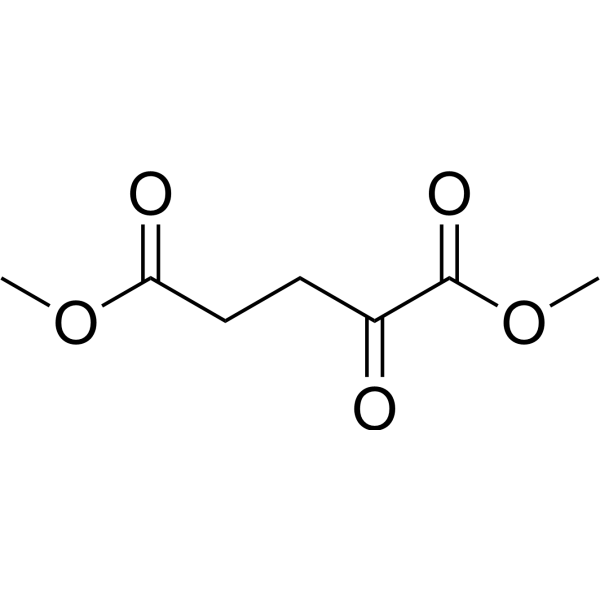
Dimethyl 2-oxoglutarate (Dimethyl α-ketoglutarate) is a cell-permeable derivative of 2-oxoglutarate and tricarboxylic acid cycle metabolite with antioxidant properties. Dimethyl 2-oxoglutarate inhibits Autophagy. Dimethyl 2-oxoglutarate prevents mitochondrial damage and reduces ROS production. Dimethyl 2-oxoglutarate alleviates Carbon tetrachloride (HY-Y0298)-induced liver fibrosis. Dimethyl-2-oxoglutaric acid can be used in the research of diseases such as Alzheimer's disease, diabetes, and cardiomyopathy.
For research use only. We do not sell to patients.
- Purity : 97.50%
- CAS No.: 13192-04-6
- Formula: C7H10O5
- Molecular Weight:174.15
-
Storage:Pure form -20°C, 3 years , 4°C, 2 years ; In solvent -80°C, 6 months , -20°C, 1 month

To place orders, for customer services and technical support, please contact: MedChemExpress USA
Tel: 609-228-6898 E-mail: [email protected] [email protected]


-
 Biological Activity
-
Chemical Information
-
Solvent & Solubility
- Protocols
- Purity & Documentation
- References
-
 Help & FAQs


-
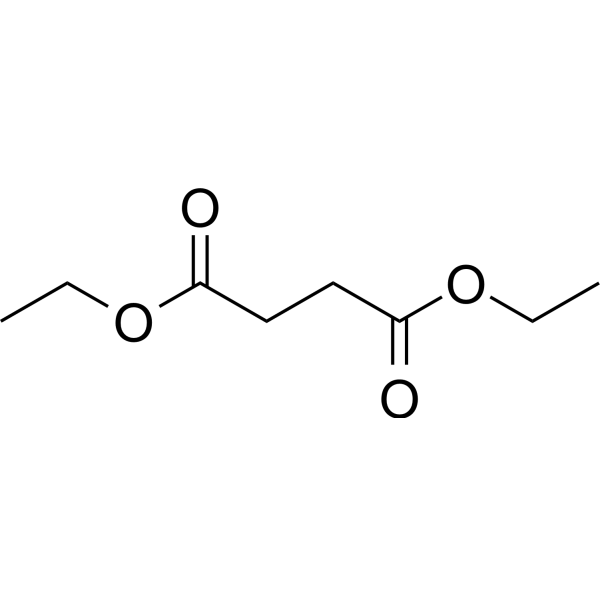
HY-Y0836
Diethyl succinateInflammation Protectant -
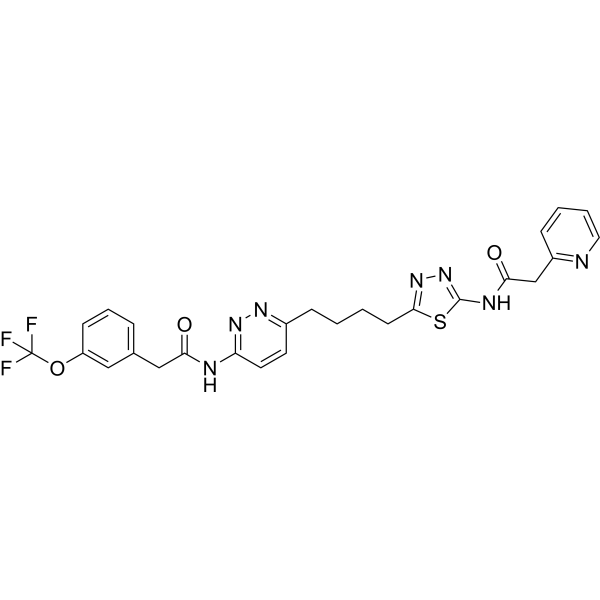
HY-12248
TelaglenastatGLS1 Inhibitor -

HY-Y0808
Dimethyl succinateSuccinate Analogue -
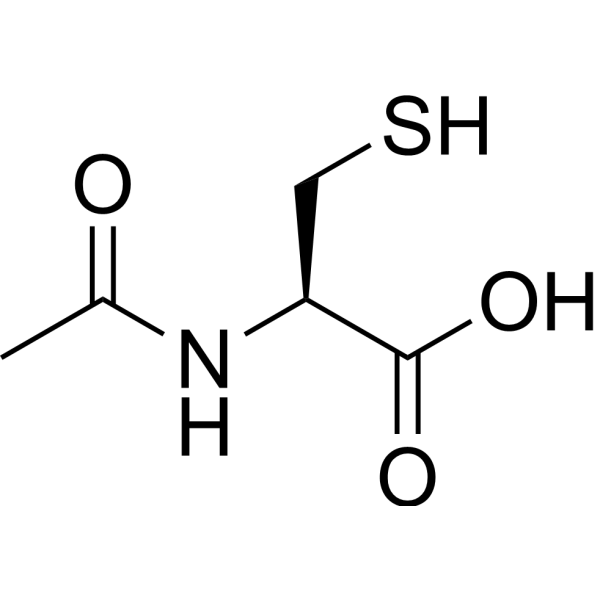
HY-B0215
AcetylcysteineMucolytic Agent -
HY-17363
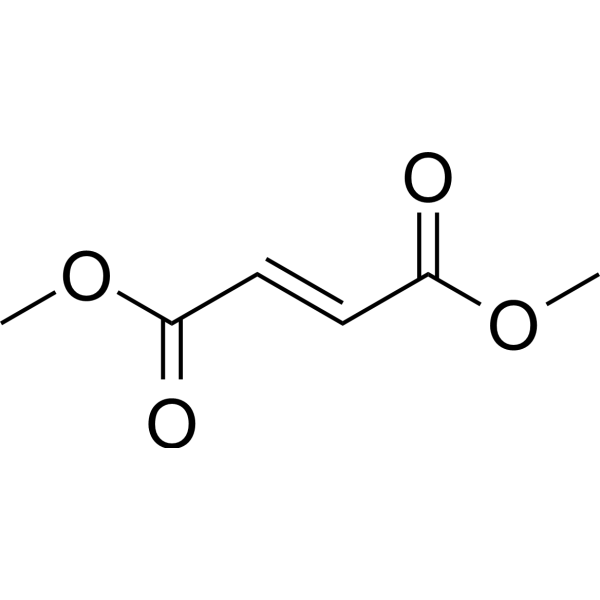
Dimethyl fumarateNrf2 Activator -
HY-12683
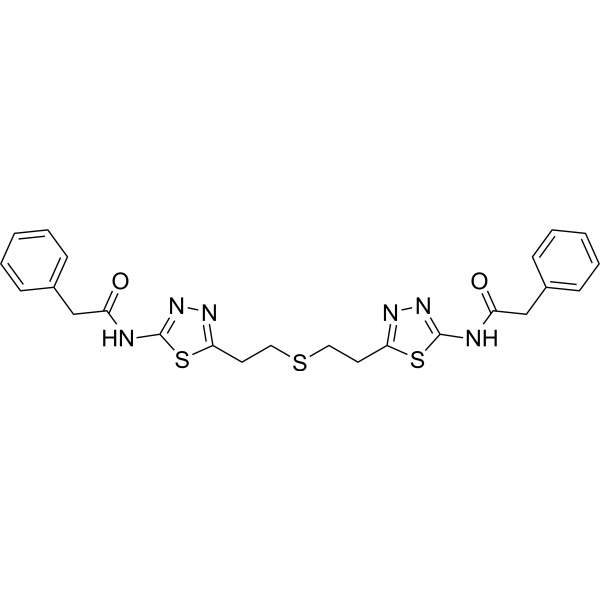
BPTESGlutaminase Inhibitor -
HY-W013636
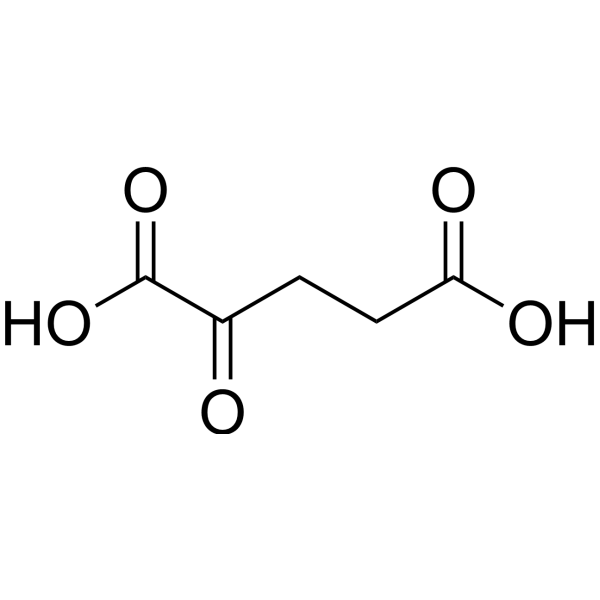
2-Ketoglutaric acidKrebs Cycle Intermediate -
HY-10219
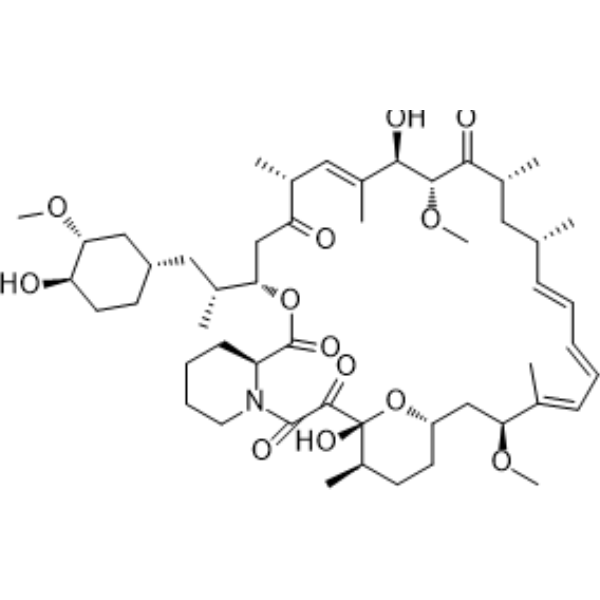
RapamycinmTOR Inhibitor -
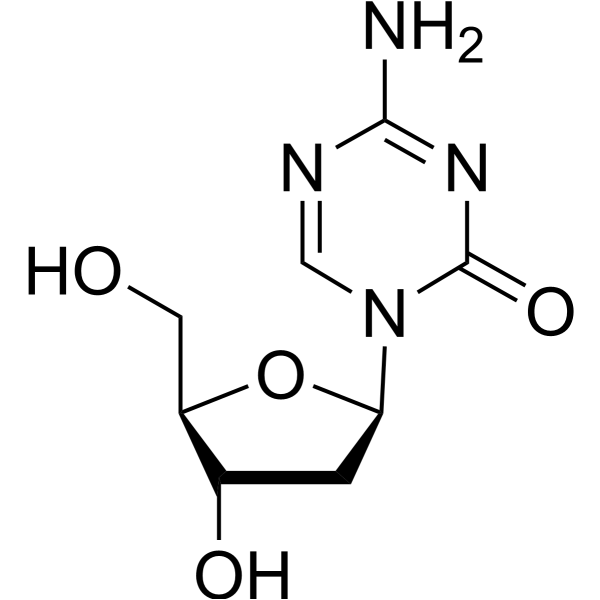
HY-A0004
DecitabineDNMT Inhibitor -
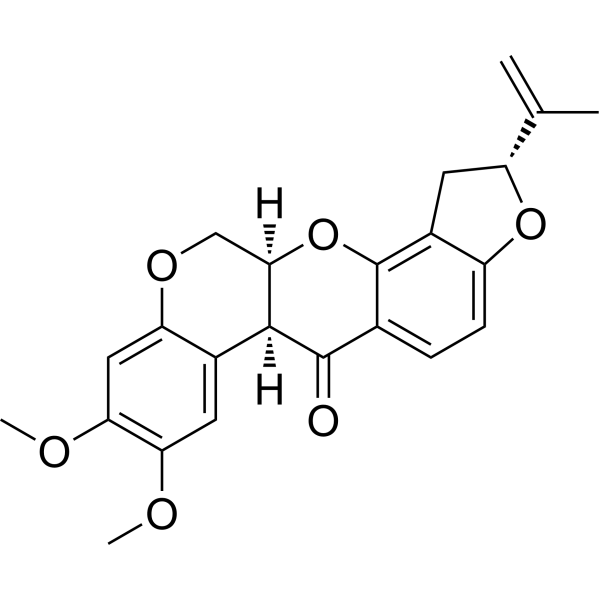
HY-B1756
RotenoneMitochondrial Complex I Inhibitor -
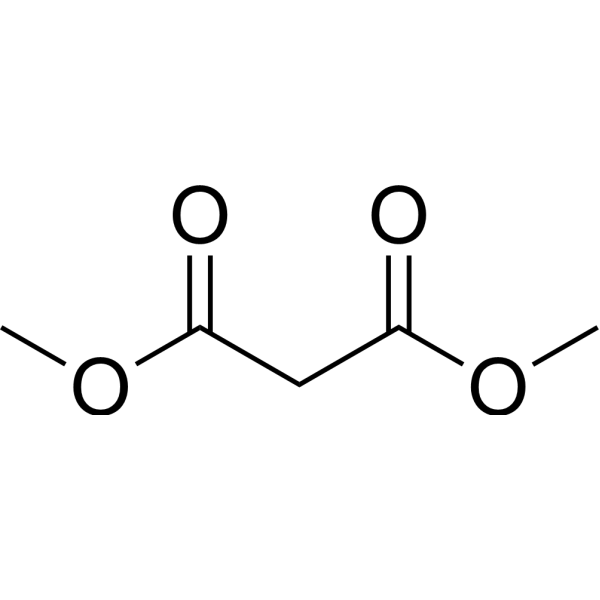
HY-Y1787
Dimethyl malonateSDH Inhibitor -
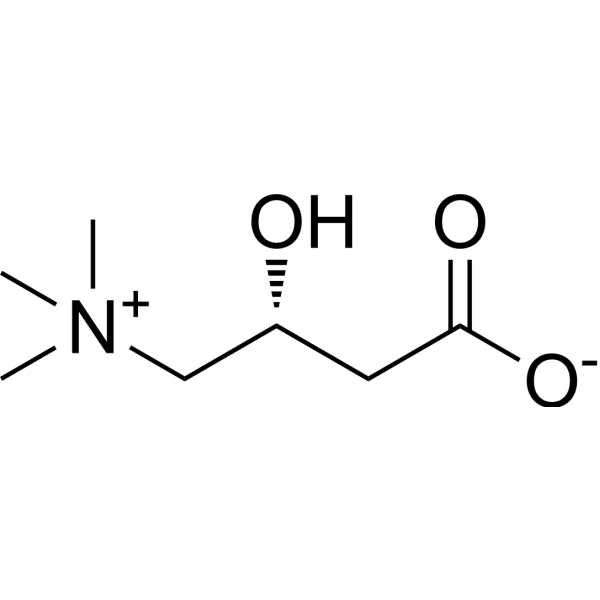
HY-B0399
L-CarnitineCo-factor for β-oxidation
Publications Citing Use of MedChemExpress (MCE) Dimethyl 2-oxoglutarate
More Customer Validation & Images

-
WB
All Endogenous Metabolite Isoforms
More

Biological Activity
Description
IC50 & Target
|
Microbial Metabolite |
In Vitro
Dimethyl 2-oxoglutarate (1 mM; 16 h) significantly increases GLUT1 mRNA expression in diabetic muscle progenitor cells (D-MPs) and decreased glycolytic activity in non-diabetic muscle progenitor cells (ND-MPs)[1].
Dimethyl 2-oxoglutarate replenishes cytoplasmic AcCoA levels in cultured human cells through the action of mitochondrial IDH2 or cytoplasmic IDH1[2].
Dimethyl 2-oxoglutarate (4-16 mM; 12 h) reduces CCl4-induced liver fibrosis through inhibition of autophagy in hepatic stellate cells[3].
Dimethyl 2-oxoglutarate (5 mM; 48 h) prevents cell death and mitochondrial damage induced by DRB18 (HY-145963) in SH-SY5Y cells[4].
MedChemExpress (MCE) has not independently confirmed the accuracy of these methods. They are for reference only. Further protocols information, click here.
In Vivo
Dimethyl 2-oxoglutarate (200 mg/kg; i.p; twice a week; 9 weeks) reduces CCl4-induced liver fibrosis in rats[3].
MedChemExpress (MCE) has not independently confirmed the accuracy of these methods. They are for reference only.
-
Animal Model:Rat liver fibrosis model[3]
-
Dosage:200 mg/kg
-
Administration:Intraperitoneal injection (i.p.); twice a week; 9 weeks
-
Result:Decreased collagen deposition.
Showed a 44% down-regulation of Sirius Red-stained fibrotic areas.
Showed a slight but not significant improvement in liver function.


Chemical Information
-
CAS No. 13192-04-6
-
Appearance Liquid (Density: 1.175±0.06 g/cm3)
-
Molecular Weight 174.15
-
Formula C7H10O5
-
Color Colorless to light yellow
-
SMILES
O=C(OC)C(CCC(OC)=O)=O
-
Synonyms
Dimethyl α-ketoglutarate
-
Initial Source
-
Shipping
Room temperature in continental US; may vary elsewhere.
-
Storage
Pure form -20°C 3 years 4°C 2 years In solvent -80°C 6 months -20°C 1 month


Publications (4)
-
Journal Impact Factor
-
Most Recent
-
Sci Bull
Hepatic IFRD1 suppresses metabolic dysfunction-associated fatty liver disease via GLUD1/α-KG axis. [Abstract]2026 May 15;71(9):2283-2299. PMID: 41997855 -
-
Cell Rep
4-octyl itaconate inhibits cytokine-mediated inflammation via alkylation of TYK2 and JAK1. [Abstract]2026 Mar 30;45(4):117179. PMID: 41915469 -
Commun Biol
SIRT5-mediated desuccinylation of MTHFD2 enhances chemoresistance in breast cancer cells by reducing therapy-induced senescence. [Abstract]2025 Oct 20;8(1):1485. PMID: 41116031
Dimethyl 2-oxoglutarate purchased from MedChemExpress. Usage Cited in: Commun Biol. 2025 Oct 20;8(1):1485. [Abstract]
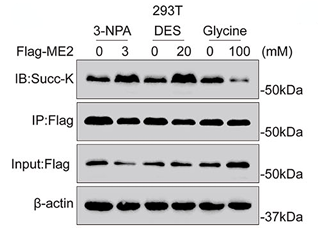
Succinylation levels of ectopically expressed ME2 in HEK293T cells were measured. Cells were treated with 3-NPA (3 mM), DES (20 mM), or glycine (100 mM) for 24 h.


Solvent & Solubility
In Vitro:
DMSO : 100 mg/mL (574.22 mM; Need ultrasonic; Hygroscopic DMSO has a significant impact on the solubility of product, please use newly opened DMSO)
H2O : 100 mg/mL (574.22 mM; Need ultrasonic)
Please refer to the solubility information to select the appropriate solvent. Once prepared, please aliquot and store the solution to prevent product inactivation from repeated freeze-thaw cycles.
Storage method and period of stock solution: -80°C, 6 months; -20°C, 1 month. When stored at -80°C, please use it within 6 months. When stored at -20°C, please use it within 1 month.
* Note: If you choose water as the stock solution, please dilute it to the working solution, then filter and sterilize it with a 0.22 μm filter before use.
Please refer to the solubility information to select the appropriate solvent. Once prepared, please aliquot and store the solution to prevent product inactivation from repeated freeze-thaw cycles.
Storage method and period of stock solution: -80°C, 6 months; -20°C, 1 month. When stored at -80°C, please use it within 6 months. When stored at -20°C, please use it within 1 month.
* Note: If you choose water as the stock solution, please dilute it to the working solution, then filter and sterilize it with a 0.22 μm filter before use.
Concentration (start) × Volume (start) = Concentration (final) × Volume (final)
In Vivo:
Select the appropriate dissolution method based on your experimental animal and administration route.
- For the following dissolution methods, please ensure to first prepare a clear stock solution using an In Vitro approach and then sequentially add co-solvents:
- To ensure reliable experimental results, the clarified stock solution can be appropriately stored based on storage conditions. As for the working solution for In Vivo experiments, it is recommended to prepare freshly and use it on the same day.
- The percentages shown for the solvents indicate their volumetric ratio in the final prepared solution. If precipitation or phase separation occurs during preparation, heat and/or sonication can be used to aid dissolution.
Add each solvent one by one: 10% DMSO 40% PEG300 5% Tween-80 45% Saline
Solubility: ≥ 2.5 mg/mL (14.36 mM); Clear solution
This protocol yields a clear solution of ≥ 2.5 mg/mL (saturation unknown).
Taking 1 mL working solution as an example, add 100 μL DMSO stock solution (25.0 mg/mL) to 400 μL PEG300, and mix evenly; then add 50 μL Tween-80 and mix evenly; then add 450 μL Saline to adjust the volume to 1 mL.
Preparation of Saline: Dissolve 0.9 g sodium chloride in ddH₂O and dilute to 100 mL to obtain a clear Saline solution.
Add each solvent one by one: 10% DMSO 90% (20% SBE-β-CD in Saline)
Solubility: ≥ 2.5 mg/mL (14.36 mM); Clear solution
This protocol yields a clear solution of ≥ 2.5 mg/mL (saturation unknown).
Taking 1 mL working solution as an example, add 100 μL DMSO stock solution (25.0 mg/mL) to 900 μL 20% SBE-β-CD in Saline, and mix evenly.
Preparation of 20% SBE-β-CD in Saline (4°C, storage for one week): 2 g SBE-β-CD powder is dissolved in 10 mL Saline, completely dissolve until clear.
For the following dissolution methods, please prepare the working solution directly:
It is recommended to prepare fresh solutions and use them promptly within a short period of time.
The percentages shown for the solvents indicate their volumetric ratio in the final prepared solution. If precipitation or phase separation occurs during preparation, heat and/or sonication can be used to aid dissolution.
Add each solvent one by one: PBS
Solubility: 100 mg/mL (574.22 mM); Clear solution; Need ultrasonic
Add each solvent one by one: 50% PEG300 50% PBS
Solubility: ≥ 50 mg/mL (287.11 mM); Clear solution
In Vivo Dissolution Calculator
Please enter the basic information of animal experiments:
-
-
-
-
Recommended: Prepare an additional quantity of animals to account for potential losses during experiments.
Working solution concentration: 0.22 mg/mL
This product has good water solubility, please refer to the measured solubility data in water/PBS/Saline for details.

Protocols
-
Fibrosis/Collagen Morphometry
Fibrosis and collagen morphometry is based on the quantitative visualization of fibrillar collagen deposition in tissue sections using histochemical stains such as Sirius Red (Picrosirius Red) or Masson's trichrome, followed by image-based or polarization-enhanced analysis to estimate collagen proportional area as a surrogate of extracellular matrix accumulation during fibrotic remodeling. Sirius Red combined with polarized light microscopy enhances detection of collagen fibers due to birefringence properties, enabling more specific visualization of collagen type I and III fibrils compared to conventional bright-field histology, while whole-section or region-restricted digital morphometry reduces field-selection bias in fibrosis assessment. Alternative quantitative approaches include second harmonic generation (SHG) and two-photon excited fluorescence microscopy, which enable label-free detection of fibrillar collagen and have been validated against histological staining and biochemica
-
Collagen: Sirius Red Staining
Sirius Red or picrosirius red staining is a histochemical method for visualizing collagen-rich extracellular matrix in tissue sections, and collagen fibers are detected as red-stained structures under bright-field microscopy with enhanced birefringence under polarized light. Picrosirius red is useful for assessing total collagen organization, distribution, and fibrosis burden, but polarized color should not be interpreted as a definitive collagen type I versus type III readout because color is affected by fiber orientation, thickness, and packing.
-
ROS/oxidative-stress fluorescent staining
ROS/oxidative-stress fluorescent staining uses cell-permeant fluorogenic probes that become fluorescent after oxidation inside cells or tissues; commonly used examples include DCFH-DA/DCFDA for broad cellular oxidant detection, DHE for superoxide-related signal detection, MitoSOX for mitochondrial superoxide-related signal detection, and CellROX probes for oxidative-stress-associated fluorescence readouts. The assay detects probe oxidation rather than a single ROS species unless the probe and analysis method have been chemically validated for that species. DCFH-DA enters cells, is deacetylated by intracellular esterases to DCFH, and produces fluorescent DCF after oxidation, so the readout is used as an operational measure of total cellular oxidative stress rather than a species-specific ROS measurement. DHE and MitoSOX can report superoxide-related oxidation, but red fluorescence alone can include non-specific ethidium-like oxidation products; HPLC or optimized spectral approaches are
-
Connective Tissue: Masson's Trichrome/Collagen Trichrome Staining
Masson’s Trichrome (collagen/trichrome staining) is a histological technique that differentially stains tissue compartments using sequential acidic dyes to distinguish collagen from muscle and cytoplasmic components based on dye affinity and tissue permeability differences, enabling visualization of fibrosis and connective tissue architecture in histological sections. The classical formulation typically uses Weigert's iron hematoxylin for nuclear staining, Biebrich scarlet-acid fuchsin for cytoplasm and muscle, and aniline blue (or light green variants) for collagen, producing a characteristic blue/green collagen signal contrasted against red cytoplasm and dark nuclei. The staining principle relies on selective displacement of smaller dye molecules by larger anionic dyes in collagen-rich regions under controlled acidified conditions, which enhances collagen-specific dye retention. This property makes the method widely used for fibrosis assessment in organs such as heart, liver, lung, a
-
Autophagy
Autophagy is a process in which eukaryotic cells use lysosomes to degrade their own cytoplasmic proteins and damaged organelles under the regulation of autophagy related gene (Atg). Microtubule-associated proteins light chain 3 (LC3) is recognized as autophagy marker, which transfers from cytoplasmic LC3 (LC3-I) to membrane type (LC3-II). LC3-II/I ratio could be detected by Western Blot and fluorescence microscopy.
-
Lysosome and acidic-vesicle live-cell staining
Lysosome and acidic-vesicle live-cell staining detects acidic intracellular compartments by using membrane-permeant acidotropic probes that accumulate in low-pH vesicles, including lysosomes, late endosomes, autolysosomes, and acidic phagosomes. LysoTracker staining is commonly used as an intensity-based readout of acidic lysosomal compartment abundance or enlargement, while acridine orange produces green fluorescence in less concentrated compartments and red fluorescence after concentration-dependent accumulation in acidic vesicular organelles. Loss or reduction of acridine-orange red signal can be used as a readout of lysosomal membrane permeabilization or reduced acidic-vesicle integrity. This protocol is designed for live cultured cells and can be adapted for fluorescence microscopy, high-content imaging, plate-reader readout, or flow cytometry when the selected literature supports the readout. Because these dyes report acidotropic accumulation rather than lysosome identity alone,
-
Macroautophagy Solutions
Macroautophagy is a conserved lysosome-dependent degradation pathway in which cytoplasmic material is sequestered into double-membrane autophagosomes and delivered to lysosomes for degradation and recycling. The pathway supports cellular homeostasis during nutrient limitation, organelle stress, protein-aggregate accumulation, infection, differentiation, and tissue remodeling by coupling cargo sequestration, autophagosome maturation, lysosomal fusion, and degradation of cargo-derived macromolecules. The core molecular sequence includes initiation by nutrient- and stress-regulated autophagy machinery, autophagosome nucleation, LC3/ATG8-family conjugation to autophagosomal membranes, cargo selection through receptors such as SQSTM1/p62, autophagosome-lysosome fusion, and lysosomal degradation. LC3 was identified as a mammalian homolog of yeast Atg8 that localizes to autophagosomal membranes after processing, and p62/SQSTM1 was shown to connect ubiquitinated cargo with autophagic degradati
-
Research Protocol for Metabolic Diseases
AMP-activated protein kinase, AMPK, is a conserved cellular energy sensor that responds to reduced cellular energy status and coordinates metabolism by increasing ATP-generating catabolic pathways while suppressing ATP-consuming anabolic processes. In metabolic disease research, the AMPK pathway is experimentally relevant because it regulates hepatic lipid synthesis, fatty acid oxidation, glucose production, skeletal-muscle glucose disposal, mTORC1-linked biosynthesis, autophagy, mitochondrial homeostasis, and whole-body energy balance. The central pathway logic is that energy stress, metformin, exercise-like stimulation, or direct AMPK activators increase AMPKα Thr172 phosphorylation and downstream substrate phosphorylation, including ACC and RAPTOR. Phosphorylation of ACC suppresses lipogenesis and supports fatty acid oxidation, whereas phosphorylation of RAPTOR suppresses mTORC1 signaling and links cellular energy status to growth and protein synthesis control. The pathway is linked
-
Liver Histomorphometry
Liver histomorphometry is a quantitative histological approach used to measure structural alterations in hepatic tissue, including parenchymal loss, steatosis, fibrosis, and vascular remodeling, by combining stained tissue section analysis with stereological or computerized image-based measurements. Classical morphometric frameworks quantify volume fractions of liver compartments and fibrotic regions using systematic sampling and image analysis, enabling objective comparison of pathological changes across experimental groups. These approaches are widely applied in liver cirrhosis and fibrosis studies to reduce subjectivity in histological scoring and improve reproducibility of tissue evaluation. Recent methodological advances integrate automated image analysis and radiomics-based extraction of histological features from standard liver stains (e. g. , H&E and fibrotic stains), enabling quantitative correlation between morphometric features and fibrosis stages in non-alcoholic fatty live
-
Alzheimer’s Disease Modeling
Alzheimer’s Disease (AD) is a neurodegenerative disorder characterized by a progressive decline in cognitive functions and loss of specific types of neurons and synapses. Alzheimer's symptoms can be simulated in mice by injecting drugs (such as Aβ) or genetically modified.


Purity & Documentation
-
Data Sheet (276 KB)
-
SDS (396 KB)
- English - EN (396 KB)
- Français - FR (396 KB)
- Deutsch - DE (396 KB)
- Norwegian - NO (396 KB)
- Español - ES (396 KB)
- Swedish - SV (396 KB)
- Italian - IT (396 KB)
- Korean - KR (396 KB)
- Portuguese - PT (396 KB)
-
Handling Instructions (2659 KB)
References
[1]. Faulkner A, et al. Dimethyl-2-oxoglutarate improves redox balance and mitochondrial function in muscle pericytes of individuals with diabetes mellitus. Diabetologia. 2020 Oct;63(10):2205-2217. [Content Brief]
[2]. Mariño G, et al. Dimethyl α-ketoglutarate inhibits maladaptive autophagy in pressure overload-induced cardiomyopathy. Autophagy. 2014 May;10(5):930-2. [Content Brief]
[3]. Zhao J, et al. Dimethyl α-ketoglutarate reduces CCl4-induced liver fibrosis through inhibition of autophagy in hepatic stellate cells. Biochem Biophys Res Commun. 2016 Dec 2;481(1-2):90-96. [Content Brief]
[4]. Chauhan A, et al. Dimethyl-2-oxoglutarate but not antioxidants prevents glucose hypometabolism induced neural cell death: implications in the pathogenesis and therapy of Alzheimer's disease. Biochem Biophys Rep. 2025 Jul 12;43:102150. [Content Brief]


Complete Stock Solution Preparation Table
Please refer to the solubility information to select the appropriate solvent. Once prepared, please aliquot and store the solution to prevent product inactivation from repeated freeze-thaw cycles.
Storage method and period of stock solution: -80°C, 6 months; -20°C, 1 month. When stored at -80°C, please use it within 6 months. When stored at -20°C, please use it within 1 month.
| Optional Solvent | Concentration Solvent Mass | 1 mg | 5 mg | 10 mg | 25 mg |
|---|---|---|---|---|---|
| DMSO / H2O | 1 mM | 5.7422 mL | 28.7109 mL | 57.4218 mL | 143.5544 mL |
| 5 mM | 1.1484 mL | 5.7422 mL | 11.4844 mL | 28.7109 mL | |
| 10 mM | 0.5742 mL | 2.8711 mL | 5.7422 mL | 14.3554 mL | |
| 15 mM | 0.3828 mL | 1.9141 mL | 3.8281 mL | 9.5703 mL | |
| 20 mM | 0.2871 mL | 1.4355 mL | 2.8711 mL | 7.1777 mL | |
| 25 mM | 0.2297 mL | 1.1484 mL | 2.2969 mL | 5.7422 mL | |
| 30 mM | 0.1914 mL | 0.9570 mL | 1.9141 mL | 4.7851 mL | |
| 40 mM | 0.1436 mL | 0.7178 mL | 1.4355 mL | 3.5889 mL | |
| 50 mM | 0.1148 mL | 0.5742 mL | 1.1484 mL | 2.8711 mL | |
| 60 mM | 0.0957 mL | 0.4785 mL | 0.9570 mL | 2.3926 mL | |
| 80 mM | 0.0718 mL | 0.3589 mL | 0.7178 mL | 1.7944 mL | |
| 100 mM | 0.0574 mL | 0.2871 mL | 0.5742 mL | 1.4355 mL |
* Note: If you choose water as the stock solution, please dilute it to the working solution, then filter and sterilize it with a 0.22 μm filter before use.


Dimethyl 2-oxoglutarate Related Classifications
HY-44134 Related Classifications
 Powered by Bioz