



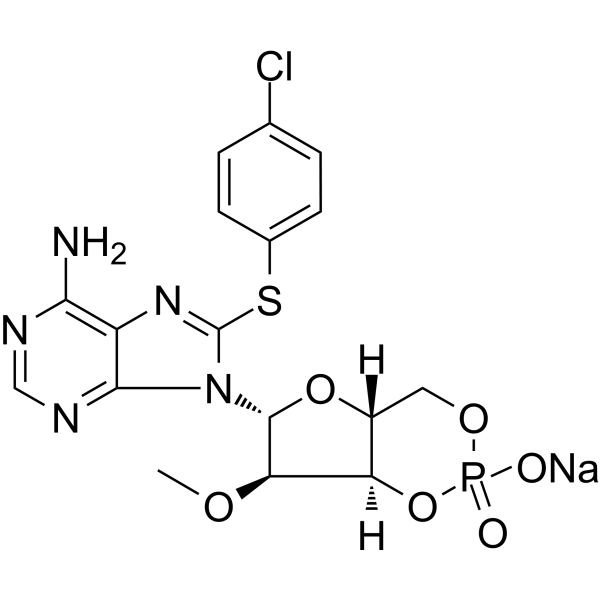
8-pCPT-2′-O-Me-cAMP sodium
Based on 1 publication(s) in Google Scholar
8-pCPT-2′-O-Me-cAMP (8-CPT-2'-O-Me-cAMP) sodium, an analog of cAMP, is an activator of exchange proteins activated by cAMP (Epac). 8-pCPT-2′-O-Me-cAMP sodium activates Epac1 (EC50 = 2.2 μM), but not PKA (EC50 >10 μM). 8-pCPT-2′-O-Me-cAMP sodium stimulates Epac-mediated Ca2+ release in pancreatic β-cells in vitro. 8-pCPT-2′-O-Me-cAMP sodium is a Rap1 activator. 8-pCPT-2′-O-Me-cAMP sodium enhances the retinal pigment epithelium barrier against the pathological choroidal endothelial cell invasion that occurs in macular degeneration.
For research use only. We do not sell to patients.
- Purity : 99.81%
- CAS No.: 634207-53-7
- Formula: C17H16ClN5NaO6PS
- Molecular Weight:507.82
-
Storage:
-20°C, sealed storage, away from moisture
* In solvent : -80°C, 6 months; -20°C, 1 month (sealed storage, away from moisture)

To place orders, for customer services and technical support, please contact: MedChemExpress USA
Tel: 609-228-6898 E-mail: [email protected] [email protected]


-
 Biological Activity
-
Chemical Information
-
Solvent & Solubility
- Protocols
- Purity & Documentation
- References
-
 Help & FAQs


-
HY-12306
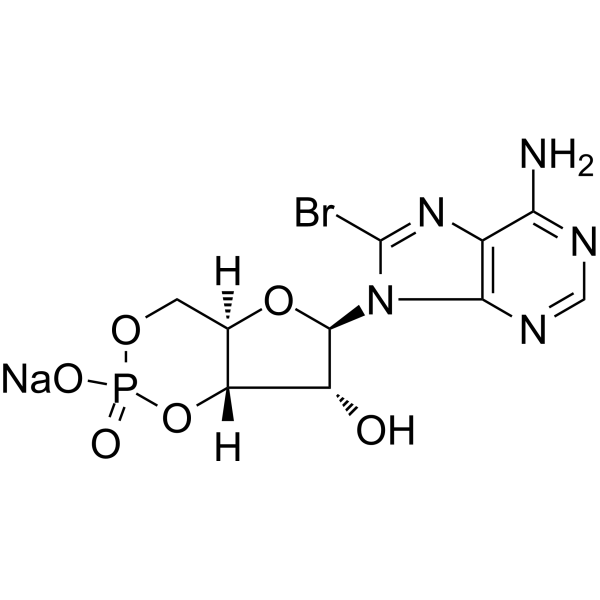
8-Bromo-cAMP sodium saltPKA Activator -
HY-15871
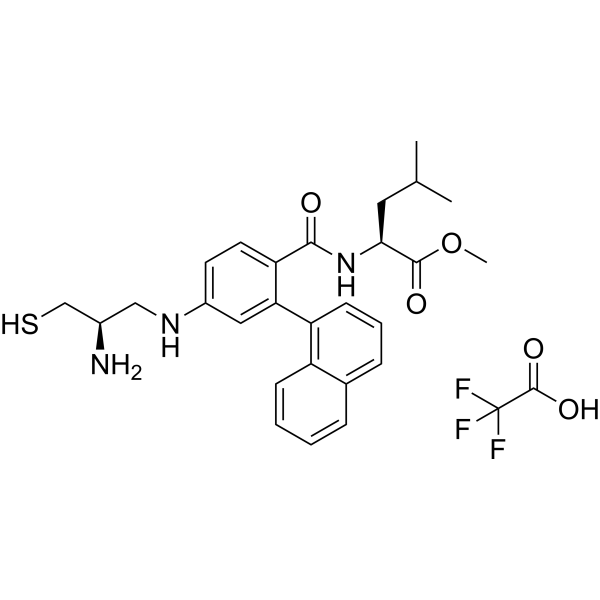
GGTI298 TrifluoroacetateGGTase I Inhibitor -
HY-B0764
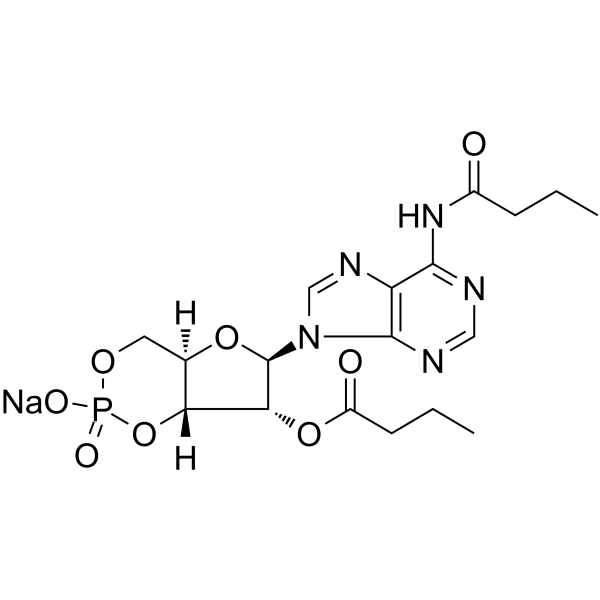
Bucladesine sodiumcAMP Analog -
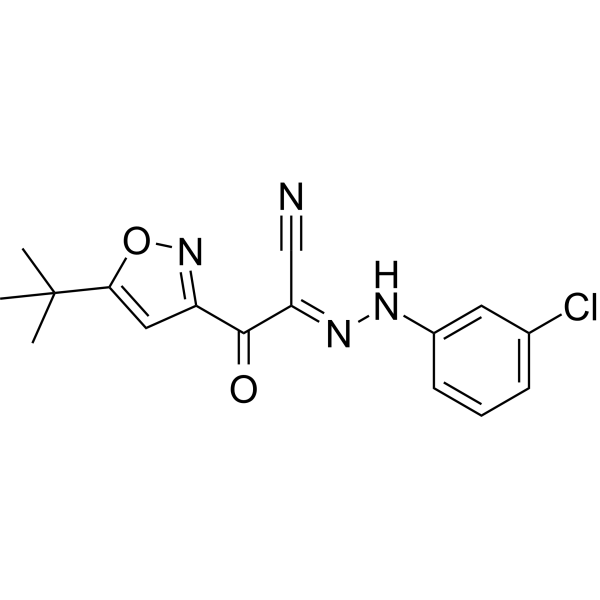
HY-16704
ESI-09Virus Protease Inhibitor -
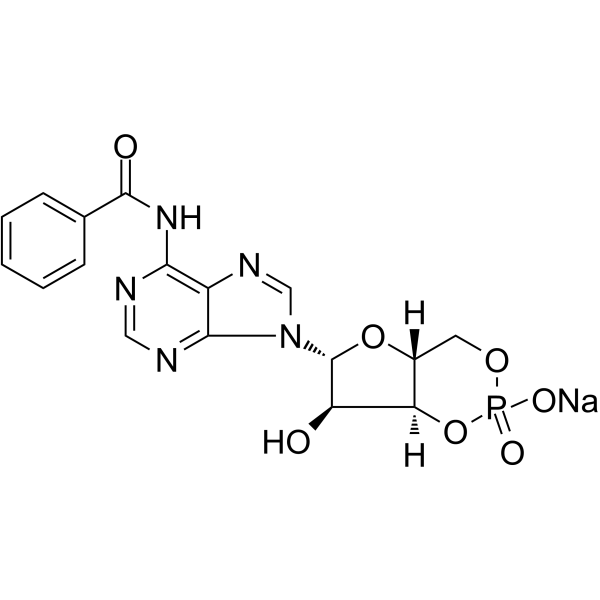
HY-103322
6-Bnz-cAMP sodium saltPKA Activator -
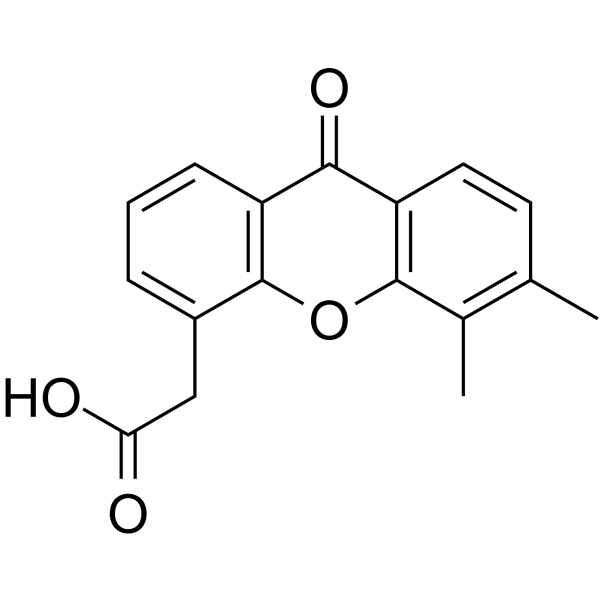
HY-10964
VadimezanVascular Disrupting Agent -
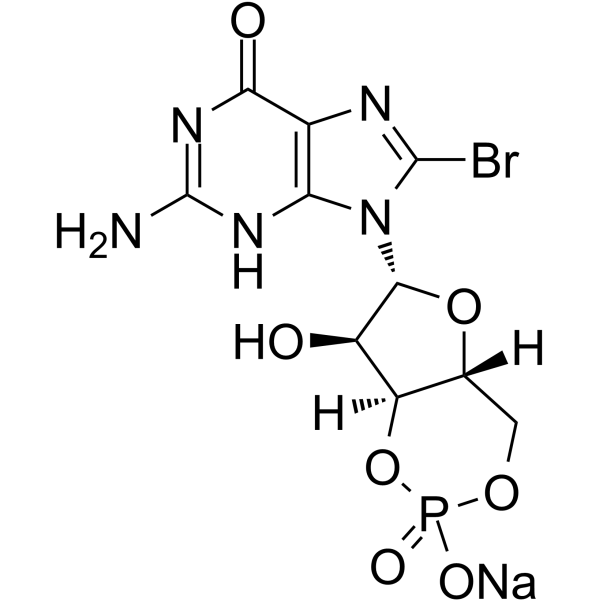
HY-101379A
8-Bromo-cGMP sodiumPKG Activator -
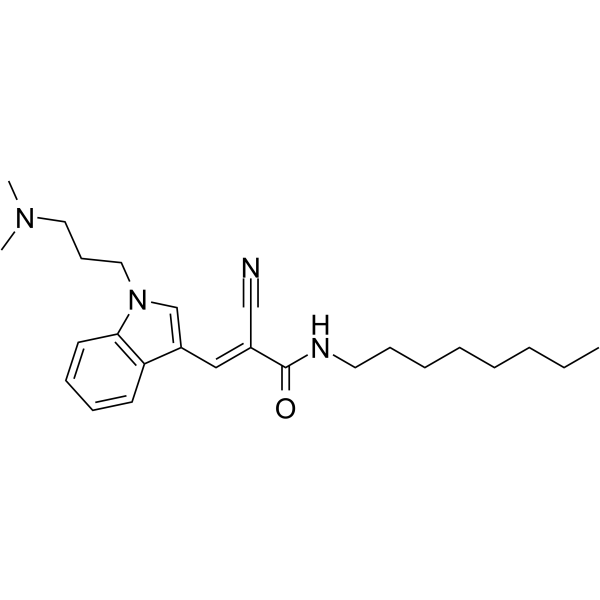
HY-107545
Dynole 34-2Dynamin GTPase Inhibitor -

HY-107543R
8-pCPT-2′-O-Me-cAMP sodium (Standard)Reference Standard -
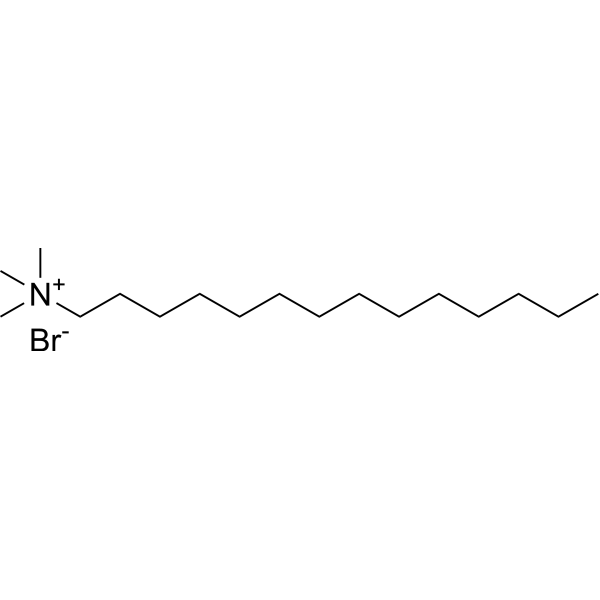
HY-D0839
Tetradecyltrimethylammonium bromideCationic Surfactant -
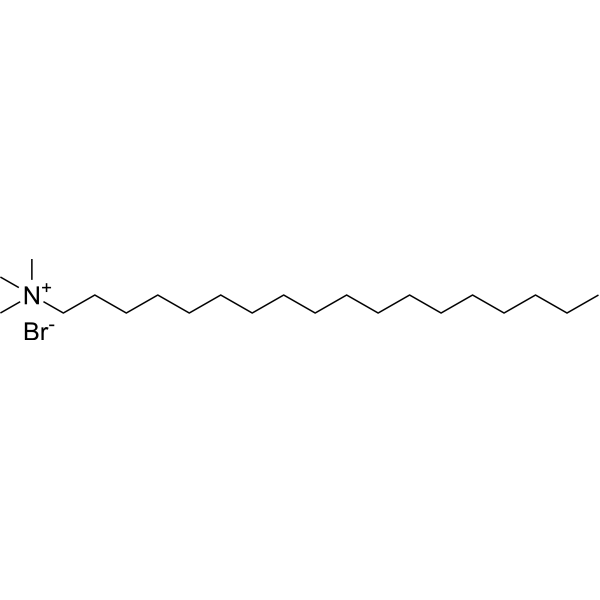
HY-W013158
Trimethyloctadecylammonium bromideDynamin Inhibitor -
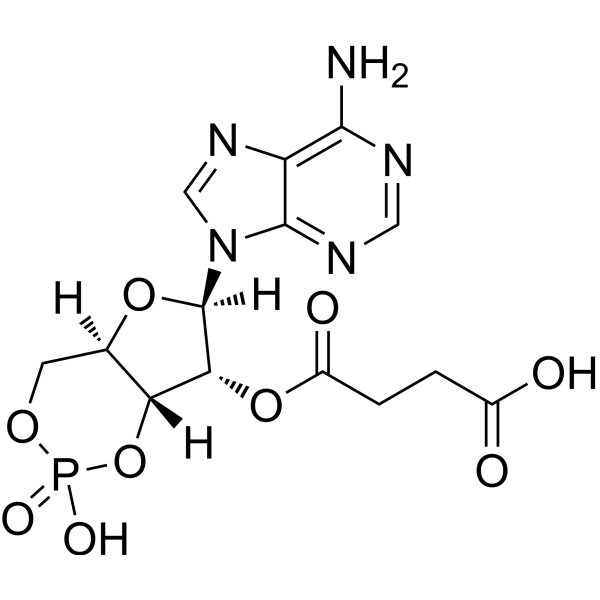
HY-131768
2'-O-Succinyl-cAMPcAMP Analog
Publications Citing Use of MedChemExpress (MCE) 8-pCPT-2′-O-Me-cAMP sodium
More

Biological Activity
Description
In Vitro
8-CPT-2'-O-Me-cAMP (250 µM; 1 h) sodium induces Rap1 activation and enhances recruitment of junctional proteins and cortical F-actin in retinal pigment epithelium cells[1].
MedChemExpress (MCE) has not independently confirmed the accuracy of these methods. They are for reference only. Further protocols information, click here.
In Vivo
MedChemExpress (MCE) has not independently confirmed the accuracy of these methods. They are for reference only.
-
Animal Model:Wild type (WT) C57/Bl6 mice (choroidal neovascularization (CNV) model)[1].
-
Dosage:2.05 µM; 1 µL
-
Administration:Intravitreal injection
-
Result:Induced a slight increase in F-actin localization to the cell periphery, and reorganized cell junctions to a more linear shape, dose-dependent decreased in CNV volume, increased Rap1 activity in isolated RPE/choroids.


Chemical Information
-
CAS No. 634207-53-7
-
Appearance Solid
-
Molecular Weight 507.82
-
Formula C17H16ClN5NaO6PS
-
Color White to off-white
-
SMILES
NC1=C2C(N([C@H]3[C@@H]([C@@](O4)([H])[C@](COP4(O[Na])=O)([H])O3)OC)C(SC5=CC=C(Cl)C=C5)=N2)=NC=N1
-
Synonyms
8-CPT-2'-O-Me-cAMP sodium
-
Shipping
Room temperature in continental US; may vary elsewhere.
-
Storage
-20°C, sealed storage, away from moisture
* In solvent : -80°C, 6 months; -20°C, 1 month (sealed storage, away from moisture)


Publications (1)
-
Journal Impact Factor
-
Most Recent
-
Cell Signal
D-Ala2-GIP (1-30) promotes angiogenesis by facilitating endothelial cell migration via the Epac/Rap1/Cdc42 signaling pathway. [Abstract]2025 Mar:127:111615. PMID: 39855534


Solvent & Solubility
In Vitro:
DMSO : 125 mg/mL (246.15 mM; ultrasonic and warming and heat to 60°C; Hygroscopic DMSO has a significant impact on the solubility of product, please use newly opened DMSO)
Please refer to the solubility information to select the appropriate solvent. Once prepared, please aliquot and store the solution to prevent product inactivation from repeated freeze-thaw cycles.
Storage method and period of stock solution: -80°C, 6 months; -20°C, 1 month (sealed storage, away from moisture). When stored at -80°C, please use it within 6 months. When stored at -20°C, please use it within 1 month.
Please refer to the solubility information to select the appropriate solvent. Once prepared, please aliquot and store the solution to prevent product inactivation from repeated freeze-thaw cycles.
Storage method and period of stock solution: -80°C, 6 months; -20°C, 1 month (sealed storage, away from moisture). When stored at -80°C, please use it within 6 months. When stored at -20°C, please use it within 1 month.
Concentration (start) × Volume (start) = Concentration (final) × Volume (final)
In Vivo:
Select the appropriate dissolution method based on your experimental animal and administration route.
- For the following dissolution methods, please ensure to first prepare a clear stock solution using an In Vitro approach and then sequentially add co-solvents:
- To ensure reliable experimental results, the clarified stock solution can be appropriately stored based on storage conditions. As for the working solution for In Vivo experiments, it is recommended to prepare freshly and use it on the same day.
- The percentages shown for the solvents indicate their volumetric ratio in the final prepared solution. If precipitation or phase separation occurs during preparation, heat and/or sonication can be used to aid dissolution.
Add each solvent one by one: 10% DMSO 40% PEG300 5% Tween-80 45% Saline
Solubility: ≥ 2.08 mg/mL (4.10 mM); Clear solution
This protocol yields a clear solution of ≥ 2.08 mg/mL (saturation unknown).
Taking 1 mL working solution as an example, add 100 μL DMSO stock solution (20.8 mg/mL) to 400 μL PEG300, and mix evenly; then add 50 μL Tween-80 and mix evenly; then add 450 μL Saline to adjust the volume to 1 mL.
Preparation of Saline: Dissolve 0.9 g sodium chloride in ddH₂O and dilute to 100 mL to obtain a clear Saline solution.
Add each solvent one by one: 10% DMSO 90% (20% SBE-β-CD in Saline)
Solubility: ≥ 2.08 mg/mL (4.10 mM); Clear solution
This protocol yields a clear solution of ≥ 2.08 mg/mL (saturation unknown).
Taking 1 mL working solution as an example, add 100 μL DMSO stock solution (20.8 mg/mL) to 900 μL 20% SBE-β-CD in Saline, and mix evenly.
Preparation of 20% SBE-β-CD in Saline (4°C, storage for one week): 2 g SBE-β-CD powder is dissolved in 10 mL Saline, completely dissolve until clear.
In Vivo Dissolution Calculator
Please enter the basic information of animal experiments:
-
-
-
-
Recommended: Prepare an additional quantity of animals to account for potential losses during experiments.
Please enter your animal formula composition:
-
%DMSO +
Recommended: Keep the proportion of DMSO in working solution below 2% if your animal is weak.
-
%+
-
+%Tween-80 + +
-
%Saline +
The co-solvents required include: DMSO, . All of co-solvents are available by MedChemExpress (MCE). , Tween 80. All of co-solvents are available by MedChemExpress (MCE).
Working solution concentration: 0.22 mg/mL
Method for preparing stock solution: mg drug dissolved in μL DMSO. Stock solution concentration: mg/mL. * In solvent : -80°C, 6 months; -20°C, 1 month (sealed storage, away from moisture)
1. Take μL DMSO stock solution;
2. Add μL .
μL , mix evenly;
3. Then add μL Tween 80, mix evenly;
4. Then add μL
Please ensure that the stock solution in the first step is dissolved to a clear state, and add co-solvents in sequence. You can use ultrasonic heating (ultrasonic cleaner, recommended frequency 20-40 kHz), vortexing, etc. to assist dissolution.

Protocols
-
Spheroid/Tumor Organoid Invasion Assay
The spheroid/tumor organoid invasion assay measures outward movement of cancer cells from a compact 3D aggregate into an extracellular matrix, usually collagen I, basement membrane matrix, or mixed collagen-Matrigel hydrogels; the readout is generated by bright-field, fluorescence, confocal, or time-lapse imaging of cell egress, invasion area, invasion distance, dispersion, protrusion formation, basement-membrane perforation, or cell trajectories. The assay reflects cell-cell cohesion, cell-matrix adhesion, matrix remodeling, protease-dependent invasion, contractility, and invasion behavior in a 3D microenvironment rather than migration on a flat 2D surface.
-
Invadopodia/Fluorescent Gelatin Degradation Assay
Invadopodia/fluorescent gelatin degradation assay detects proteolytic extracellular matrix degradation by cancer-cell invadopodia, which are actin-rich protrusive structures associated with matrix remodeling, invasion, and metastasis. The readout is generated by culturing cells on fluorescent gelatin and measuring dark degraded areas where fluorescent substrate has been locally removed, often together with immunofluorescent detection of invadopodia markers such as F-actin, cortactin, and TKS5.
-
Ex Vivo Tissue Slice/Explant Invasion Assay
Ex vivo organotypic tissue slice cultures are based on maintaining thin, viable tissue sections at an air-liquid interface to preserve native cytoarchitecture and local cell-matrix interactions, enabling observation of cell behavior such as migration and tissue infiltration within a physiologically relevant 3D microenvironment. The method relies on maintaining tissue viability on porous membrane supports, allowing diffusion of nutrients and oxygen while preserving structural integrity for extended culture periods, which makes it suitable for studying dynamic cellular processes in intact tissue contexts such as cell movement and tissue remodeling. .
-
Patient-Derived Organoid Invasion Assay
Patient-derived organoid (PDO) invasion assays are based on the ability of epithelial tumor organoids to self-organize in three-dimensional extracellular matrix (ECM) hydrogels (commonly Matrigel) and to recapitulate key aspects of in vivo tissue architecture, including polarity, proliferation, and invasive outgrowth when exposed to permissive microenvironmental cues. In this system, invasion is operationally defined as the emergence of multicellular protrusions, collective budding, or single-cell dissemination from the organoid core into the surrounding ECM, reflecting epithelial-mesenchymal plasticity and matrix remodeling capacity. Organoid morphology and invasive behavior are typically monitored using brightfield or confocal microscopy over time, enabling quantitative assessment of invasion area, protrusion number, and structural disruption of the organoid spheroid architecture.
-
Human Islet Cell Culture
The method of preserving islets in vitro, with purified reduced immunogenicity. The steps are islet isolation, islet cell purification, in vitro determination of islet function and islet cell culture.
-
Organotypic 3D Invasion Assay
The organotypic 3D invasion assay measures carcinoma-cell invasion into a fibroblast-remodeled extracellular matrix, usually collagen I with or without basement-membrane matrix, under an air-liquid or grid-supported culture condition; the readout is invasion depth, invaded area, or an invasion index from histological or fluorescence images. This assay models stromal regulation of invasion because fibroblasts or CAFs remodel matrix, generate tracks, and can lead collective carcinoma-cell invasion; the resulting cancer-cell penetration into the gel reflects tumor-stroma-ECM interactions rather than migration on a rigid 2D substrate.
-
Cell invasion
Cell invasion is the ability of cells to migrate from one area to another via the extracellular matrix. Cell invasion is the response of normal and cancer cells to chemical and mechanical stimuli. Before migrating to a new region, the extracellular matrix is degraded by proteases within the cell. Cell invasion often occurs during wound repair, vascularization and inflammation, abnormal tissue invasion, and tumor cell metastasis.
-
Matrigel/ECM Transwell Invasion Assay
The Matrigel/ECM Transwell invasion assay measures the ability of cells to move toward a chemoattractant while crossing an extracellular-matrix barrier placed on a porous membrane; therefore, the readout reflects both chemotactic motility and matrix invasion rather than migration alone. Matrigel is a basement-membrane-rich matrix derived from Engelbreth-Holm-Swarm mouse sarcoma and has been used as a reconstituted basement membrane barrier in chemoinvasion assays. The assay readout is generated by quantifying cells that reach the underside of the insert membrane or lower compartment after incubation, commonly by staining and counting invaded cells or by fluorescence-based quantification.
-
Ca2+ Staining Technique
Ca2+ staining is an experimental technique that utilizes specific fluorescent probes (such as Fluo-4 AM, Fura-2, etc.) to qualitatively or quantitatively detect dynamic changes in intracellular Ca2+ concentrations; this is achieved by monitoring the changes in fluorescent signals generated when these probes bind to free intracellular calcium ions. The underlying principle relies primarily on the presence of chelating groups within the probe's molecular structure that possess high affinity for calcium ions.
-
3D Tumor Spheroid Invasion Assay
3D tumor spheroid invasion assay measures outward tumor-cell movement from a compact multicellular spheroid into a surrounding extracellular matrix, producing image-based readouts such as invasion area, invasion distance, cell dispersion, or time-resolved cell movement. The method models tumor-cell interaction with matrix components in three dimensions and is used to study invasive phenotypes in cancer models including glioblastoma, squamous cell carcinoma, breast cancer, prostate cancer, ovarian cancer, and other solid tumor systems.
-
3D Collagen/Hydrogel Matrix Invasion Assay
The 3D collagen/hydrogel matrix invasion assay is based on embedding cells within or on top of a three-dimensional fibrillar extracellular matrix (typically type I collagen or collagen-rich hydrogels) to model cell migration through a physiologically relevant physical barrier. In this system, invasive behavior is quantified by measuring the ability of cells to degrade, remodel, and migrate through the 3D matrix architecture, which better reflects in vivo tissue invasion compared to 2D migration assays. Collagen-based 3D matrices provide structural cues such as fiber alignment and porosity that influence cell motility and integrin-mediated adhesion, enabling observation of collective or single-cell invasion modes depending on matrix density and organization.
-
Matrigel Transwell/Boyden Chamber Invasion Assay
Matrigel Transwell/Boyden chamber invasion assay measures the ability of cells to degrade or traverse an extracellular matrix-coated porous membrane and move from an upper chamber toward a chemoattractant in a lower chamber. Invasion is distinguished from migration by coating the membrane with Matrigel or basement membrane matrix; uncoated inserts measure migration, while coated inserts require cells to cross an ECM barrier before reaching the underside of the membrane.


Purity & Documentation
-
Data Sheet (280 KB)
-
SDS (252 KB)
- English - EN (252 KB)
- Français - FR (252 KB)
- Deutsch - DE (252 KB)
- Norwegian - NO (252 KB)
- Español - ES (252 KB)
- Swedish - SV (252 KB)
- Italian - IT (252 KB)
- Korean - KR (252 KB)
- Portuguese - PT (252 KB)
-
Handling Instructions (2659 KB)
References
[1]. Wittchen ES, et al. Rap1 GTPase activation and barrier enhancement in rpe inhibits choroidal neovascularization in vivo. PLoS One. 2013 Sep 10;8(9):e73070. [Content Brief]
[2]. Enserink JM, Christensen AE, de Rooij J, van Triest M, Schwede F, Genieser HG, Døskeland SO, Blank JL, Bos JL. A novel Epac-specific cAMP analogue demonstrates independent regulation of Rap1 and ERK. Nat Cell Biol. 2002 Nov;4(11):901-6. [Content Brief]
[3]. Kang G, Joseph JW, Chepurny OG, Monaco M, Wheeler MB, Bos JL, Schwede F, Genieser HG, Holz GG. Epac-selective cAMP analog 8-pCPT-2'-O-Me-cAMP as a stimulus for Ca2+-induced Ca2+ release and exocytosis in pancreatic beta-cells. J Biol Chem. 2003 Mar 7;278. [Content Brief]


Complete Stock Solution Preparation Table
Please refer to the solubility information to select the appropriate solvent. Once prepared, please aliquot and store the solution to prevent product inactivation from repeated freeze-thaw cycles.
Storage method and period of stock solution: -80°C, 6 months; -20°C, 1 month (sealed storage, away from moisture). When stored at -80°C, please use it within 6 months. When stored at -20°C, please use it within 1 month.
| Optional Solvent | Concentration Solvent Mass | 1 mg | 5 mg | 10 mg | 25 mg |
|---|---|---|---|---|---|
| DMSO | 1 mM | 1.9692 mL | 9.8460 mL | 19.6920 mL | 49.2300 mL |
| 5 mM | 0.3938 mL | 1.9692 mL | 3.9384 mL | 9.8460 mL | |
| 10 mM | 0.1969 mL | 0.9846 mL | 1.9692 mL | 4.9230 mL | |
| 15 mM | 0.1313 mL | 0.6564 mL | 1.3128 mL | 3.2820 mL | |
| 20 mM | 0.0985 mL | 0.4923 mL | 0.9846 mL | 2.4615 mL | |
| 25 mM | 0.0788 mL | 0.3938 mL | 0.7877 mL | 1.9692 mL | |
| 30 mM | 0.0656 mL | 0.3282 mL | 0.6564 mL | 1.6410 mL | |
| 40 mM | 0.0492 mL | 0.2462 mL | 0.4923 mL | 1.2308 mL | |
| 50 mM | 0.0394 mL | 0.1969 mL | 0.3938 mL | 0.9846 mL | |
| 60 mM | 0.0328 mL | 0.1641 mL | 0.3282 mL | 0.8205 mL | |
| 80 mM | 0.0246 mL | 0.1231 mL | 0.2462 mL | 0.6154 mL | |
| 100 mM | 0.0197 mL | 0.0985 mL | 0.1969 mL | 0.4923 mL |


8-pCPT-2′-O-Me-cAMP sodium Related Classifications
HY-107543 Related Classifications
 Powered by Bioz