



AC-73
Based on 6 publication(s) in Google Scholar
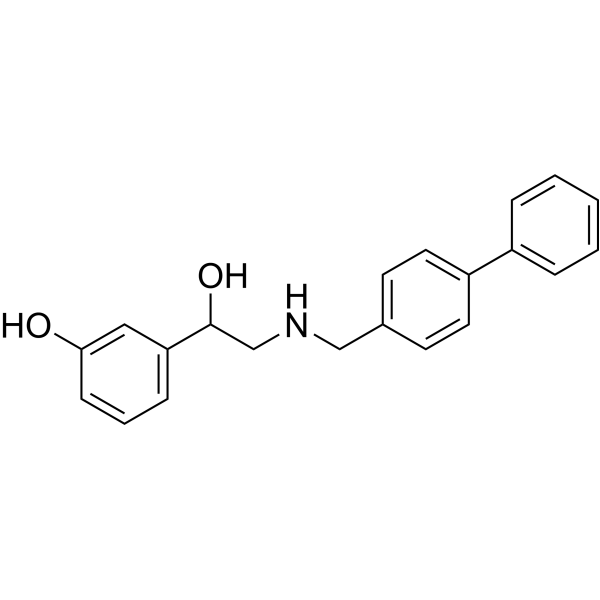
AC-73 is a first specific, orally active inhibitor of cluster of differentiation 147 (CD147), which specifically disrupts CD147 dimerization, thereby mainly suppressing the CD147/ERK1/2/STAT3/MMP-2 pathways. AC-73 inhibits the motility and invasion of hepatocellular carcinoma cells. AC-73 is also an anti-proliferative agent and an inducer of autophagy in leukemic cells.
For research use only. We do not sell to patients.
- Purity : 99.91%
- CAS No.: 775294-71-8
- Formula: C21H21NO2
- Molecular Weight:319.40
-
Storage:Powder -20°C, 3 years , 4°C, 2 years ; In solvent -80°C, 2 years , -20°C, 1 year

To place orders, for customer services and technical support, please contact: MedChemExpress USA
Tel: 609-228-6898 E-mail: [email protected] [email protected]


-
 Biological Activity
-
Chemical Information
-
Solvent & Solubility
- Protocols
- Purity & Documentation
- References
-
 Help & FAQs


-
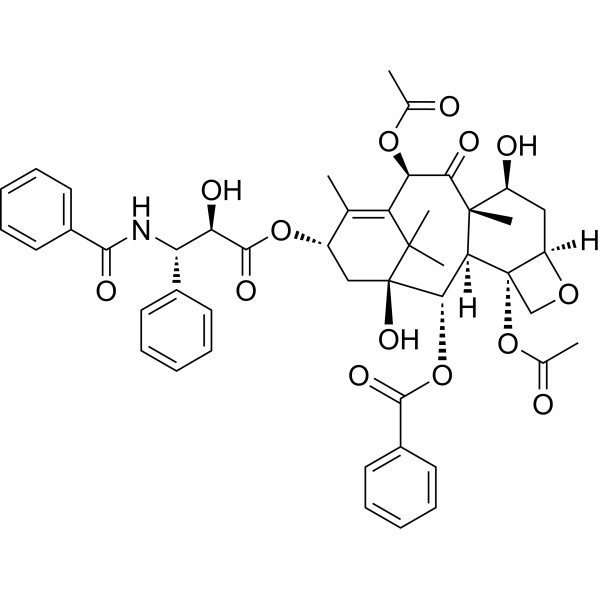
HY-B0015
PaclitaxelAntitumor Agent -
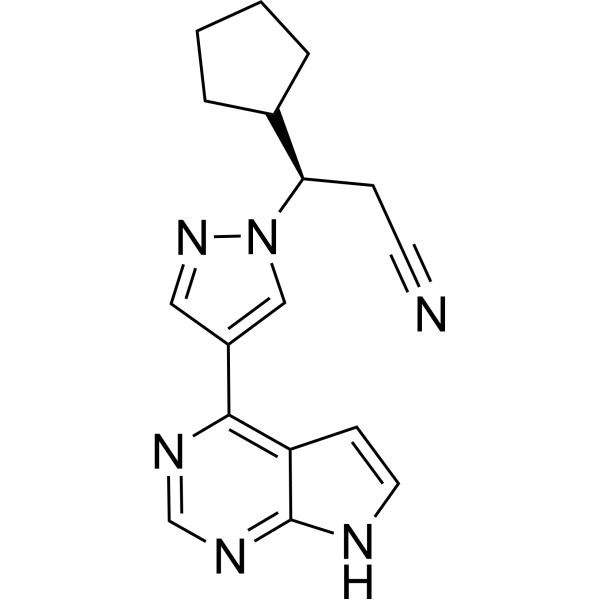
HY-50856
RuxolitinibJAK1/2 Inhibitor -
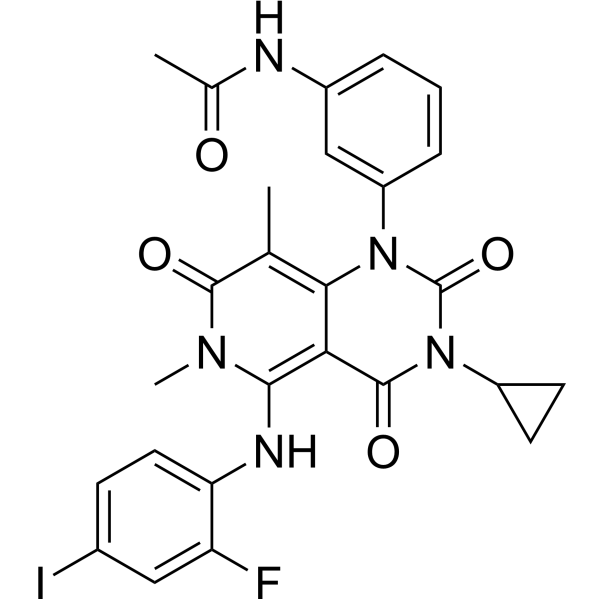
HY-10999
TrametinibMEK Inhibitor -
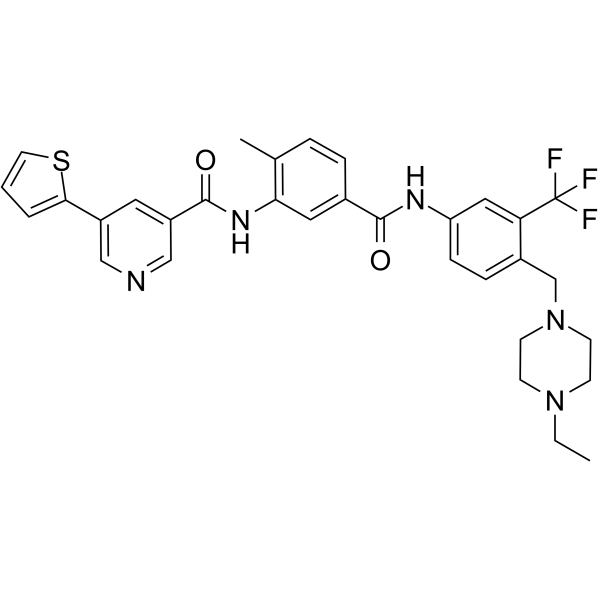
HY-18007
ALW-II-41-27Eph2 Inhibitor -
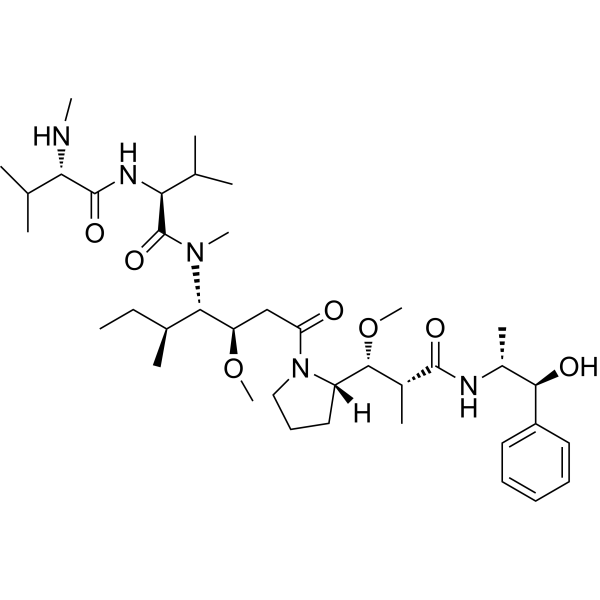
HY-15162
Monomethyl auristatin EAntimitotic Agent -

HY-P9926
DupilumabIL-4Rα Inhibitor -
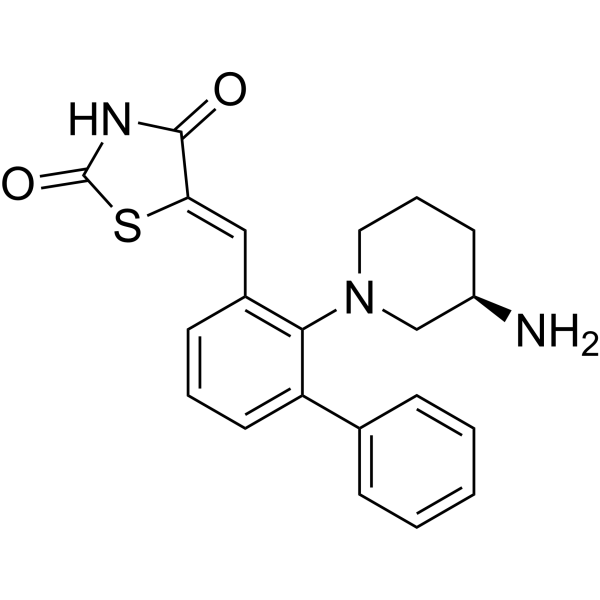
HY-15604
AZD1208PIM Inhibitor -
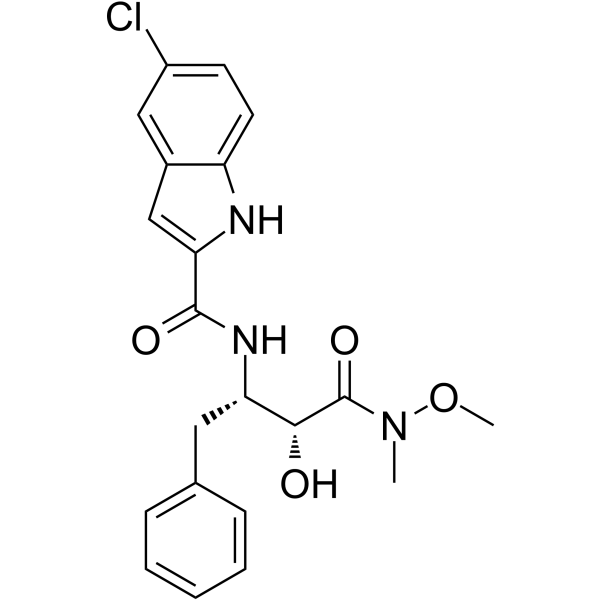
HY-108615
CP-316819Glycogen Phosphorylase Inhibitor
Publications Citing Use of MedChemExpress (MCE) AC-73
More

Biological Activity
Description
IC50 & Target
CD147[1]
In Vitro
AC-73 (5-10 μM; 24 hours; SMMC-7721 and Huh-7 cells) treatment significantly decreases the migration ability of SMMC-7721 and Huh-7 cells in a dose-dependent manner and decreases the invasion of two HCC cells in a dose-dependent manner at 24 hours. AC-73 treatment reduces HCC metastases. There are no obvious effects on cell viability when two HCC cells are treated with AC-73 at a maximum concentration of 20 μM. The possible binding sites of AC-73 on CD147 included Glu64 and Glu73 in the N-terminal IgC2 domain, which two residues are located in the dimer interface of CD147[1].
AC-73 (5-10 μM; 24 hours; SMMC-7721 cells) treatment could significantly inhibit both MMP-2 and MMP-9 mRNA expression at the concentration of 10 μM, especially MMP-2, but no obvious effect on MMP-1, MMP-3, MMP-7, MMP-11 nor MMP-13. AC-73 could dose dependently reduce the expression of MMP-2 mRNA level and secretion of the protein level using RT-qPCR analysis and gelatin zymography experiments[1].
AC-73 (5-20 μM; 6 hours; SMMC-7721 cells) treatment dose-dependently suppresses the phosphorylation of ERK1/2 and STAT3[1].
MedChemExpress (MCE) has not independently confirmed the accuracy of these methods. They are for reference only.
-
Cell Line:SMMC-7721 cells
-
Concentration:5 μM or 10 μM
-
Incubation Time:24 hours
-
Result:Significantly inhibited both MMP-2 and MMP-9 mRNA expression at the concentration of 10 μM. Dose dependently reduced the expression of MMP-2 mRNA level and secretion of the protein level using RT-qPCR analysis and gelatin zymography experiments.
-
Cell Line:SMMC-7721 cells
-
Concentration:5 μM, 10 μM or 20 μM
-
Incubation Time:6 hours
-
Result:The phosphorylation of ERK1/2 and STAT3 was dose-dependently suppressed.
In Vivo
MedChemExpress (MCE) has not independently confirmed the accuracy of these methods. They are for reference only.
-
Animal Model:Male BALB/c nu/nu mice (4-6 weeks) with SMMC-7721 cells[1]
-
Dosage:25 mg/kg, 50 mg/kg
-
Administration:Injected; daily; for 3 weeks
-
Result:Significantly decreased the incidence of metastatic foci in nude mice. Inhibited the phosphorylation of ERK1/2 and STAT3 in a dose-dependent manner. MMP-2 was also reduced.


Chemical Information
-
CAS No. 775294-71-8
-
Appearance Solid
-
Molecular Weight 319.40
-
Formula C21H21NO2
-
Color White to off-white
-
SMILES
OC(CNCC1=CC=C(C2=CC=CC=C2)C=C1)C3=CC=CC(O)=C3
-
Shipping
Room temperature in continental US; may vary elsewhere.
-
Storage
Powder -20°C 3 years 4°C 2 years In solvent -80°C 2 years -20°C 1 year


Publications (6)
-
Journal Impact Factor
-
Most Recent
-
Cancer Lett
EMMPRIN in extracellular vesicles from peritoneal mesothelial cells stimulates the invasion activity of diffuse-type gastric cancer cells. [Abstract]2021 Aug 30:521:169-177. PMID: 34474145 -
Cell Commun Signal
Targeting cancer-derived extracellular vesicles by combining CD147 inhibition with tissue factor pathway inhibitor for the management of urothelial cancer cells. [Abstract]2024 Feb 15;22(1):129. PMID: 38360687 -
J Crohns Colitis
CD147 Targeting by AC-73 Induces Autophagy and Reduces Intestinal Fibrosis Associated with TNBS Chronic Colitis. [Abstract]2022 Nov 23;16(11):1751-1761. PMID: 35833587 -
Arch Pharm Res
Cell membrane chromatography relative competitive method for the accurate determination of relative KD values of drug-receptor interactions. [Abstract]2025 Jan;48(1):102-114. PMID: 39658753 -
Burns
CD147 inhibition reduced fibronectin expression in TGF-β1-induced keloid fibroblasts by targeting Smad2 signaling pathway. [Abstract]2025 Jun;51(5):107472. PMID: 40319830 -


Solvent & Solubility
In Vitro:
DMSO : ≥ 250 mg/mL (782.72 mM; Hygroscopic DMSO has a significant impact on the solubility of product, please use newly opened DMSO)
* "≥" means soluble, but saturation unknown.
Please refer to the solubility information to select the appropriate solvent. Once prepared, please aliquot and store the solution to prevent product inactivation from repeated freeze-thaw cycles.
Storage method and period of stock solution: -80°C, 2 years; -20°C, 1 year. When stored at -80°C, please use it within 2 years. When stored at -20°C, please use it within 1 year.
Please refer to the solubility information to select the appropriate solvent. Once prepared, please aliquot and store the solution to prevent product inactivation from repeated freeze-thaw cycles.
Storage method and period of stock solution: -80°C, 2 years; -20°C, 1 year. When stored at -80°C, please use it within 2 years. When stored at -20°C, please use it within 1 year.
Concentration (start) × Volume (start) = Concentration (final) × Volume (final)
In Vivo:
Select the appropriate dissolution method based on your experimental animal and administration route.
- For the following dissolution methods, please ensure to first prepare a clear stock solution using an In Vitro approach and then sequentially add co-solvents:
- To ensure reliable experimental results, the clarified stock solution can be appropriately stored based on storage conditions. As for the working solution for In Vivo experiments, it is recommended to prepare freshly and use it on the same day.
- The percentages shown for the solvents indicate their volumetric ratio in the final prepared solution. If precipitation or phase separation occurs during preparation, heat and/or sonication can be used to aid dissolution.
Add each solvent one by one: 10% DMSO 40% PEG300 5% Tween-80 45% Saline
Solubility: ≥ 2.08 mg/mL (6.51 mM); Clear solution
This protocol yields a clear solution of ≥ 2.08 mg/mL (saturation unknown).
Taking 1 mL working solution as an example, add 100 μL DMSO stock solution (20.8 mg/mL) to 400 μL PEG300, and mix evenly; then add 50 μL Tween-80 and mix evenly; then add 450 μL Saline to adjust the volume to 1 mL.
Preparation of Saline: Dissolve 0.9 g sodium chloride in ddH₂O and dilute to 100 mL to obtain a clear Saline solution.
Add each solvent one by one: 10% DMSO 90% (20% SBE-β-CD in Saline)
Solubility: ≥ 2.08 mg/mL (6.51 mM); Clear solution
This protocol yields a clear solution of ≥ 2.08 mg/mL (saturation unknown).
Taking 1 mL working solution as an example, add 100 μL DMSO stock solution (20.8 mg/mL) to 900 μL 20% SBE-β-CD in Saline, and mix evenly.
Preparation of 20% SBE-β-CD in Saline (4°C, storage for one week): 2 g SBE-β-CD powder is dissolved in 10 mL Saline, completely dissolve until clear.
In Vivo Dissolution Calculator
Please enter the basic information of animal experiments:
-
-
-
-
Recommended: Prepare an additional quantity of animals to account for potential losses during experiments.
Please enter your animal formula composition:
-
%DMSO +
Recommended: Keep the proportion of DMSO in working solution below 2% if your animal is weak.
-
%+
-
+%Tween-80 + +
-
%Saline +
The co-solvents required include: DMSO, . All of co-solvents are available by MedChemExpress (MCE). , Tween 80. All of co-solvents are available by MedChemExpress (MCE).
Working solution concentration: 0.22 mg/mL
Method for preparing stock solution: mg drug dissolved in μL DMSO. Stock solution concentration: mg/mL.
1. Take μL DMSO stock solution;
2. Add μL .
μL , mix evenly;
3. Then add μL Tween 80, mix evenly;
4. Then add μL
Please ensure that the stock solution in the first step is dissolved to a clear state, and add co-solvents in sequence. You can use ultrasonic heating (ultrasonic cleaner, recommended frequency 20-40 kHz), vortexing, etc. to assist dissolution.


Purity & Documentation
-
Data Sheet (276 KB)
-
SDS (251 KB)
- English - EN (251 KB)
- Français - FR (251 KB)
- Deutsch - DE (251 KB)
- Norwegian - NO (251 KB)
- Español - ES (251 KB)
- Swedish - SV (251 KB)
- Italian - IT (251 KB)
- Korean - KR (251 KB)
- Portuguese - PT (251 KB)
-
Handling Instructions (2659 KB)
References
[1]. Fu ZG, et al. A novel small-molecule compound targeting CD147 inhibits the motility and invasion of hepatocellular carcinoma cells. Oncotarget. 2016 Feb 23;7(8):9429-47. [Content Brief]
[2]. Spinello I, et al. The small-molecule compound AC-73 targeting CD147 inhibits leukemic cell proliferation, induces autophagy and increases the chemotherapeutic sensitivity of acute myeloid leukemia cells. Haematologica. 2019 May;104(5):973-985. [Content Brief]


Complete Stock Solution Preparation Table
Please refer to the solubility information to select the appropriate solvent. Once prepared, please aliquot and store the solution to prevent product inactivation from repeated freeze-thaw cycles.
Storage method and period of stock solution: -80°C, 2 years; -20°C, 1 year. When stored at -80°C, please use it within 2 years. When stored at -20°C, please use it within 1 year.
| Optional Solvent | Concentration Solvent Mass | 1 mg | 5 mg | 10 mg | 25 mg |
|---|---|---|---|---|---|
| DMSO | 1 mM | 3.1309 mL | 15.6544 mL | 31.3087 mL | 78.2718 mL |
| 5 mM | 0.6262 mL | 3.1309 mL | 6.2617 mL | 15.6544 mL | |
| 10 mM | 0.3131 mL | 1.5654 mL | 3.1309 mL | 7.8272 mL | |
| 15 mM | 0.2087 mL | 1.0436 mL | 2.0872 mL | 5.2181 mL | |
| 20 mM | 0.1565 mL | 0.7827 mL | 1.5654 mL | 3.9136 mL | |
| 25 mM | 0.1252 mL | 0.6262 mL | 1.2523 mL | 3.1309 mL | |
| 30 mM | 0.1044 mL | 0.5218 mL | 1.0436 mL | 2.6091 mL | |
| 40 mM | 0.0783 mL | 0.3914 mL | 0.7827 mL | 1.9568 mL | |
| 50 mM | 0.0626 mL | 0.3131 mL | 0.6262 mL | 1.5654 mL | |
| 60 mM | 0.0522 mL | 0.2609 mL | 0.5218 mL | 1.3045 mL | |
| 80 mM | 0.0391 mL | 0.1957 mL | 0.3914 mL | 0.9784 mL | |
| 100 mM | 0.0313 mL | 0.1565 mL | 0.3131 mL | 0.7827 mL |


AC-73 Related Classifications
HY-122214 Related Classifications
 Powered by Bioz