



Evogliptin
Based on 2 publication(s) in Google Scholar
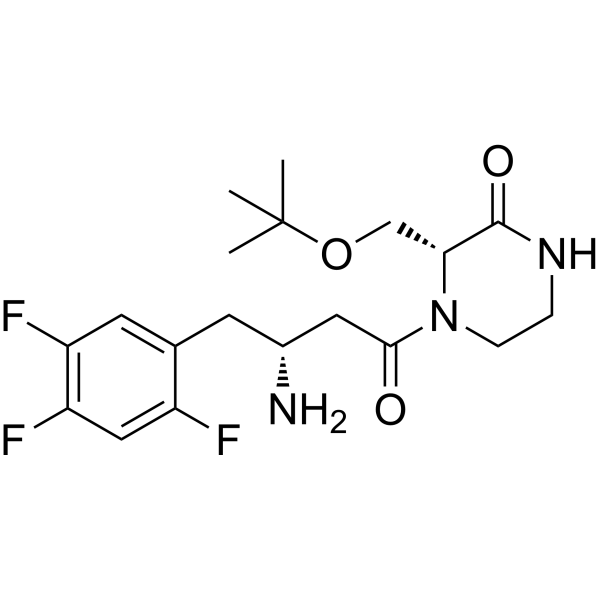
Evogliptin (DA-1229) is an orally active DPP4 inhibitor with significant and sustained hypoglycaemic effects in mouse models. Evogliptin also inhibits the production of inflammatory and fibrotic signals in hepatocytes by inducing autophagy. Evogliptin can be used in studies of type 2 diabetes, osteoporosis, renal impairment and chronic liver inflammation.
For research use only. We do not sell to patients.
- CAS No.: 1222102-29-5
- Formula: C19H26F3N3O3
- Molecular Weight:401.42
-
Storage:
Please store the product under the recommended conditions in the Certificate of Analysis.

To place orders, for customer services and technical support, please contact: MedChemExpress USA
Tel: 609-228-6898 E-mail: [email protected] [email protected]


-
 Biological Activity
-
Chemical Information
- Protocols
- Purity & Documentation
- References
-
 Help & FAQs


-
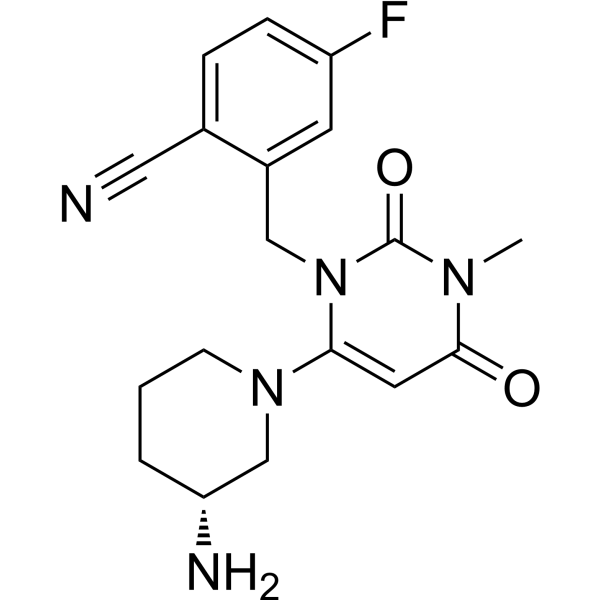
HY-15408
TrelagliptinDPP-4 Inhibitor -
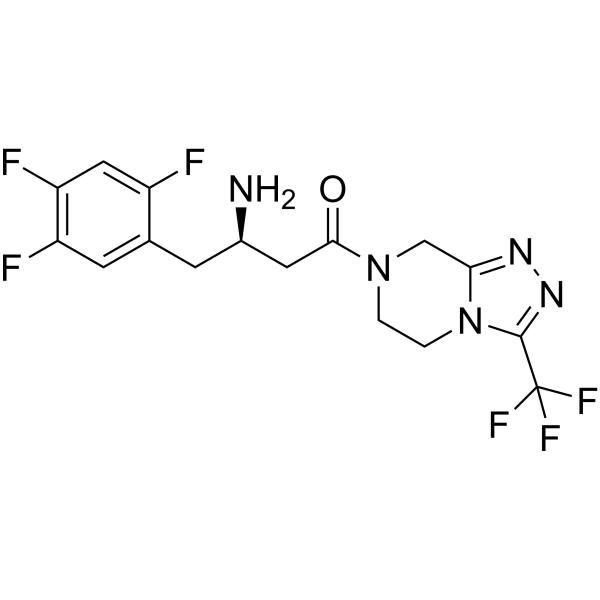
HY-13749
SitagliptinDPP4 Inhibitor -
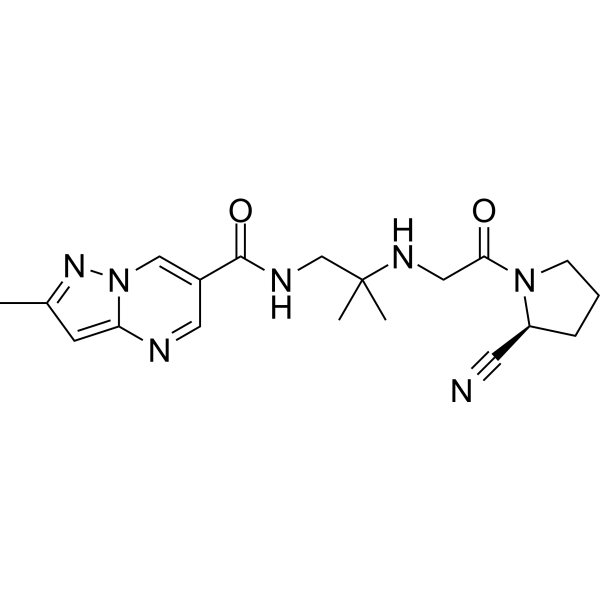
HY-14877
AnagliptinDPP-4 Inhibitor -
HY-13233A
Talabostat mesylateDipeptidyl Peptidase Inhibitor -
HY-10285
SaxagliptinDPP-4 Inhibitor -
HY-14291
VildagliptinDPP-IV Inhibitor -
HY-15981
OmarigliptinDPP-4 Inhibitor -
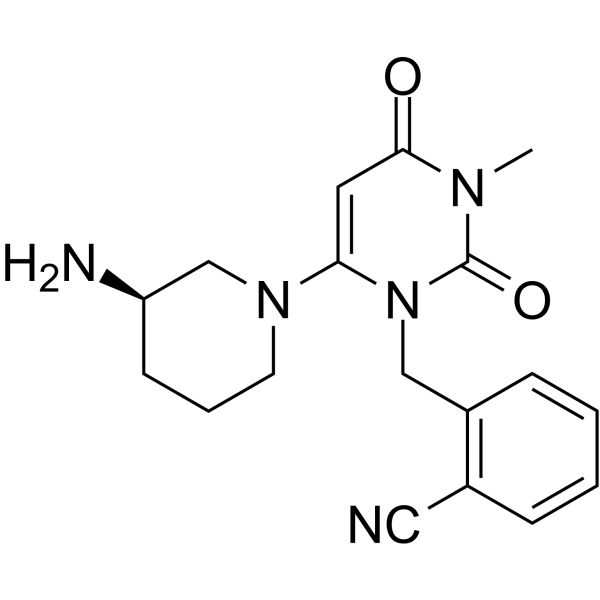
HY-A0023A
AlogliptinDPP-4 Inhibitor -
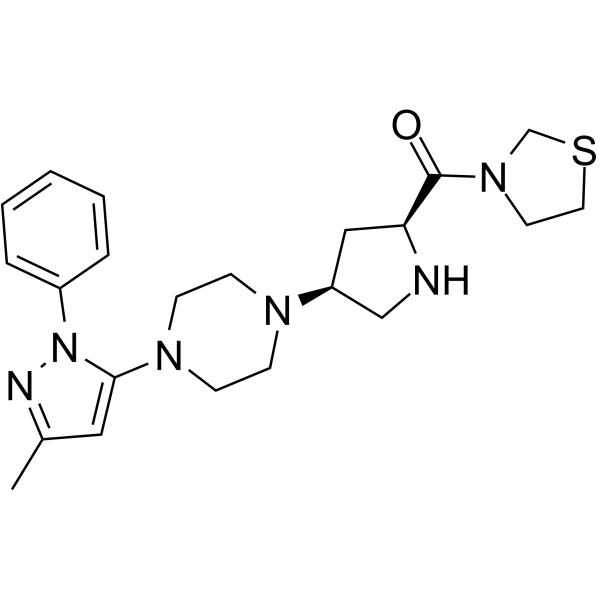
HY-14806
TeneligliptinDPP-4 Inhibitor -
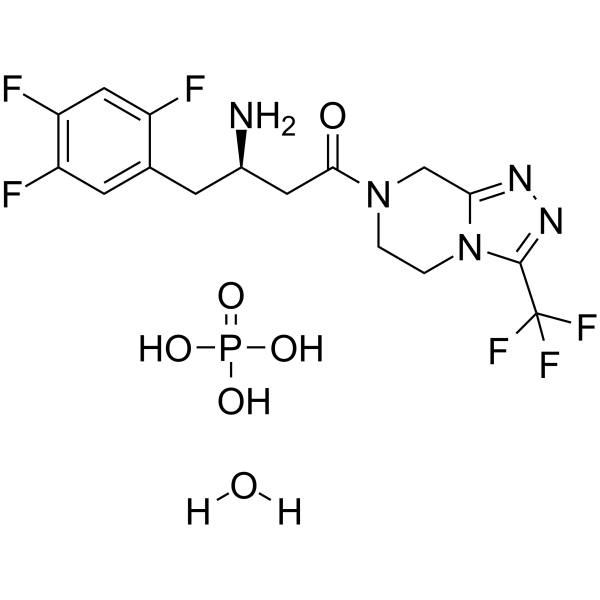
HY-13749B
Sitagliptin phosphate monohydrateDPP4 Inhibitor -
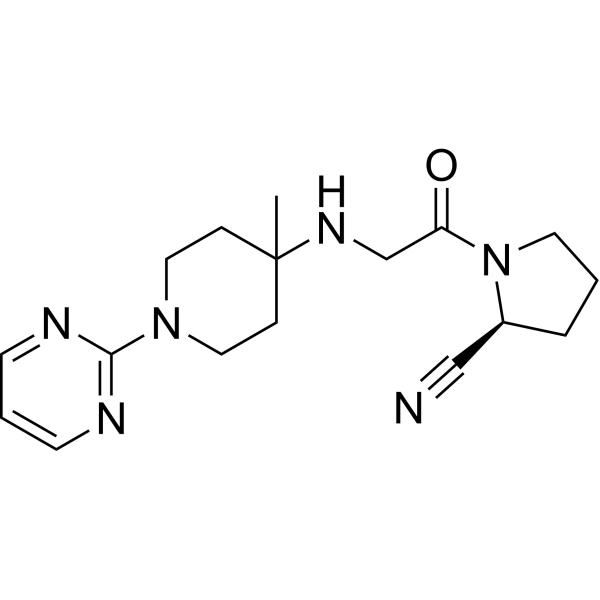
HY-103433
K579DPPIV Inhibitor -

HY-15408R
Trelagliptin (Standard)DPP-4 Inhibitor
Publications Citing Use of MedChemExpress (MCE) Evogliptin
More

Biological Activity
Description
IC50 & Target
In Vitro
Evogliptin (2.49 mM; 12 h) efficiently inhibits mDPP4 (membrane DPP4) enzymatic activity in PWM-induced H9 Th1 cells[1].
Evogliptin prevents inflammatory and fibrotic signaling through autophagy induction in primary hepatocytes of ATG7f/f-Cre+ mice[2].
MedChemExpress (MCE) has not independently confirmed the accuracy of these methods. They are for reference only. Further protocols information, click here.
-
Cell Line:H9 Th1 cells (pokeweed mitogen (PWM)-induced)
-
Concentration:2.49 mM (1 µg/mL)
-
Incubation Time:12 h
-
Result:Potently inhibited mDPP4 (membrane DPP4) activity in a dose-dependent manner but did not affect either the cytokine profile or cell viability in PWM-activated CD4+CD26+ H9 Th1 cells.
In Vivo
MedChemExpress (MCE) has not independently confirmed the accuracy of these methods. They are for reference only.
-
Animal Model:Male ICR mice (four-week-old; HFD/STZ mice model)[3].
-
Dosage:100, 300 mg/kg
-
Administration:In animal feedings; single daily for 10 weeks
-
Result:Decreased the blood glucose level from the second weekand persisted through the 10-week treatment, when at 300 mg/kg.
Significantly reduced HbA1c level when dosage at 300 mg/kg.
Significantly decreased 6 h-fasted blood glucose levels in a dose-dependent manner.
Clinical Trial
| NCT Number | Sponsor | Condition | Start Date |
Phase

|
|---|---|---|---|---|
| NCT01329991 | Plexxikon| | 2011-05 | PHASE1 |


Chemical Information
-
CAS No. 1222102-29-5
-
Molecular Weight 401.42
-
Formula C19H26F3N3O3
-
SMILES
O=C1NCCN(C(C[C@H](N)CC2=CC(F)=C(F)C=C2F)=O)[C@@H]1COC(C)(C)C
-
Synonyms
DA-1229
-
Shipping
Room temperature in continental US; may vary elsewhere.
-
Storage
Please store the product under the recommended conditions in the Certificate of Analysis.


Publications (2)
-
Journal Impact Factor
-
Most Recent
-
Cell Rep
Aortic valve stenosis serum IGFBP2 mediates female-specific Evogliptin resistance in valve myofibroblasts. [Abstract]2026 Jul 13;45(7):117678. PMID: 42441401 -
bioRxiv
Circulating biomarkers in serum from aortic valve stenosis patients predict sex-specific drug responses in valve myofibroblasts. [Abstract]2026 Jan 20:2026.01.16.700010. PMID: 41648356

Protocols
-
Autophagy
Autophagy is a process in which eukaryotic cells use lysosomes to degrade their own cytoplasmic proteins and damaged organelles under the regulation of autophagy related gene (Atg). Microtubule-associated proteins light chain 3 (LC3) is recognized as autophagy marker, which transfers from cytoplasmic LC3 (LC3-I) to membrane type (LC3-II). LC3-II/I ratio could be detected by Western Blot and fluorescence microscopy.
-
Lysosome and acidic-vesicle live-cell staining
Lysosome and acidic-vesicle live-cell staining detects acidic intracellular compartments by using membrane-permeant acidotropic probes that accumulate in low-pH vesicles, including lysosomes, late endosomes, autolysosomes, and acidic phagosomes. LysoTracker staining is commonly used as an intensity-based readout of acidic lysosomal compartment abundance or enlargement, while acridine orange produces green fluorescence in less concentrated compartments and red fluorescence after concentration-dependent accumulation in acidic vesicular organelles. Loss or reduction of acridine-orange red signal can be used as a readout of lysosomal membrane permeabilization or reduced acidic-vesicle integrity. This protocol is designed for live cultured cells and can be adapted for fluorescence microscopy, high-content imaging, plate-reader readout, or flow cytometry when the selected literature supports the readout. Because these dyes report acidotropic accumulation rather than lysosome identity alone,
-
Research Protocol for Inflammation-related Diseases
The NLRP3 inflammasome is a cytosolic innate immune signaling platform that integrates priming signals and danger-signal activation to promote caspase-1 activation, maturation of IL-1β and IL-18, and gasdermin D-mediated pyroptotic cell death. The core experimental logic is to determine whether inflammatory disease phenotypes are driven by increased NLRP3 expression, ASC-containing inflammasome assembly, caspase-1 cleavage, GSDMD cleavage, and extracellular release of IL-1β/IL-18 rather than by nonspecific cell injury alone. The pathway is strongly linked to inflammation-related disease phenotypes because monosodium urate crystals activate NALP3/NLRP3 inflammasome signaling in gout-like crystal inflammation, cholesterol crystals activate NLRP3 inflammasomes in atherogenesis models, and DSS-induced intestinal inflammation has been reported to involve NLRP3 inflammasome activity. However, experimental colitis studies also show context-dependent protective effects of NLRP3 inflammasome co
-
Macroautophagy Solutions
Macroautophagy is a conserved lysosome-dependent degradation pathway in which cytoplasmic material is sequestered into double-membrane autophagosomes and delivered to lysosomes for degradation and recycling. The pathway supports cellular homeostasis during nutrient limitation, organelle stress, protein-aggregate accumulation, infection, differentiation, and tissue remodeling by coupling cargo sequestration, autophagosome maturation, lysosomal fusion, and degradation of cargo-derived macromolecules. The core molecular sequence includes initiation by nutrient- and stress-regulated autophagy machinery, autophagosome nucleation, LC3/ATG8-family conjugation to autophagosomal membranes, cargo selection through receptors such as SQSTM1/p62, autophagosome-lysosome fusion, and lysosomal degradation. LC3 was identified as a mammalian homolog of yeast Atg8 that localizes to autophagosomal membranes after processing, and p62/SQSTM1 was shown to connect ubiquitinated cargo with autophagic degradati
-
Research Protocol for Metabolic Diseases
AMP-activated protein kinase, AMPK, is a conserved cellular energy sensor that responds to reduced cellular energy status and coordinates metabolism by increasing ATP-generating catabolic pathways while suppressing ATP-consuming anabolic processes. In metabolic disease research, the AMPK pathway is experimentally relevant because it regulates hepatic lipid synthesis, fatty acid oxidation, glucose production, skeletal-muscle glucose disposal, mTORC1-linked biosynthesis, autophagy, mitochondrial homeostasis, and whole-body energy balance. The central pathway logic is that energy stress, metformin, exercise-like stimulation, or direct AMPK activators increase AMPKα Thr172 phosphorylation and downstream substrate phosphorylation, including ACC and RAPTOR. Phosphorylation of ACC suppresses lipogenesis and supports fatty acid oxidation, whereas phosphorylation of RAPTOR suppresses mTORC1 signaling and links cellular energy status to growth and protein synthesis control. The pathway is linked


Purity & Documentation
References
[1]. Yoon H, et al. Effects of the Antidiabetic Drugs Evogliptin and Sitagliptin on the Immune Function of CD26/DPP4 in Th1 Cells. Biomol Ther (Seoul). 2021 Mar 1;29(2):154-165. [Content Brief]
[3]. Kim TH, et al. Hepatic role in an early glucose-lowering effect by a novel dipeptidyl peptidase 4 inhibitor, evogliptin, in a rodent model of type 2 diabetes. Eur J Pharmacol. 2016 Jan 15;771:65-76. [Content Brief]
[4]. Tan X, et al. Evogliptin: a new dipeptidyl peptidase inhibitor for the treatment of type 2 diabetes. Expert Opin Pharmacother. 2016 Jun;17(9):1285-93. [Content Brief]

Calculators
Concentration (start) × Volume (start) = Concentration (final) × Volume (final)


Evogliptin Related Classifications
HY-117985 Related Classifications
 Powered by Bioz