



MG-262
Based on 1 publication(s) in Google Scholar
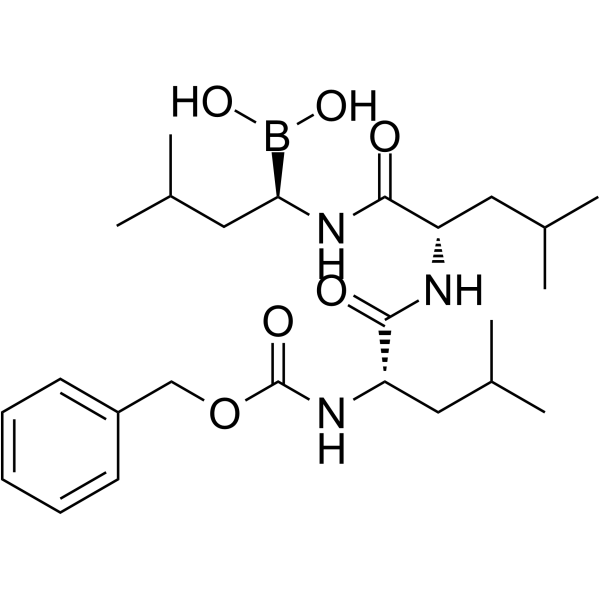
MG-262 (Z-Leu-Leu-LeuB(OH)2; ZL3B) is a reversible proteasome inhibitor. MG-262 down-regulates VEGF receptor Flt-1. MG-262 inhibits cell growth and induces apoptosis in malignant cells. MG-262 induces reactive oxygen species (ROS). MG-262 can be used for anti-cancer study.
For research use only. We do not sell to patients.
- Purity : 95.0%
- CAS No.: 179324-22-2
- Formula: C25H42BN3O6
- Molecular Weight:491.43
-
Storage:Powder -20°C, 3 years ; In solvent -80°C, 6 months , -20°C, 1 month

To place orders, for customer services and technical support, please contact: MedChemExpress USA
Tel: 609-228-6898 E-mail: [email protected] [email protected]


-
 Biological Activity
-
Chemical Information
-
Solvent & Solubility
- Protocols
- Purity & Documentation
- References
-
 Help & FAQs


-
HY-10455
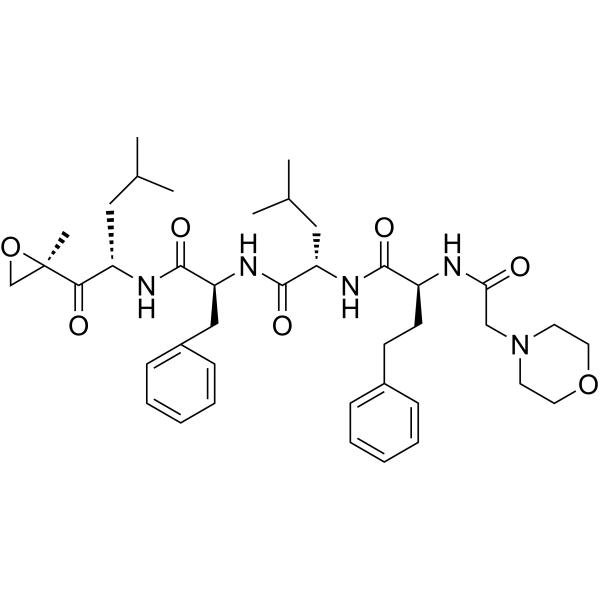
CarfilzomibProteasome Inhibitor -
HY-10227
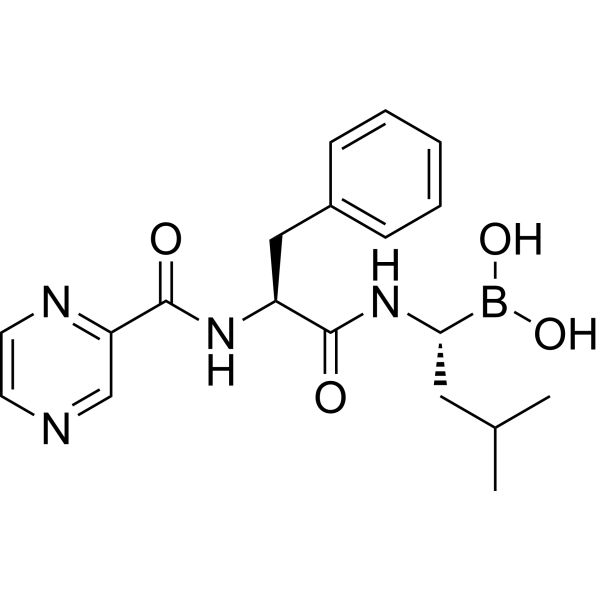
BortezomibProteasome Inhibitor -
HY-10453
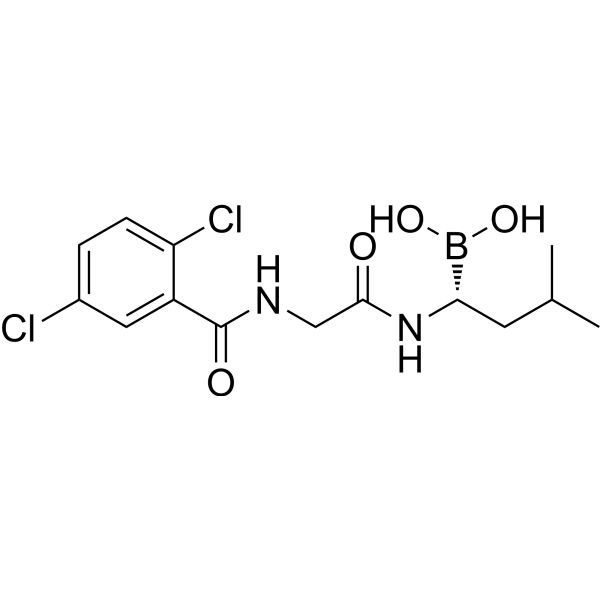
IxazomibProteasome Inhibitor -
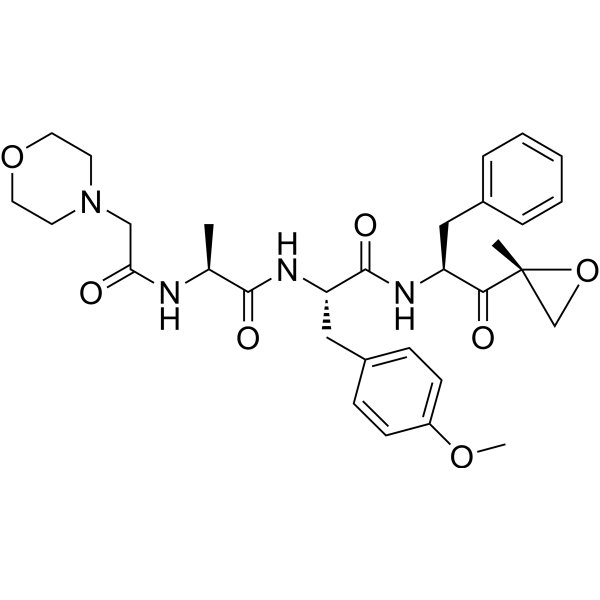
HY-13207
ONX-0914Proteasome Inhibitor -
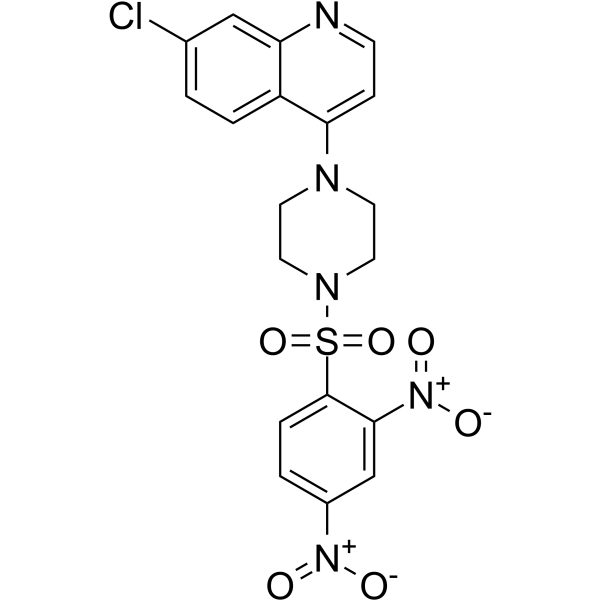
HY-18741
VR23Trypsin-like/Chymotrypsin-like/Caspase-like proteasomes Inhibitor -
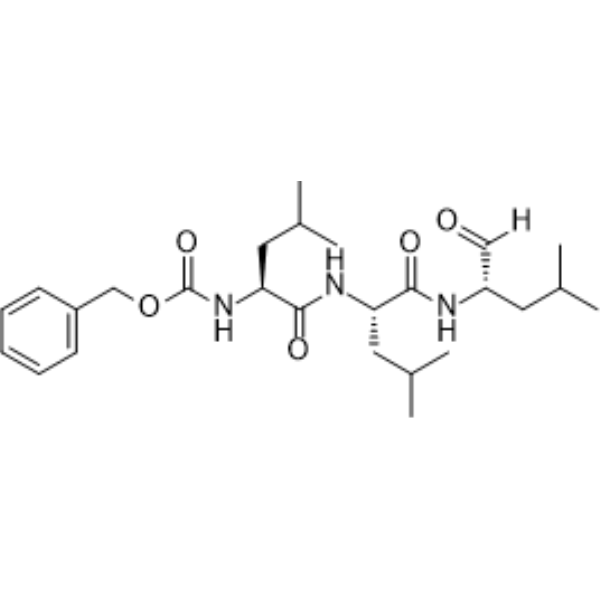
HY-13259
MG-132Proteasome Inhibitor -
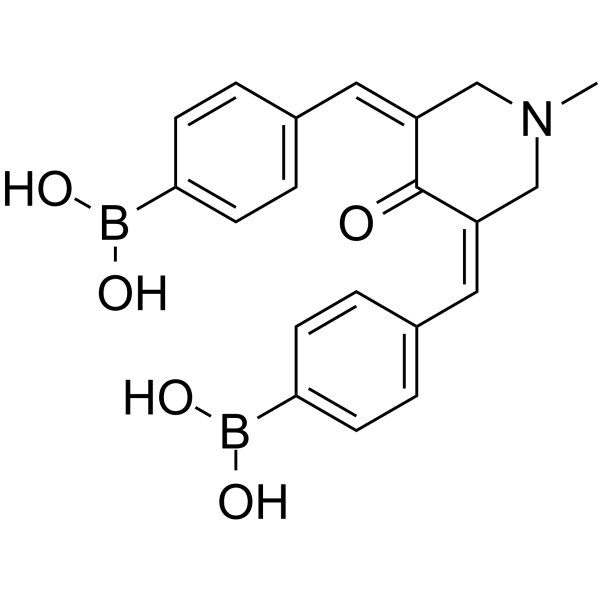
HY-107412
Proteasome inhibitor IX20S Proteasome Inhibitor -
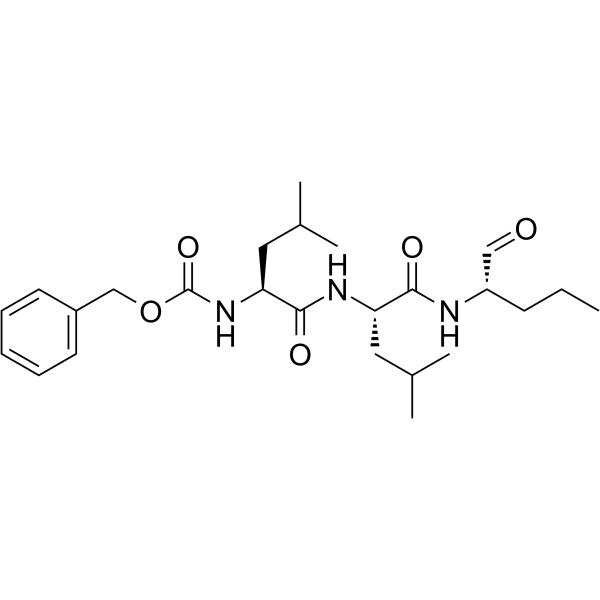
HY-108552
MG-115Proteasome Inhibitor -
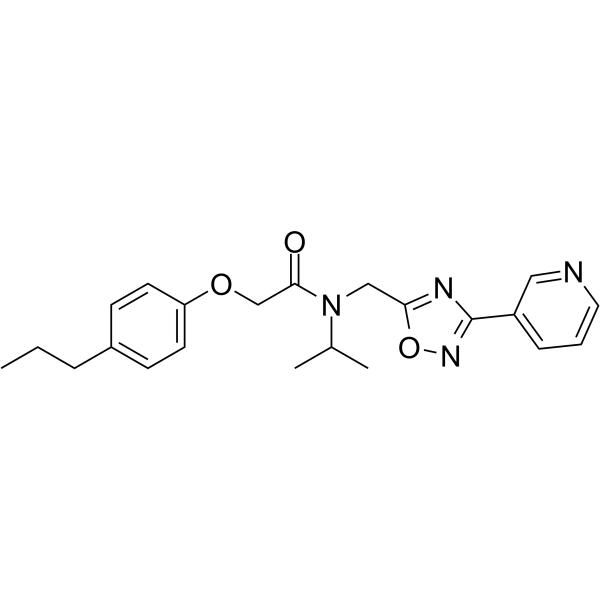
HY-12286
PI-1840CT-L Inhibitor -
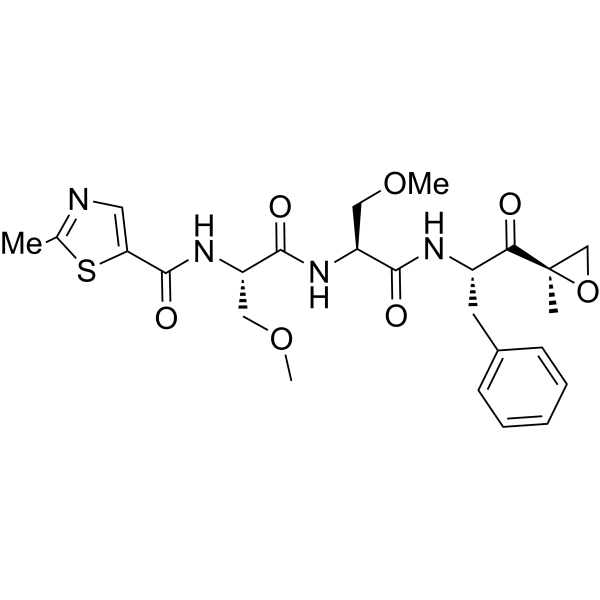
HY-12113
OprozomibProteasome Inhibitor -
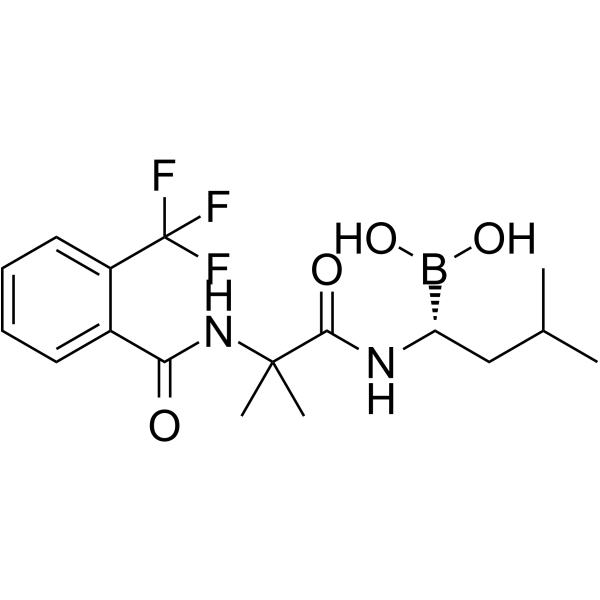
HY-114170
ML604440LMP2 Subunit Inhibitor -

HY-10227R
Bortezomib (Standard)Proteasome Inhibitor
Publications Citing Use of MedChemExpress (MCE) MG-262
MoreAll VEGFR Isoforms
More

Biological Activity
Description
Cellular Effect
|
Cell Line

|
Type | Value | Description | References |
|---|---|---|---|---|
| 5TGM1 | IC50 |
9.18 nM
Compound: MG-262
|
Cytotoxicity against mouse 5TGM1 cells after 48 to 72 hrs by SRB assay
Cytotoxicity against mouse 5TGM1 cells after 48 to 72 hrs by SRB assay
|
[PMID: 24119559] |
| RPMI-8226 | IC50 |
13.76 nM
Compound: MG-262
|
Cytotoxicity against human RPMI8226 cells after 48 to 72 hrs by SRB assay
Cytotoxicity against human RPMI8226 cells after 48 to 72 hrs by SRB assay
|
[PMID: 24119559] |
In Vitro
MG-262 (1 μM, 16 h) down-regulates the gene expression of the VEGF receptor Flt-1 (vascular endothelial growth factor receptor 1) in explant cultures of the developing chicken pecten oculi[1].
MG-262 (500 nM, 12 h) prevents the induction of Flt-1 by Lipopolysaccharide (LPS) (HY-D1056) in macrophages and down-regulates the expression of Flt-1 after LPS induction[1].
MG-262 (500 nM, 12 h) down-regulates Flt-1 gene expression in cultures of human microvascular endothelial cells[1].
MG-262 (0.1 nM-1 μM, 24 h) can concentration-dependently increase IL-8 promoter and activator protein-1 (AP-1) activities, but inhibits NF-κB activation (IC50 = 1-3 nM) induced by cytokines in HEK293 cells[2].
MG-262 (0.1 μM, 5-180 min) increases intracellular ROS in time-dependent manner in HEK293 cells[2].
MG262 (0.125-1 μM, 48 h) inhibits the growth of H22 and K562 cells, and has synergistic effect combined with Gambogic Acid (GA) (HY-N0087)[3].
MG262 (0.025 μM, 24 h) induces apoptotic cell death when combined with GA in H22 and K562 cells[3].
MG262 (0.025 μM, 12 or 24 h) induces cleavage of PARP as well as cleavage/activation of caspases 8 and 9 when combined with GA, but not when used alone in K562 cells [3].
MedChemExpress (MCE) has not independently confirmed the accuracy of these methods. They are for reference only.
-
Cell Line:Murine hepatoma H22 and human leukemia K562 cells
-
Concentration:0.125, 0.25, 0.5, 1 μM
-
Incubation Time:48 h
-
Result:From 5% when treated with 6.25 nM alone to 82% when combined with GA in K562 cells.
The addition of GA boosted the inhibitory effects on cell viability/proliferation from 11% to 73%.
-
Cell Line:Murine hepatoma H22 and human leukemia K562 cells
-
Concentration:0.025 μM
-
Incubation Time:24 h
-
Result:Showed that co-treatment of these malignant cells, especially K562 cells, dramatically increased the population of both Annexin V and propidium iodide (PI) stained cells, indicating that the combination with GA induced more cell death than each alone.
-
Cell Line:explant cultures of whole pecten oculi
-
Concentration:1 μM
-
Incubation Time:16 h
-
Result:The level of Flt-1 transcripts markedly decreased in the presence of the proteasome inhibitor.
The level of the KDR, VEGF, Ang-1 and Ang-2 transcripts was not changed by the presence of the proteasome inhibitor.
-
Cell Line:Human microvascular dermal neonatal endothelial cells (HMVEC-d-Neo)
-
Concentration:500 nM
-
Incubation Time:12 h
-
Result:The level of Flt-1 transcripts markedly decreased in the presence of the proteasome inhibitor.
-
Cell Line:K562 cells
-
Concentration:25 nM
-
Incubation Time:12 or 24 h
-
Result:The GA + proteasome inhibitor, but not GA or proteasome inhibitor alone, could induce cleavage of PARP as well as cleavage/activation of caspases 8 and 9.
In Vivo
MG-262 (1-5 μmol/kg (0.5-2.5 mg/kg); i.p.; 20 h before the test) accumulates the GFP reporter in the liver, indicating substantial impairment of the ubiquitin/proteasome system in UbG76V-GFP/1 mice[5].
MedChemExpress (MCE) has not independently confirmed the accuracy of these methods. They are for reference only.
-
Animal Model:UbG76V-GFP/1 mice (The transgenic construct was injected into fertilized CBA × C57BL/6 F1 oocytes. Transgenic founders were backcrossed to C57BL/6 mice)[5]
-
Dosage:1, 5 μmol/kg (0.5, 2.5 mg/kg)
-
Administration:Intraperitoneal injection (i.p.); 20 h before test
-
Result:Fluorescent cells were detected exclusively in the livers, resulted in accumulation of GFP in the vast majority of hepatocytes distributed throughout the live.
A dose-dependent decrease of the chymotrypsin-like activity of the proteasome was observed in lysates of the liver, kidney and spleen.
-
Animal Model:Transgenic mice (ubiquitously expresses a surrogate protein substrate for the Ubiquitin-proteasome system, referred to as GFPdgn)[4]
-
Dosage:5 μmol/kg (2.5 mg/kg)
-
Administration:Intravenous injection (i.v.); 20 h before the tissue samples were collected
-
Result:Inhibited chymotryptic activity in the heart, lungs, skeletal (Sk.) muscle, and liver by 50-75%.
GFPdgn levels in all the indicated organs clearly displayed significant increases.
- Detection of Apoptosis
- TUNEL staining for apoptotic DNA fragmentation
- Annexin V plus membrane-impermeant dye apoptosis staining
- Protocol for Cell Counting and Cell Density Analysis
- ROS/oxidative-stress fluorescent staining
- Somatic Cell Culture
- Apoptosis Solutions
- CCK-8/WST-8 Cell Proliferation Assay
- Cell Counting-Based Growth Curve Assay
- MTT Cell Proliferation Assay
- Cell Viability Determination by MTT Colorimetric Assay


Chemical Information
-
CAS No. 179324-22-2
-
Appearance Solid
-
Molecular Weight 491.43
-
Formula C25H42BN3O6
-
Color White to off-white
-
SMILES
O=C(N[C@H](B(O)O)CC(C)C)[C@H](CC(C)C)NC([C@H](CC(C)C)NC(OCC1=CC=CC=C1)=O)=O
-
Synonyms
Z-Leu-Leu-LeuB(OH)2; ZL3B
-
Shipping
Room temperature in continental US; may vary elsewhere.
-
Storage
Powder -20°C 3 years In solvent -80°C 6 months -20°C 1 month


Publications (1)
-
Journal Impact Factor
-
Most Recent
-
Phytomedicine
Baicalin attenuates neuronal damage associated with SDH activation and PDK2-PDH axis dysfunction in early reperfusion. [Abstract]2024 Jul:129:155570. PMID: 38579645


Solvent & Solubility
In Vitro:
DMSO : 5 mg/mL (10.17 mM; Need ultrasonic; Hygroscopic DMSO has a significant impact on the solubility of product, please use newly opened DMSO)
Please refer to the solubility information to select the appropriate solvent. Once prepared, please aliquot and store the solution to prevent product inactivation from repeated freeze-thaw cycles.
Storage method and period of stock solution: -80°C, 6 months; -20°C, 1 month. When stored at -80°C, please use it within 6 months. When stored at -20°C, please use it within 1 month.
Please refer to the solubility information to select the appropriate solvent. Once prepared, please aliquot and store the solution to prevent product inactivation from repeated freeze-thaw cycles.
Storage method and period of stock solution: -80°C, 6 months; -20°C, 1 month. When stored at -80°C, please use it within 6 months. When stored at -20°C, please use it within 1 month.
Concentration (start) × Volume (start) = Concentration (final) × Volume (final)


Purity & Documentation
-
Data Sheet (287 KB)
-
SDS (252 KB)
- English - EN (252 KB)
- Français - FR (252 KB)
- Deutsch - DE (252 KB)
- Norwegian - NO (252 KB)
- Español - ES (252 KB)
- Swedish - SV (252 KB)
- Italian - IT (252 KB)
- Korean - KR (252 KB)
- Portuguese - PT (252 KB)
-
Handling Instructions (2659 KB)
References
[1]. Mezquita J, et al. Down-regulation of Flt-1 gene expression by the proteasome inhibitor MG262. J Cell Biochem. 2003 Aug 15;89(6):1138-47. [Content Brief]
[2]. Wu HM, et al. Proteasome inhibitors stimulate activator protein-1 pathway via reactive oxygen species production. FEBS Lett. 2002 Aug 28;526(1-3):101-5. [Content Brief]
[3]. Huang H, et al. Gambogic acid enhances proteasome inhibitor-induced anticancer activity. Cancer Lett. 2011 Feb 28;301(2):221-8. [Content Brief]
[4]. Kumarapeli AR, et al A novel transgenic mouse model reveals deregulation of the ubiquitin-proteasome system in the heart by doxorubicin. FASEB J. 2005 Dec;19(14):2051-3. [Content Brief]
[5]. Lindsten K, et al. A transgenic mouse model of the ubiquitin/proteasome system. Nat Biotechnol. 2003 Aug;21(8):897-902. [Content Brief]


Complete Stock Solution Preparation Table
Please refer to the solubility information to select the appropriate solvent. Once prepared, please aliquot and store the solution to prevent product inactivation from repeated freeze-thaw cycles.
Storage method and period of stock solution: -80°C, 6 months; -20°C, 1 month. When stored at -80°C, please use it within 6 months. When stored at -20°C, please use it within 1 month.
| Optional Solvent | Concentration Solvent Mass | 1 mg | 5 mg | 10 mg | 25 mg |
|---|---|---|---|---|---|
| DMSO | 1 mM | 2.0349 mL | 10.1744 mL | 20.3488 mL | 50.8719 mL |
| 5 mM | 0.4070 mL | 2.0349 mL | 4.0698 mL | 10.1744 mL | |
| 10 mM | 0.2035 mL | 1.0174 mL | 2.0349 mL | 5.0872 mL |


MG-262 Related Classifications
HY-108551 Related Classifications
 Powered by Bioz