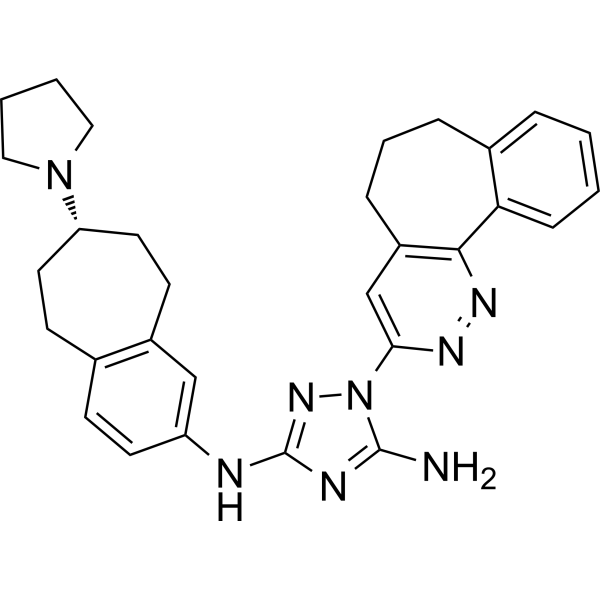
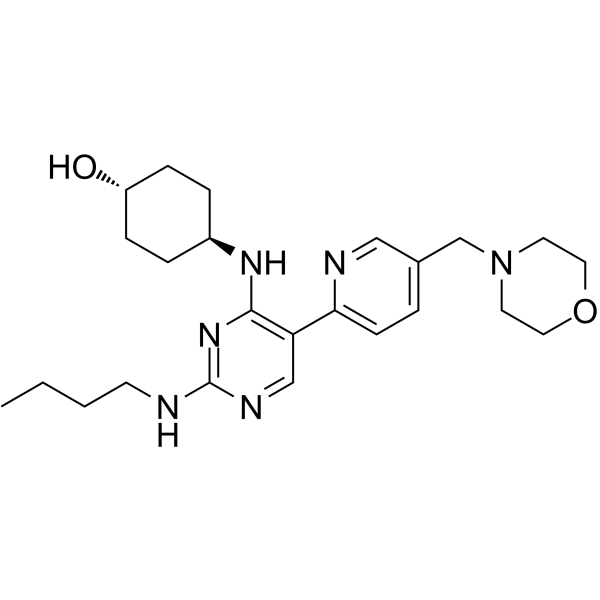
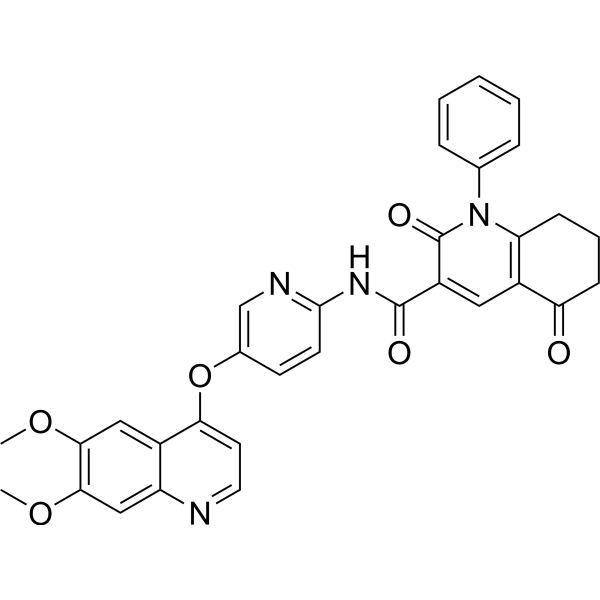
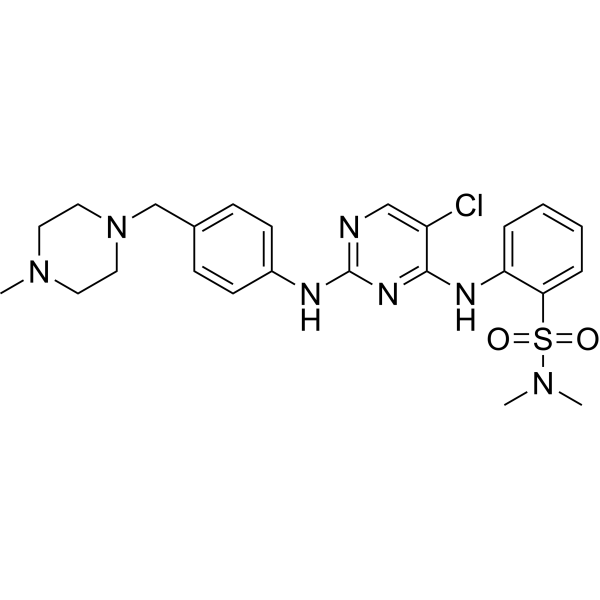
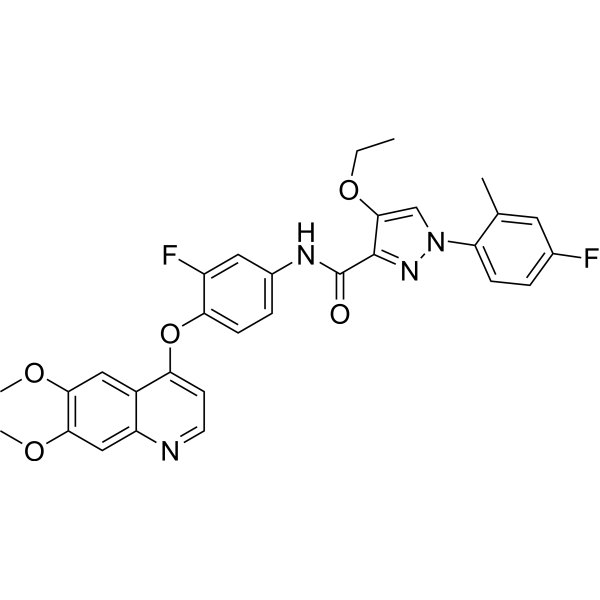
LDC1267
Based on 10 publication(s) in Google Scholar
LDC1267 is a AXL/TAM/FLT3 inhibitor with IC50 values of 42 nM, 130 nM, and 63 nM against AXL, MERTK, and TYRO3, respectively. LDC1267 blocks GAS6-induced AXL phosphorylation and the downstream AKT/ERK1/2 signaling pathway. LDC1267 inhibits cancer cell proliferation, colony formation, and glioblastoma cell invasion, without causing obvious impairment of cytotoxic autophagic flux. LDC1267 exerts a synergistic effect when used in combination with Imatinib (HY-15463) in chronic myeloid leukemia models. LDC1267 can be widely applied in studies related to glioblastoma and chronic myeloid leukemia.
For research use only. We do not sell to patients.
- Purity : 99.64%
- CAS No.: 1361030-48-9
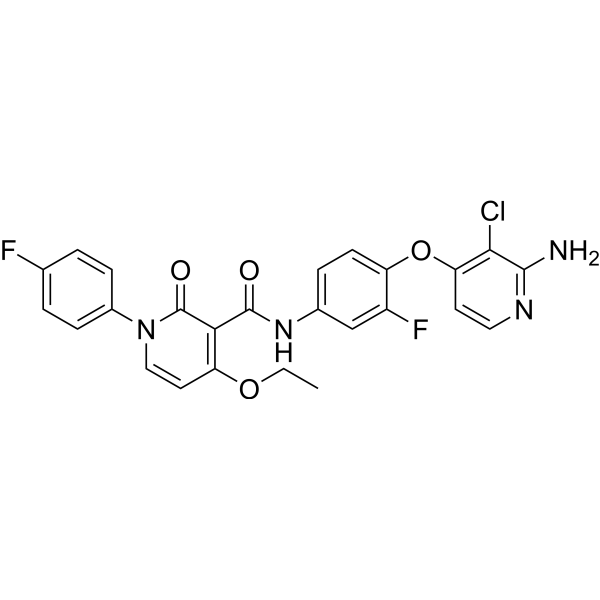
- Formula: C30H26F2N4O5
- Molecular Weight:560.55
-
Storage:Powder -20°C, 3 years , 4°C, 2 years ; In solvent -80°C, 2 years , -20°C, 1 year
Publications Citing Use of MedChemExpress (MCE) LDC1267
More- Cancer Cell. 2025 Feb 10;43(2):269-291.e19. [Abstract]
- Theranostics. 2018 Jul 30;8(15):4262-4278. [Abstract]
- Cell Commun Signal. 2025 Jan 22;23(1):39. [Abstract]
- Cell Mol Life Sci. 2022 May 27;79(6):316. [Abstract]
- J Mol Med (Berl). 2025 Sep;103(9):1043-1053. [Abstract]
- Biology (Basel). 2022 Jul 14;11(7):1059. [Abstract]
- FEBS J. 2022 May;289(10):2809-2827. [Abstract]
- Nencki Institute of Experimental Biology. 2022 Oct.
- Universität Würzburg . 2022 Feb.
- bioRxiv. 2020 Mar.
-
WB
-
WB
Biological Activity
Description
IC50 & Target
[1]|
Axl 42 nM (IC50) |
MERTK 130 nM (IC50) |
Tyro3 63 nM (IC50) |
Cellular Effect
|
Cell Line
|
Type | Value | Description | References |
|---|---|---|---|---|
| Hs-578T | IC50 |
19 nM
Compound: 7; LDC1267
|
Inhibition of AXL in human Hs578t cells by homogeneous time-resolved fluorescence assay
|
[PMID: 26555154] |
In Vitro
LDC1267 inhibits purified AXL, MERTK, and TYRO3 kinases with IC50 values of 42 nM, 130 nM, and 63 nM, respectively, and weakly inhibits purified FLT3 kinase with an IC50 of 2500 nM[1].
LDC1267 (0.005-1 μmol/L; 30 min pre-incubation) potently and specifically inhibits GAS6-mediated AXL, AKT, and ERK1/2 phosphorylation in glioblastoma LN229 cells with IC50 values of 26, 25, and 48 nmol/L, respectively[2].
LDC1267 (up to 10 μmol/L; 72 h) does not impair the viability of glioblastoma LN229 cells at concentrations up to 10 μmol/L[2].
LDC1267 (1-2.5 μmol/L; 4 days) specifically inhibits GAS6-induced invasion of glioblastoma LN229 spheroids at 1 and 2.5 μmol/L without reducing 2D cell viability[2].
LDC1267 (2.5 μmol/L; 24 h) does not disrupt the endo-lysosomal compartment in wild-type or AXL KO glioblastoma LN229 cells at 2.5 μmol/L[2].
LDC1267 (2.5 μmol/L; 24 h) does not impair autophagic flux in wild-type or AXL KO glioblastoma LN229 cells at 2.5 μmol/L[2].
LDC1267 (1-5 μM; 72 h) potently inhibits proliferation of K562-S and K562-R cells with IC50 values of 5 μM and 3 μM, respectively, in a dose-dependent manner[3].
LDC1267 (4 μM for K562-S, 3 μM for K562-R, 4 μM combined with 0.25 μM Imatinib for K562-S; 72 h) interferes with the Wnt/β-catenin pathway in K562-S and K562-R cells by downregulating pathway regulators AXL-RTK and EYA3, and downstream targets c-Myc and Axin2, with enhanced effects when combined with Imatinib in K562-S cells[3].
LDC1267 (4 μM; 72 h) does not induce apoptosis in K562-S or K562-R cells[3].
MedChemExpress (MCE) has not independently confirmed the accuracy of these methods. They are for reference only. Further protocols information, click here.
-
Cell Line:glioblastoma LN229 cells
-
Concentration:0.005-1 μmol/L (30-minute pre-incubation); 400 ng/mL GAS6 (10-minute stimulation)
-
Incubation Time:30 min (pre-incubation with LDC1267); 10 min (stimulation with GAS6)
-
Result:Potently blocked GAS6-induced phosphorylation of AXL, AKT, and ERK1/2.
Displayed IC50 values of 26 nmol/L for inhibition of AXL phosphorylation, 25 nmol/L for inhibition of AKT phosphorylation, and 48 nmol/L for inhibition of ERK1/2 phosphorylation.
Inhibited phosphorylation of AXL, AKT, and ERK1/2 at closely matched concentrations, indicating specificity for AXL-mediated signaling.
-
Cell Line:glioblastoma LN229 cells grown as spheroids
-
Concentration:1-2.5 μmol/L
-
Incubation Time:4 days (with GAS6)
-
Result:Blocked GAS6-induced invasion of LN229 spheroids at both tested concentrations.
Did not affect the viability of 2D monolayer cultures of LN229 cells at these concentrations.
-
Cell Line:wild-type and AXL KO glioblastoma LN229 cells
-
Concentration:2.5 μmol/L
-
Incubation Time:24 h
-
Result:Did not trigger changes in the distribution, number, or area of EEA1-positive early endosomes or LAMP1-positive late endosomes/lysosomes in either wild-type or AXL KO LN229 cells.
-
Cell Line:Imatinib-sensitive K562 (K562-S), Imatinib-resistant K562 (K562-R)
-
Concentration:1-5 μM
-
Incubation Time:72 h
-
Result:Exhibited a significant dose-dependent antiproliferative effect in both K562-S and K562-R cells.
Reached an IC50 of 5 μM in K562-S cells and 3 μM in K562-R cells.
-
Cell Line:Imatinib-sensitive K562 (K562-S), Imatinib-resistant K562 (K562-R)
-
Concentration:4 μM (K562-S cells); 3 μM (K562-R cells); 4 μM LDC1267 combined with 0.25 μM Imatinib (K562-S cells)
-
Incubation Time:72 h
-
Result:Significantly downregulated AXL-RTK (p-value 0.0005), EYA3 (p-value <0.0001), c-Myc (p-value <0.0001), and Axin2 (p-value <0.0001) in K562-S cells when used alone.
Caused further significant downregulation of AXL-RTK, EYA3, c-Myc, and Axin2 (p-values <0.0001) in K562-S cells when combined with Imatinib.
Significantly downregulated AXL-RTK (p-value <0.0001), EYA3 (p-value 0.0001), c-Myc (p-value <0.05), and Axin2 (p-value <0.0001) in K562-R cells.
In Vivo
-
Animal Model:C57BL/6J wild type mice (8-12 weeks old syngeneic bearing B16F10 cells)[1]
-
Dosage:20mg/kg
-
Administration:Intraperitoneal injection; every 12 hours for 14 days
-
Result:Markedly reduced metastatic spreading of melanomas.
Chemical Information
-
CAS No. 1361030-48-9
-
Appearance Solid
-
Molecular Weight 560.55
-
Formula C30H26F2N4O5
-
Color White to off-white
-
SMILES
FC1=CC(NC(C2=NN(C3=CC=C(F)C=C3C)C=C2OCC)=O)=CC=C1OC4=CC=NC5=CC(OC)=C(OC)C=C54
-
Shipping
Room temperature in continental US; may vary elsewhere.
-
Storage
Powder -20°C 3 years 4°C 2 years In solvent -80°C 2 years -20°C 1 year
Publications (10)
-
Journal Impact Factor
-
Most Recent
-
Cancer Cell
Adiponectin reduces immune checkpoint inhibitor-induced inflammation without blocking anti-tumor immunity. [Abstract]2025 Feb 10;43(2):269-291.e19. PMID: 39933899 -
Theranostics
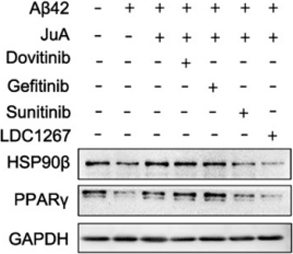
Jujuboside A promotes Aβ clearance and ameliorates cognitive deficiency in Alzheimer's disease through activating Axl/HSP90/PPARγ pathway. [Abstract]2018 Jul 30;8(15):4262-4278. PMID: 30128052
LDC1267 purchased from MedChemExpress. Usage Cited in: Theranostics. 2018 Jul 30;8(15):4262-4278. [Abstract]
BV2 cells are pretreated with 0.1% DMSO (Ctrl), JuA (25 µM) or JuA (25 µM) with the indicated antagonist of RTKs (Dovitinib at 1 µM, Gefinitib at 2.5 µM, Sunitinib at 2.5 µM and LDC1267 at 1 µM) for 30 min, followed by administration of Aβ42 (5 μM) for 12 h.
LDC1267 purchased from MedChemExpress. Usage Cited in: Theranostics. 2018 Jul 30;8(15):4262-4278. [Abstract]
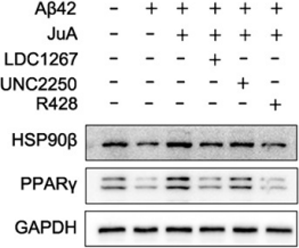
BV2 cells are pretreated with 0.1% DMSO (Ctrl), JuA (25 µM) or JuA (25 µM) with the indicated antagonist of TAM receptor (LDC1267 at 1 µM, UNC2250 at 5 µM, R428 at 5 µM) for 30 min, followed by administration of Aβ42 (5 μM) for 12 h.
-
Cell Commun Signal
Bisecting GlcNAc modification of vesicular GAS6 regulates CAFs activation and breast cancer metastasis. [Abstract]2025 Jan 22;23(1):39. PMID: 39844194 -
Cell Mol Life Sci
2022 May 27;79(6):316. PMID: 35622156 -
J Mol Med (Berl)
Sex hormone-binding globulin restrains hepatic fibrosis via inhibition of Tgfβ expression. [Abstract]2025 Sep;103(9):1043-1053. PMID: 40616670 -
Biology (Basel)
Alcohol and HIV-Derived Hepatocyte Apoptotic Bodies Induce Hepatic Stellate Cell Activation. [Abstract]2022 Jul 14;11(7):1059. PMID: 36101437 -
FEBS J
TNF-α/ENO1 signaling facilitates testicular phagocytosis by directly activating Elmo1 gene expression in mouse Sertoli cells. [Abstract]2022 May;289(10):2809-2827. PMID: 34919331 -
-
-
Solvent & Solubility
In Vitro:
DMSO : 50 mg/mL (89.20 mM; Need ultrasonic; Hygroscopic DMSO has a significant impact on the solubility of product, please use newly opened DMSO)
Please refer to the solubility information to select the appropriate solvent. Once prepared, please aliquot and store the solution to prevent product inactivation from repeated freeze-thaw cycles.
Storage method and period of stock solution: -80°C, 2 years; -20°C, 1 year. When stored at -80°C, please use it within 2 years. When stored at -20°C, please use it within 1 year.
Please refer to the solubility information to select the appropriate solvent. Once prepared, please aliquot and store the solution to prevent product inactivation from repeated freeze-thaw cycles.
Storage method and period of stock solution: -80°C, 2 years; -20°C, 1 year. When stored at -80°C, please use it within 2 years. When stored at -20°C, please use it within 1 year.
Concentration (start) × Volume (start) = Concentration (final) × Volume (final)
In Vivo:
Select the appropriate dissolution method based on your experimental animal and administration route.
- For the following dissolution methods, please ensure to first prepare a clear stock solution using an In Vitro approach and then sequentially add co-solvents:
- To ensure reliable experimental results, the clarified stock solution can be appropriately stored based on storage conditions. As for the working solution for In Vivo experiments, it is recommended to prepare freshly and use it on the same day.
- The percentages shown for the solvents indicate their volumetric ratio in the final prepared solution. If precipitation or phase separation occurs during preparation, heat and/or sonication can be used to aid dissolution.
Add each solvent one by one: 10% DMSO 40% PEG300 5% Tween-80 45% Saline
Solubility: ≥ 2.5 mg/mL (4.46 mM); Clear solution
This protocol yields a clear solution of ≥ 2.5 mg/mL (saturation unknown).
Taking 1 mL working solution as an example, add 100 μL DMSO stock solution (25.0 mg/mL) to 400 μL PEG300, and mix evenly; then add 50 μL Tween-80 and mix evenly; then add 450 μL Saline to adjust the volume to 1 mL.
Preparation of Saline: Dissolve 0.9 g sodium chloride in ddH₂O and dilute to 100 mL to obtain a clear Saline solution.
Add each solvent one by one: 10% DMSO 90% (20% SBE-β-CD in Saline)
Solubility: 2.5 mg/mL (4.46 mM); Suspended solution; Need ultrasonic
This protocol yields a suspended solution of 2.5 mg/mL. Suspended solution can be used for oral and intraperitoneal injection.
Taking 1 mL working solution as an example, add 100 μL DMSO stock solution (25.0 mg/mL) to 900 μL 20% SBE-β-CD in Saline, and mix evenly.
Preparation of 20% SBE-β-CD in Saline (4°C, storage for one week): 2 g SBE-β-CD powder is dissolved in 10 mL Saline, completely dissolve until clear.
For the following dissolution methods, please prepare the working solution directly:
It is recommended to prepare fresh solutions and use them promptly within a short period of time.
The percentages shown for the solvents indicate their volumetric ratio in the final prepared solution. If precipitation or phase separation occurs during preparation, heat and/or sonication can be used to aid dissolution.
Add each solvent one by one: 50% PEG300 50% Saline
Solubility: 10 mg/mL (17.84 mM); Suspended solution; Need ultrasonic
In Vivo Dissolution Calculator
Please enter the basic information of animal experiments:
-
-
-
-
Recommended: Prepare an additional quantity of animals to account for potential losses during experiments.
Please enter your animal formula composition:
-
%DMSO +
Recommended: Keep the proportion of DMSO in working solution below 2% if your animal is weak.
-
%+
-
+%Tween-80 + +
-
%Saline +
The co-solvents required include: DMSO, . All of co-solvents are available by MedChemExpress (MCE). , Tween 80. All of co-solvents are available by MedChemExpress (MCE).
Working solution concentration: 0.22 mg/mL
Method for preparing stock solution: mg drug dissolved in μL DMSO. Stock solution concentration: mg/mL.
1. Take μL DMSO stock solution;
2. Add μL .
μL , mix evenly;
3. Then add μL Tween 80, mix evenly;
4. Then add μL
Please ensure that the stock solution in the first step is dissolved to a clear state, and add co-solvents in sequence. You can use ultrasonic heating (ultrasonic cleaner, recommended frequency 20-40 kHz), vortexing, etc. to assist dissolution.
Protocols
-
Somatic Cell Culture
A method of simulating the in vivo environment in vitro to maintain the cell growth, differentation and main functions.
-
Cell Cytotoxicity Assay
Cytotoxicity assays are usually based on the assessment of cell membrane damage, which can also be indirectly detected by measuring cell viability. Detection methods include MTT assay, CKK-8 assay, LDH assay and ATP assay, etc.
-
Autophagy
Autophagy is a process in which eukaryotic cells use lysosomes to degrade their own cytoplasmic proteins and damaged organelles under the regulation of autophagy related gene (Atg). Microtubule-associated proteins light chain 3 (LC3) is recognized as autophagy marker, which transfers from cytoplasmic LC3 (LC3-I) to membrane type (LC3-II). LC3-II/I ratio could be detected by Western Blot and fluorescence microscopy.
-
Organotypic 3D Invasion Assay
The organotypic 3D invasion assay measures carcinoma-cell invasion into a fibroblast-remodeled extracellular matrix, usually collagen I with or without basement-membrane matrix, under an air-liquid or grid-supported culture condition; the readout is invasion depth, invaded area, or an invasion index from histological or fluorescence images. This assay models stromal regulation of invasion because fibroblasts or CAFs remodel matrix, generate tracks, and can lead collective carcinoma-cell invasion; the resulting cancer-cell penetration into the gel reflects tumor-stroma-ECM interactions rather than migration on a rigid 2D substrate.
-
Cell invasion
Cell invasion is the ability of cells to migrate from one area to another via the extracellular matrix. Cell invasion is the response of normal and cancer cells to chemical and mechanical stimuli. Before migrating to a new region, the extracellular matrix is degraded by proteases within the cell. Cell invasion often occurs during wound repair, vascularization and inflammation, abnormal tissue invasion, and tumor cell metastasis.
-
Matrigel/ECM Transwell Invasion Assay
The Matrigel/ECM Transwell invasion assay measures the ability of cells to move toward a chemoattractant while crossing an extracellular-matrix barrier placed on a porous membrane; therefore, the readout reflects both chemotactic motility and matrix invasion rather than migration alone. Matrigel is a basement-membrane-rich matrix derived from Engelbreth-Holm-Swarm mouse sarcoma and has been used as a reconstituted basement membrane barrier in chemoinvasion assays. The assay readout is generated by quantifying cells that reach the underside of the insert membrane or lower compartment after incubation, commonly by staining and counting invaded cells or by fluorescence-based quantification.
-
Soft Agar Colony Formation Assay
Soft agar colony formation assay measures anchorage-independent growth, in which transformed or tumorigenic cells proliferate as colonies in a semisolid agar matrix while many non-transformed adherent cells fail to proliferate without attachment; classic studies showed that growth in semisolid medium correlates with tumorigenicity in nude mice, and later protocol papers describe the method as a stringent in vitro assay for malignant transformation. The readout is the number, size, morphology, or signal intensity of colonies formed within agar after incubation; published formats include manual colony counting after staining, 96-well or 384-well quantitative formats, DNA-binding dye detection, MTT/tetrazolium-based detection, digital image analysis, and PCR-based marker detection from soft agar cultures.
-
MTT Cell Proliferation Assay
The MTT assay is a colorimetric endpoint assay for estimating viable cell number, cell growth, cytotoxicity, or cell activation in cultured mammalian cells. Living cells reduce the yellow tetrazolium salt MTT into purple/blue formazan, while dead cells do not generate the same signal; the resulting color can be quantified with a multiwell spectrophotometer. MTT reduction is commonly interpreted as a readout of metabolic activity that often correlates with viable cell number, but it should not be treated as a direct cell-counting method unless the assay is optimized for the cell type and experimental condition. Studies show that MTT reduction can involve mitochondrial and non-mitochondrial reducing systems, and formazan may accumulate in intracellular lipid droplets rather than simply marking mitochondria.
-
Macroautophagy Solutions
Macroautophagy is a conserved lysosome-dependent degradation pathway in which cytoplasmic material is sequestered into double-membrane autophagosomes and delivered to lysosomes for degradation and recycling. The pathway supports cellular homeostasis during nutrient limitation, organelle stress, protein-aggregate accumulation, infection, differentiation, and tissue remodeling by coupling cargo sequestration, autophagosome maturation, lysosomal fusion, and degradation of cargo-derived macromolecules. The core molecular sequence includes initiation by nutrient- and stress-regulated autophagy machinery, autophagosome nucleation, LC3/ATG8-family conjugation to autophagosomal membranes, cargo selection through receptors such as SQSTM1/p62, autophagosome-lysosome fusion, and lysosomal degradation. LC3 was identified as a mammalian homolog of yeast Atg8 that localizes to autophagosomal membranes after processing, and p62/SQSTM1 was shown to connect ubiquitinated cargo with autophagic degradati
-
3D Collagen/Hydrogel Matrix Invasion Assay
The 3D collagen/hydrogel matrix invasion assay is based on embedding cells within or on top of a three-dimensional fibrillar extracellular matrix (typically type I collagen or collagen-rich hydrogels) to model cell migration through a physiologically relevant physical barrier. In this system, invasive behavior is quantified by measuring the ability of cells to degrade, remodel, and migrate through the 3D matrix architecture, which better reflects in vivo tissue invasion compared to 2D migration assays. Collagen-based 3D matrices provide structural cues such as fiber alignment and porosity that influence cell motility and integrin-mediated adhesion, enabling observation of collective or single-cell invasion modes depending on matrix density and organization.
-
Spheroid/Tumor Organoid Invasion Assay
The spheroid/tumor organoid invasion assay measures outward movement of cancer cells from a compact 3D aggregate into an extracellular matrix, usually collagen I, basement membrane matrix, or mixed collagen-Matrigel hydrogels; the readout is generated by bright-field, fluorescence, confocal, or time-lapse imaging of cell egress, invasion area, invasion distance, dispersion, protrusion formation, basement-membrane perforation, or cell trajectories. The assay reflects cell-cell cohesion, cell-matrix adhesion, matrix remodeling, protease-dependent invasion, contractility, and invasion behavior in a 3D microenvironment rather than migration on a flat 2D surface.
-
Western Blot
Western blotting (WB) is a commonly used experimental method in molecular biology, biochemistry, and immunogenetics for identifying and quantifying target proteins. It combines gel electrophoresis with immunoassay, enabling researchers to analyze protein expression, post-translational modifications, and molecular weight.
-
Ex Vivo Tissue Slice/Explant Invasion Assay
Ex vivo organotypic tissue slice cultures are based on maintaining thin, viable tissue sections at an air-liquid interface to preserve native cytoarchitecture and local cell-matrix interactions, enabling observation of cell behavior such as migration and tissue infiltration within a physiologically relevant 3D microenvironment. The method relies on maintaining tissue viability on porous membrane supports, allowing diffusion of nutrients and oxygen while preserving structural integrity for extended culture periods, which makes it suitable for studying dynamic cellular processes in intact tissue contexts such as cell movement and tissue remodeling. .
-
Patient-Derived Organoid Invasion Assay
Patient-derived organoid (PDO) invasion assays are based on the ability of epithelial tumor organoids to self-organize in three-dimensional extracellular matrix (ECM) hydrogels (commonly Matrigel) and to recapitulate key aspects of in vivo tissue architecture, including polarity, proliferation, and invasive outgrowth when exposed to permissive microenvironmental cues. In this system, invasion is operationally defined as the emergence of multicellular protrusions, collective budding, or single-cell dissemination from the organoid core into the surrounding ECM, reflecting epithelial-mesenchymal plasticity and matrix remodeling capacity. Organoid morphology and invasive behavior are typically monitored using brightfield or confocal microscopy over time, enabling quantitative assessment of invasion area, protrusion number, and structural disruption of the organoid spheroid architecture.
-
BrdU Incorporation Assay
Bromodeoxyuridine (BrdU) incorporation assay is based on the principle that BrdU, a thymidine analog, is incorporated into newly synthesized DNA during the S phase of the cell cycle, thereby serving as a marker of DNA replication and cellular proliferation. Incorporated BrdU can be detected using anti-BrdU antibodies following DNA denaturation, enabling visualization or quantification of proliferating cells through immunochemical detection methods such as immunofluorescence or immunohistochemistry.
-
CFSE Dye Dilution Proliferation Assay
The CFSE (carboxyfluorescein diacetate succinimidyl ester) dye dilution proliferation assay is based on the covalent labeling of intracellular proteins by a cell-permeant fluorescent dye that becomes fluorescent upon intracellular ester cleavage and then is stably retained within cells. As labeled cells divide, the dye is partitioned equally between daughter cells, resulting in a stepwise halving of fluorescence intensity that can be quantified by flow cytometry to determine the number of cell divisions undergone by each cell population. This fluorescence dilution approach enables quantitative tracking of lymphocyte proliferation at the single-cell level over multiple rounds of division. CFSE-based proliferation analysis has been widely applied to measure antigen-driven lymphocyte expansion in vitro, where discrete fluorescence peaks correspond to successive cell divisions and allow reconstruction of proliferative history within heterogeneous populations.
-
Dye-dilution cell tracking and proliferation staining
Dye-dilution cell tracking assays quantify cell proliferation by covalently labeling intracellular proteins with a stable fluorescent dye that is equally partitioned between daughter cells during mitosis, resulting in stepwise halving of fluorescence intensity with each cell division as measured by flow cytometry histograms. Carboxyfluorescein diacetate succinimidyl ester (CFSE) is a prototypical dye that diffuses into cells, is enzymatically converted into a fluorescent compound, and then covalently binds intracellular amine groups, producing long-lived fluorescence suitable for tracking multiple rounds of division in vitro and in vivo. Successive generations of dividing cells form discrete peaks of decreasing fluorescence intensity, enabling estimation of proliferation history, precursor frequency, and division index within heterogeneous populations. Alternative dyes such as CellTrace Violet (CTV) and far-red membrane dyes (e. g. , PKH26) follow the same dilution principle but differ
-
CCK-8/WST-8 Cell Proliferation Assay
The CCK-8/WST-8 assay is based on the reduction of the water-soluble tetrazolium salt WST-8 to a water-soluble formazan product by cellular dehydrogenases in metabolically active cells, where the generated formazan amount is proportional to the number of living cells and is quantified by measuring absorbance in the visible range, providing a colorimetric readout for cell viability and proliferation assessment. This class of tetrazolium-based assays improves upon earlier MTT-based systems by producing a water-soluble formazan, eliminating the need for organic solubilization steps and enabling direct spectrophotometric measurement in culture medium.
-
Protocol for Cell Cycle
Cell-cycle analysis by flow cytometry measures DNA content in single cells to estimate the fraction of cells in G0/G1, S, and G2/M phases. Propidium iodide intercalates into DNA, and after RNA removal with RNase, fluorescence intensity reflects cellular DNA content: 2N cells are assigned to G0/G1, cells between 2N and 4N to S phase, and 4N cells to G2/M. DNA-content analysis alone cannot reliably separate G0 from G1 or G2 from M. Ki-67 can distinguish quiescent G0 cells from cycling cells, EdU or BrdU incorporation marks active DNA synthesis in S phase, and phospho-histone H3 staining identifies mitotic cells within the 4N population.
-
Cell Counting-Based Growth Curve Assay
Cell counting-based growth curve assays quantify cell proliferation by directly measuring changes in viable cell number over time using manual or automated counting methods such as hemocytometer-based counting or instrument-assisted cell enumeration, enabling construction of growth curves that reflect population expansion dynamics in response to culture conditions. A widely used approach is trypan blue exclusion with hemocytometer counting, where membrane-compromised (non-viable) cells take up the dye, allowing discrimination between viable and non-viable cells while simultaneously enabling total cell number quantification. Repeated sampling across time points allows estimation of proliferation rate, growth phases, and comparative growth kinetics between experimental conditions.
-
Colony Formation (Clonogenic) Assay
The clonogenic (colony formation) assay measures the ability of a single cell to retain reproductive viability and form a macroscopic colony, typically defined as a cluster derived from one progenitor cell after a defined growth period. This assay is widely used to evaluate cell survival after exposure to ionizing radiation or cytotoxic treatments and is considered a standard method in radiation biology for generating dose-response relationships of reproductive cell death. Colony formation reflects long-term proliferative capacity rather than short-term metabolic activity, and survival is quantified by comparing treated versus untreated conditions based on colony number and derived survival fractions.
-
3D Tumor Spheroid Invasion Assay
3D tumor spheroid invasion assay measures outward tumor-cell movement from a compact multicellular spheroid into a surrounding extracellular matrix, producing image-based readouts such as invasion area, invasion distance, cell dispersion, or time-resolved cell movement. The method models tumor-cell interaction with matrix components in three dimensions and is used to study invasive phenotypes in cancer models including glioblastoma, squamous cell carcinoma, breast cancer, prostate cancer, ovarian cancer, and other solid tumor systems.
-
Cell Viability Determination by MTT Colorimetric Assay
The following protocol uses the MTT colorimetric assay as a classic literature-established method for assessing cell viability/metabolic activity in cultured mammalian cells. MTT[3-(4,5-dimethylthiazol-2-yl)-2,5-diphenyltetrazolium bromide] is reduced by metabolically active cells to a colored formazan product; the amount of formazan is quantified spectrophotometrically and provides an indirect measure of metabolically active viable cells. Importantly, MTT reduction reflects cellular oxidoreductase/metabolic activity rather than an absolute direct count of living cells, so changes in cellular metabolism can alter the signal independently of cell number.
-
Matrigel Transwell/Boyden Chamber Invasion Assay
Matrigel Transwell/Boyden chamber invasion assay measures the ability of cells to degrade or traverse an extracellular matrix-coated porous membrane and move from an upper chamber toward a chemoattractant in a lower chamber. Invasion is distinguished from migration by coating the membrane with Matrigel or basement membrane matrix; uncoated inserts measure migration, while coated inserts require cells to cross an ECM barrier before reaching the underside of the membrane.
-
Kinase activity and phosphorylation assays
Kinase activity assays measure the ability of kinases to transfer phosphate groups from ATP to specific substrates, while phosphorylation assays detect the presence and levels of phosphorylated proteins. Common methods include radiolabeled ATP incorporation (e. g. ,), ADP release detection via bioluminescence (e. g. ,[3]), enzyme-linked immunosorbent assays (ELISA) for phospho-specific epitopes (e. g. ,[6]), and microtiter-based formats for high-throughput screening (e. g. ,[8]). The ADP-Glo assay quantifies kinase activity by measuring ADP produced during phosphorylation using a luciferase-based system. Radiometric assays involve autoradiography or scintillation counting after incorporation of 32P-labeled ATP into substrate proteins. ELISA-based approaches rely on phospho-specific antibodies to detect activated kinases in cell lysates or purified samples.
-
Invadopodia/Fluorescent Gelatin Degradation Assay
Invadopodia/fluorescent gelatin degradation assay detects proteolytic extracellular matrix degradation by cancer-cell invadopodia, which are actin-rich protrusive structures associated with matrix remodeling, invasion, and metastasis. The readout is generated by culturing cells on fluorescent gelatin and measuring dark degraded areas where fluorescent substrate has been locally removed, often together with immunofluorescent detection of invadopodia markers such as F-actin, cortactin, and TKS5.
-
EdU Incorporation Assay (Click Chemistry-Based DNA Synthesis Measurement)
The EdU incorporation assay measures DNA synthesis by adding the thymidine analog 5-ethynyl-2′-deoxyuridine to cells or tissues, where it is incorporated into newly synthesized DNA during S phase. Incorporated EdU is detected by copper-catalyzed azide-alkyne cycloaddition, in which a fluorescent azide covalently reacts with the ethynyl group on EdU, allowing S-phase cells to be detected by fluorescence microscopy, flow cytometry, or high-content imaging. EdU detection does not require DNA denaturation or anti-BrdU antibody access, which preserves sample structure and improves compatibility with immunostaining and multiparameter cytometry compared with BrdU-based detection. EdU can be cytotoxic in a cell-type- and exposure-dependent manner, so pulse duration, concentration, and continuous-labeling designs should be validated for each cell type.
-
Ki-67 Immunostaining Proliferation Assay
Ki-67 immunostaining measures the growth fraction of a cell population by detecting Ki-67, a nuclear antigen present in proliferating cells and absent in quiescent G0 cells. The readout is the percentage of Ki-67-positive nuclei among total counted cells, commonly called the Ki-67 labeling index or proliferation index.
-
PCNA Immunodetection Proliferation Assay
PCNA immunodetection measures proliferative activity by detecting proliferating cell nuclear antigen, a nuclear protein associated with DNA polymerase δ function and DNA replication. The assay readout is the proportion of PCNA-positive nuclei among total counted cells, but PCNA labeling is not identical to BrdU labeling because PCNA can mark late G1/early S-associated replication competence and may persist beyond active DNA synthesis depending on fixation and extraction conditions.
-
Protocol for Cell Counting and Cell Density Analysis
Cell counting and cell-density analysis estimate the number of cells in a known volume or field area. Manual hemocytometer counting uses a chamber of defined geometry to convert counted cells into cells/mL, while automated counters and image-analysis workflows detect cell objects from optical, brightfield, fluorescence, impedance, or digital-image features. Trypan blue viability counting is based on dye exclusion: viable cells with intact membranes exclude dye, while non-viable cells with compromised membranes stain blue. The readout is total cell density, viable-cell density, dead-cell density, and percent viability. Cell density can also be estimated from microscopy images by counting objects per image area, from flow cytometry using calibrated volume or reference particles, or from in situ microscopy in bioreactors after calibration against reference methods such as hemocytometer or flow cytometry.
-
Protocol for Kinase activity and phosphorylation assays
Kinase activity assays measure transfer of phosphate from ATP to a protein or peptide substrate, generating phosphorylated substrate, ADP, or incorporated radiolabeled phosphate as the readout; phosphorylation assays measure site-specific phosphorylation in cells or tissues as a proxy for kinase-pathway activation, inhibition, or substrate regulation. Phosphorylation can be detected by phospho-specific Western blot, immunoprecipitation kinase assay, phospho-immunofluorescence, phospho-flow cytometry, luminescent ADP detection, radiolabeled ATP incorporation, or reporter-based pathway assays, and these readouts can be applied to cancer cells, primary neurons, mouse tumors, organoids, inflammatory macrophages, ferroptosis studies, and mitophagy studies when the kinase target is biologically relevant.
Purity & Documentation
-
Data Sheet (284 KB)
-
SDS (393 KB)
- English - EN (393 KB)
- Français - FR (393 KB)
- Deutsch - DE (393 KB)
- Norwegian - NO (393 KB)
- Español - ES (393 KB)
- Swedish - SV (393 KB)
- Italian - IT (393 KB)
- Korean - KR (393 KB)
- Portuguese - PT (393 KB)
-
Handling Instructions (2659 KB)
References
[2]. Zdżalik-Bielecka D, et al. Bemcentinib and Gilteritinib Inhibit Cell Growth and Impair the Endo-Lysosomal and Autophagy Systems in an AXL-Independent Manner. Mol Cancer Res. 2022;20(3):446-455. [Content Brief]
[3]. Yousaf M, et al. TAM family kinases are potential candidate targets for therapeutic intervention in chronic myeloid leukemia. Discov Oncol. 2025;16(1):1944. Published 2025 Oct 21. [Content Brief]
Complete Stock Solution Preparation Table
Please refer to the solubility information to select the appropriate solvent. Once prepared, please aliquot and store the solution to prevent product inactivation from repeated freeze-thaw cycles.
Storage method and period of stock solution: -80°C, 2 years; -20°C, 1 year. When stored at -80°C, please use it within 2 years. When stored at -20°C, please use it within 1 year.
| Optional Solvent | Concentration Solvent Mass | 1 mg | 5 mg | 10 mg | 25 mg |
|---|---|---|---|---|---|
| DMSO | 1 mM | 1.7840 mL | 8.9198 mL | 17.8396 mL | 44.5991 mL |
| 5 mM | 0.3568 mL | 1.7840 mL | 3.5679 mL | 8.9198 mL | |
| 10 mM | 0.1784 mL | 0.8920 mL | 1.7840 mL | 4.4599 mL | |
| 15 mM | 0.1189 mL | 0.5947 mL | 1.1893 mL | 2.9733 mL | |
| 20 mM | 0.0892 mL | 0.4460 mL | 0.8920 mL | 2.2300 mL | |
| 25 mM | 0.0714 mL | 0.3568 mL | 0.7136 mL | 1.7840 mL | |
| 30 mM | 0.0595 mL | 0.2973 mL | 0.5947 mL | 1.4866 mL | |
| 40 mM | 0.0446 mL | 0.2230 mL | 0.4460 mL | 1.1150 mL | |
| 50 mM | 0.0357 mL | 0.1784 mL | 0.3568 mL | 0.8920 mL | |
| 60 mM | 0.0297 mL | 0.1487 mL | 0.2973 mL | 0.7433 mL | |
| 80 mM | 0.0223 mL | 0.1115 mL | 0.2230 mL | 0.5575 mL |