



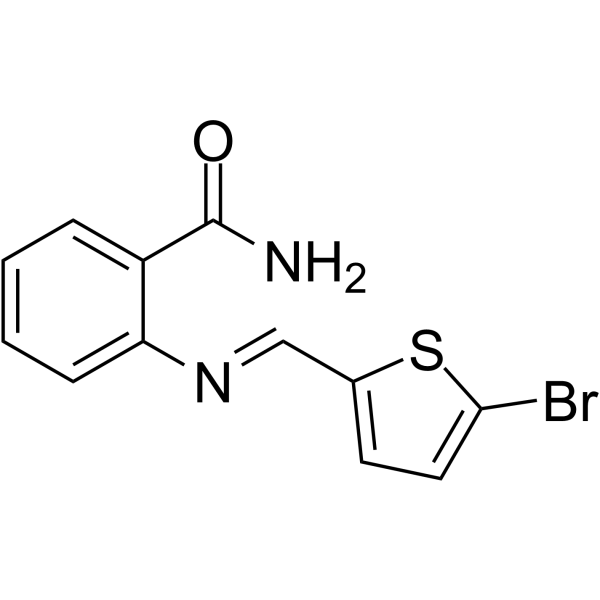
BTYNB
Based on 1 publication(s) in Google Scholar
BTYNB is a structure-specific nucleic acid binder and IGF2BP1 inhibitor (with an IC50 of 5 μM against hBTYNB). BTYNB disrupts the IGF2BP1-RNA interaction and blocks its binding to oncogenic mRNAs such as c-Myc, MDM2, PD-L1. BTYNB completely blocks the INHBA-Smad2/3 pathway, disrupts the MYCN/IGF2BP1 loop, and thereby induces apoptosis and cell cycle arrest, effectively inhibiting the proliferation and survival of cancer cells. In addition, BTYNB acts as an immune activator and tumor microenvironment modulator, enhances T cell-mediated tumor killing, and produces significant synergistic effects with inhibitors of PD-1, BRD and BIRC5. BTYNB can be used in relevant research on various malignant tumors including ovarian cancer, neuroblastoma, leukemia and melanoma.
For research use only. We do not sell to patients.
- Purity : 98.0%
- CAS No.: 304456-62-0
- Formula: C12H9BrN2OS
- Molecular Weight:309.18
-
Storage:
4°C, protect from light
* In solvent : -80°C, 6 months; -20°C, 1 month (protect from light)

To place orders, for customer services and technical support, please contact: MedChemExpress USA
Tel: 609-228-6898 E-mail: [email protected] [email protected]


-
 Biological Activity
-
Chemical Information
-
Solvent & Solubility
- Protocols
- Purity & Documentation
- References
-
 Help & FAQs


-
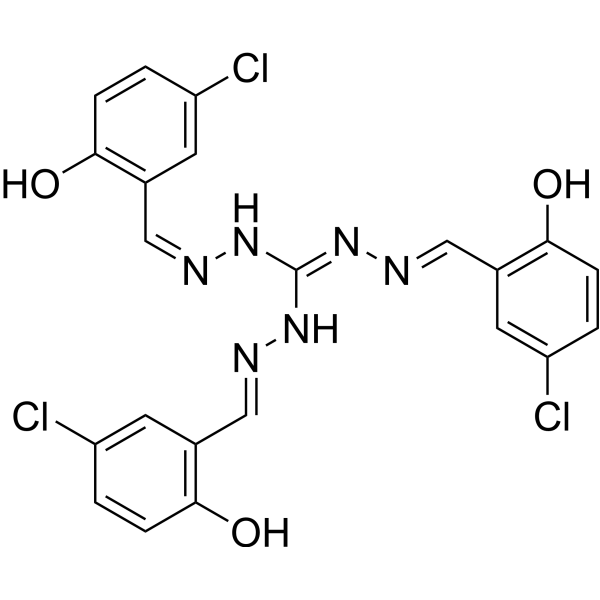
HY-153274
CWI1-2IGF2BP2 Inhibitor -
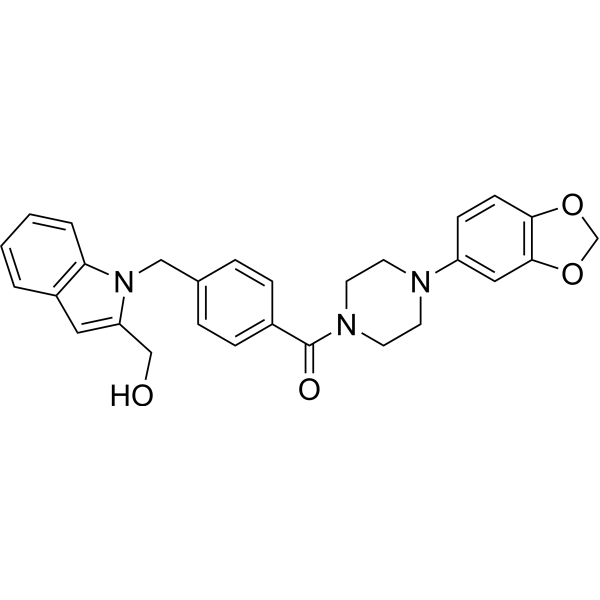
HY-144873
AVJ16IGF2BP1 Inhibitor -
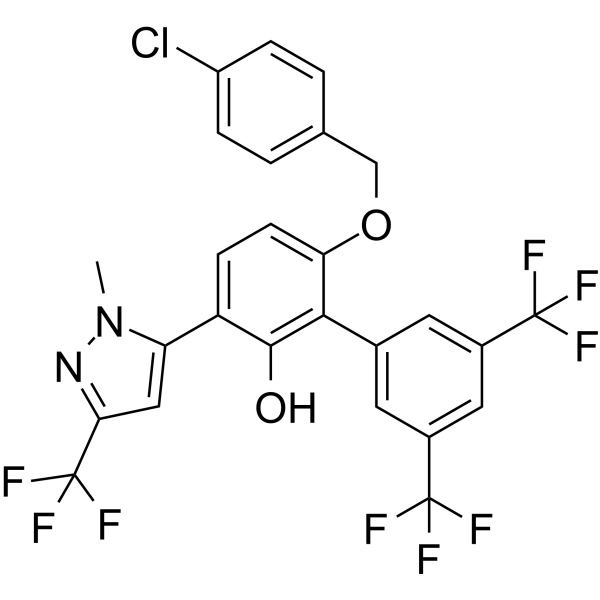
HY-129600
MYCi361c-Myc Inhibitor -
HY-N0416
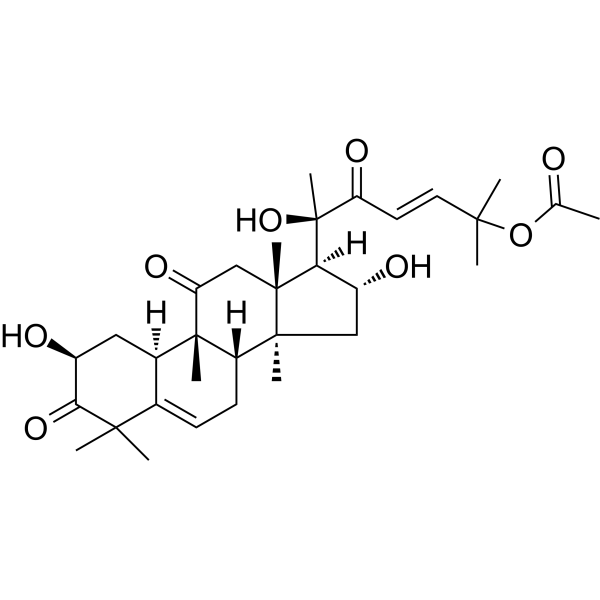
Cucurbitacin BBioactive Tetracyclic Triterpenoid -
HY-12702
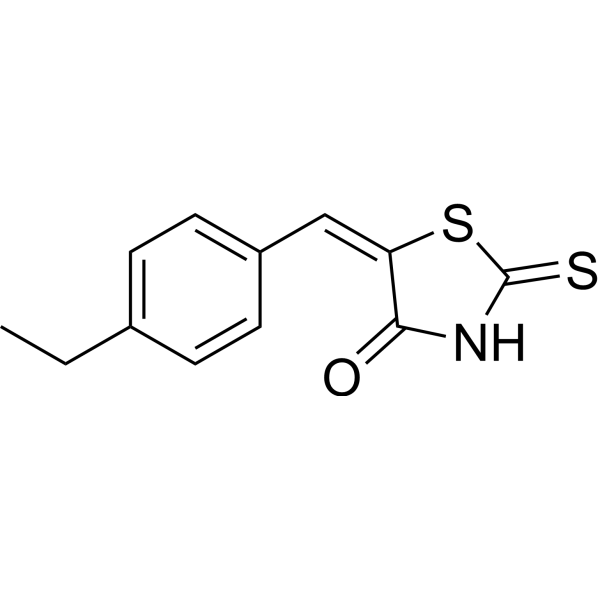
10058-F4c-Myc Inhibitor -
HY-16291
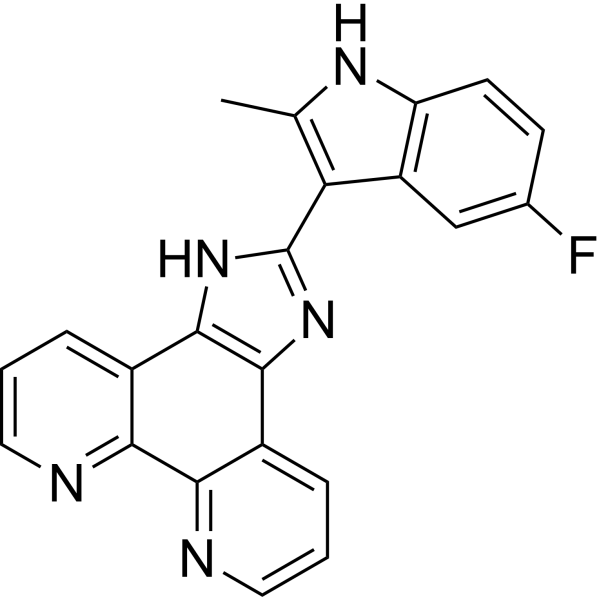
APTO-253 -
HY-100996
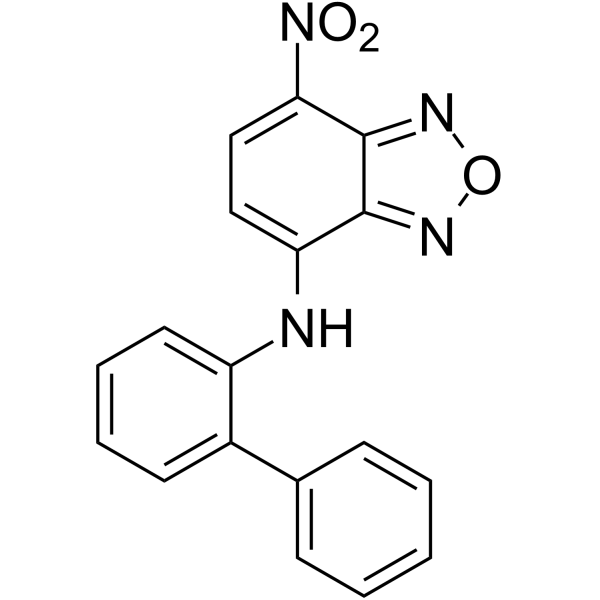
10074-G5c-Myc-Max Inhibitor -
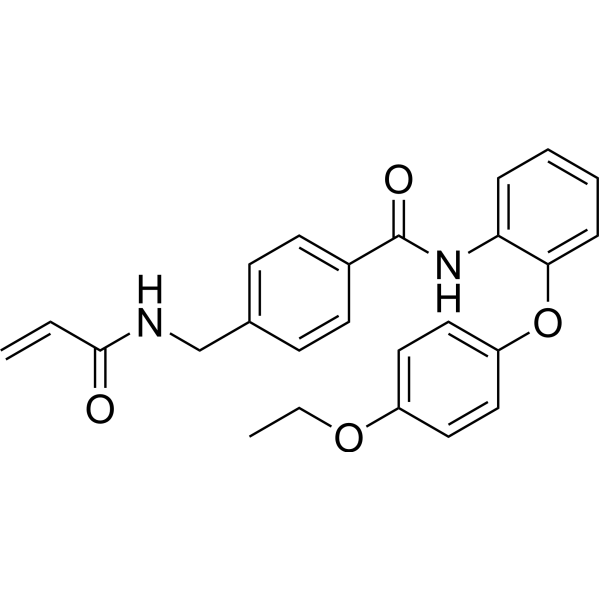
HY-134761
EN4Covalent Ligand of c-MYC -
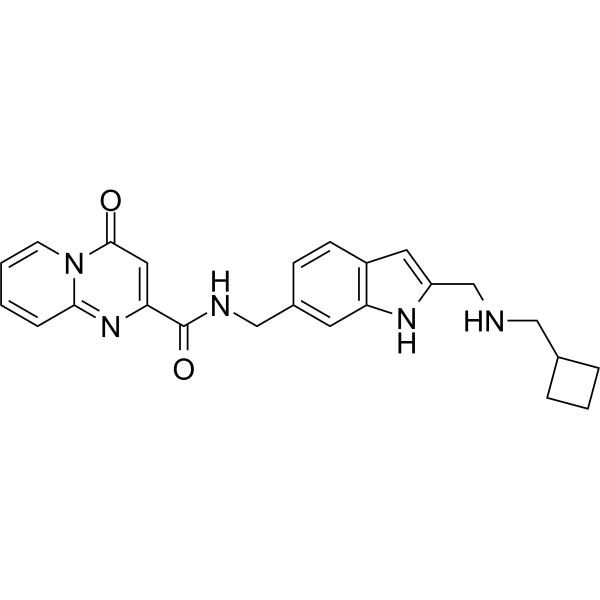
HY-156677
STC-15METTL3 Inhibitor -
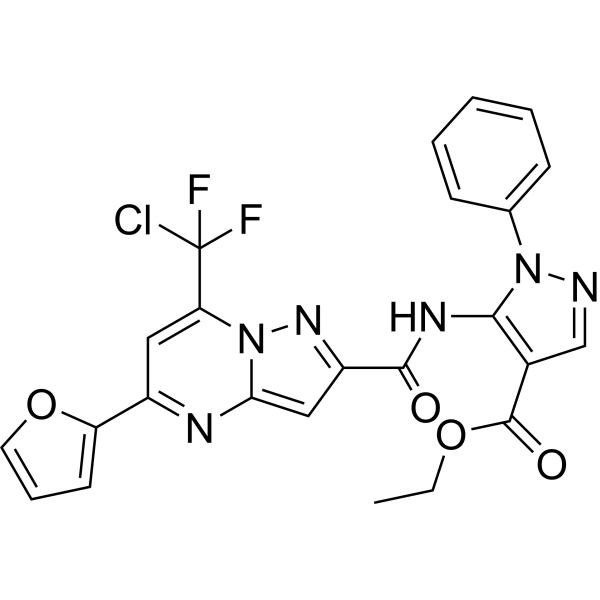
HY-100669
Mycro 3Myc-Max Inhibitor -
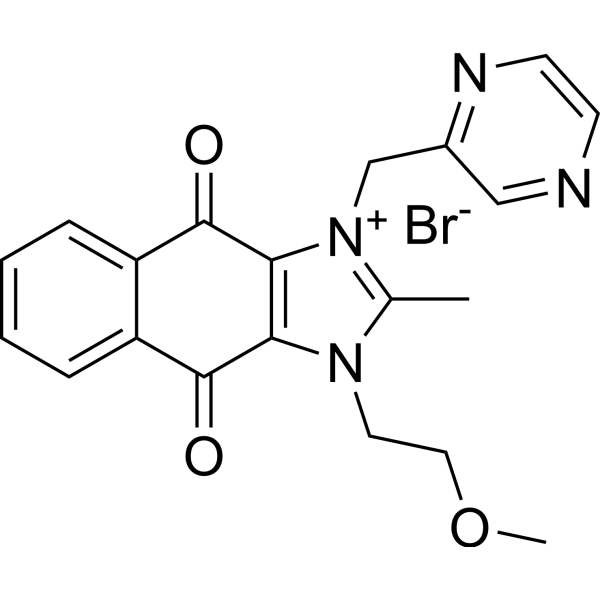
HY-10194
Sepantronium bromideSurvivin Inhibitor -
HY-155489
DDO-2728ALKBH5 Inhibitor
Publications Citing Use of MedChemExpress (MCE) BTYNB
More

Biological Activity
Description
IC50 & Target
IC50: 5 μM (IMP1 c-Myc mRNA internation)[1]
Cellular Effect
|
Cell Line

|
Type | Value | Description | References |
|---|---|---|---|---|
| HL-60 | IC50 |
21.56 μM
Compound: 2; BTYNB
|
Antiproliferative activity against human HL-60 cells assessed as reduction in cell viability incubated for 24 hrs by MTT assay
Antiproliferative activity against human HL-60 cells assessed as reduction in cell viability incubated for 24 hrs by MTT assay
|
[PMID: 38382391] |
| K562 | IC50 |
6.76 μM
Compound: 2; BTYNB
|
Antiproliferative activity against human K562 cells assessed as reduction in cell viability incubated for 24 hrs by MTT assay
Antiproliferative activity against human K562 cells assessed as reduction in cell viability incubated for 24 hrs by MTT assay
|
[PMID: 38382391] |
In Vitro
BTYNB (20 μM; 24-36 h) significantly inhibits the migration and invasion of KYSE30 and TE1 ESCC cells in vitro[2].
BTYNB (10 μM; 48 h) significantly increases apoptosis in KYSE30 and TE1 ESCC cells[2].
BTYNB (0.38-24 µM; 72 h) combined with Mivebresib exhibits strong synergy in reducing BE(2)-C human neuroblastoma cell viability after 72 hours of treatment[3].
BTYNB (7-21 μM; 24 h) induces mild apoptosis in human HL60 and K562 leukemic cells after 24 h of treatment, accompanied by significant upregulation of the pro-apoptotic gene BAK[4].
BTYNB (7-21 μM; 24 h) induces S-phase cell cycle arrest in human K562 leukemic cells (with no effect on HL60 cells) after 24 h of treatment, accompanied by significant upregulation of the cell cycle arrest gene p21 in both cell lines[4].
MedChemExpress (MCE) has not independently confirmed the accuracy of these methods. They are for reference only. Further protocols information, click here.
-
Cell Line:KYSE30, TE1 esophageal squamous cell carcinoma (ESCC) cells
-
Concentration:20 μM
-
Incubation Time:36 h (KYSE30 cells); 24 h (TE1 cells)
-
Result:Reduced the relative cell area covered by invading KYSE30 cells to approximately 30% of control levels.
Reduced the relative cell area covered by migrating KYSE30 cells to approximately 40% of control levels.
Reduced the relative cell area covered by invading TE1 cells to approximately 20% of control levels.
Reduced the relative cell area covered by migrating TE1 cells to approximately 10% of control levels.
In Vivo
MedChemExpress (MCE) has not independently confirmed the accuracy of these methods. They are for reference only.
-
Animal Model:C57BL/6NCrl mice (female, 6 weeks old, intraperitoneal injection of 5 × 10⁶ ID8/Trp53-/- cells)[1]
-
Dosage:40 mg/kg (monotherapy); 40 mg/kg (combination with anti-PD-1 antibody 8 mg/kg)
-
Administration:i.p.; twice weekly
-
Result:Improved median survival by ~30% compared to the control group and by 15% compared to anti-PD-1 monotherapy when combined with anti-PD-1 antibody.
Reduced tumor cell dominance in ascitic fluid to 67% when combined with anti-PD-1 antibody.
Shifted tumor cells to an immune-responsive phenotype when combined with anti-PD-1 antibody.
Increased immune cell accumulation in ascites (with a higher proportion of cytotoxic T cells than BTYNB monotherapy) when combined with anti-PD-1 antibody.


Chemical Information
-
CAS No. 304456-62-0
-
Appearance Solid
-
Molecular Weight 309.18
-
Formula C12H9BrN2OS
-
Color White to light yellow
-
SMILES
O=C(C1=CC=CC=C1/N=C/C2=CC=C(S2)Br)N
-
Shipping
Room temperature in continental US; may vary elsewhere.
-
Storage
4°C, protect from light
* In solvent : -80°C, 6 months; -20°C, 1 month (protect from light)


Publications (1)
-
Journal Impact Factor
-
Most Recent


Solvent & Solubility
In Vitro:
DMSO : 62.5 mg/mL (202.15 mM; Need ultrasonic; Hygroscopic DMSO has a significant impact on the solubility of product, please use newly opened DMSO)
Please refer to the solubility information to select the appropriate solvent. Once prepared, please aliquot and store the solution to prevent product inactivation from repeated freeze-thaw cycles.
Storage method and period of stock solution: -80°C, 6 months; -20°C, 1 month (protect from light). When stored at -80°C, please use it within 6 months. When stored at -20°C, please use it within 1 month.
Please refer to the solubility information to select the appropriate solvent. Once prepared, please aliquot and store the solution to prevent product inactivation from repeated freeze-thaw cycles.
Storage method and period of stock solution: -80°C, 6 months; -20°C, 1 month (protect from light). When stored at -80°C, please use it within 6 months. When stored at -20°C, please use it within 1 month.
Concentration (start) × Volume (start) = Concentration (final) × Volume (final)
In Vivo:
Select the appropriate dissolution method based on your experimental animal and administration route.
- For the following dissolution methods, please ensure to first prepare a clear stock solution using an In Vitro approach and then sequentially add co-solvents:
- To ensure reliable experimental results, the clarified stock solution can be appropriately stored based on storage conditions. As for the working solution for In Vivo experiments, it is recommended to prepare freshly and use it on the same day.
- The percentages shown for the solvents indicate their volumetric ratio in the final prepared solution. If precipitation or phase separation occurs during preparation, heat and/or sonication can be used to aid dissolution.
Add each solvent one by one: 10% DMSO 40% PEG300 5% Tween-80 45% Saline
Solubility: ≥ 2.5 mg/mL (8.09 mM); Clear solution
This protocol yields a clear solution of ≥ 2.5 mg/mL (saturation unknown).
Taking 1 mL working solution as an example, add 100 μL DMSO stock solution (25.0 mg/mL) to 400 μL PEG300, and mix evenly; then add 50 μL Tween-80 and mix evenly; then add 450 μL Saline to adjust the volume to 1 mL.
Preparation of Saline: Dissolve 0.9 g sodium chloride in ddH₂O and dilute to 100 mL to obtain a clear Saline solution.
Add each solvent one by one: 10% DMSO 90% (20% SBE-β-CD in Saline)
Solubility: ≥ 2.5 mg/mL (8.09 mM); Clear solution
This protocol yields a clear solution of ≥ 2.5 mg/mL (saturation unknown).
Taking 1 mL working solution as an example, add 100 μL DMSO stock solution (25.0 mg/mL) to 900 μL 20% SBE-β-CD in Saline, and mix evenly.
Preparation of 20% SBE-β-CD in Saline (4°C, storage for one week): 2 g SBE-β-CD powder is dissolved in 10 mL Saline, completely dissolve until clear.
In Vivo Dissolution Calculator
Please enter the basic information of animal experiments:
-
-
-
-
Recommended: Prepare an additional quantity of animals to account for potential losses during experiments.
Please enter your animal formula composition:
-
%DMSO +
Recommended: Keep the proportion of DMSO in working solution below 2% if your animal is weak.
-
%+
-
+%Tween-80 + +
-
%Saline +
The co-solvents required include: DMSO, . All of co-solvents are available by MedChemExpress (MCE). , Tween 80. All of co-solvents are available by MedChemExpress (MCE).
Working solution concentration: 0.22 mg/mL
Method for preparing stock solution: mg drug dissolved in μL DMSO. Stock solution concentration: mg/mL. * In solvent : -80°C, 6 months; -20°C, 1 month (protect from light)
1. Take μL DMSO stock solution;
2. Add μL .
μL , mix evenly;
3. Then add μL Tween 80, mix evenly;
4. Then add μL
Please ensure that the stock solution in the first step is dissolved to a clear state, and add co-solvents in sequence. You can use ultrasonic heating (ultrasonic cleaner, recommended frequency 20-40 kHz), vortexing, etc. to assist dissolution.

Protocols
-
Multiplex immunofluorescence IHC
Multiplex immunofluorescence IHC detects multiple protein biomarkers in one tissue section by sequential antibody staining, HRP-mediated tyramide fluorophore deposition, heat-mediated antibody stripping, nuclear counterstaining, multispectral imaging, spectral unmixing, and digital cell phenotyping; TSA deposits fluorophore near the antigen so the fluorescence signal remains after primary and secondary antibodies are removed, enabling repeated staining cycles, including with antibodies from the same host species. Classic FFPE tumor immune-profiling applications use panels such as CD3, CD8, CD68/CD163, FOXP3, PD-1, PD-L1, pancytokeratin, Ki67, and DAPI to identify tumor cells, immune-cell subsets, checkpoint-marker expression, co-expression phenotypes, cell density, and spatial relationships in the tumor microenvironment.
-
Apoptosis
Apoptosis, also called programmed cell death, is generally characterized by distinct morphological characteristics.
-
TUNEL staining for apoptotic DNA fragmentation
TUNEL staining detects DNA strand breaks by using terminal deoxynucleotidyl transferase to add labeled nucleotides to exposed 3′-OH DNA termini, generating either microscopic staining in fixed cells or tissue sections, or fluorescence/cytometric signal in cell suspensions. TUNEL positivity reflects DNA fragmentation but should not be interpreted alone as definitive apoptosis, because TUNEL can also label necrotic, autolytic, mechanically damaged, or DNA-repair-associated DNA breaks.
-
Cell Cytotoxicity Assay
Cytotoxicity assays are usually based on the assessment of cell membrane damage, which can also be indirectly detected by measuring cell viability. Detection methods include MTT assay, CKK-8 assay, LDH assay and ATP assay, etc.
-
Flow cytometric DNA-content cell-cycle staining
Flow cytometric DNA-content cell-cycle staining measures the fluorescence intensity of DNA-bound fluorochromes in single cells or nuclei to estimate DNA content distributions, allowing assignment of populations to G0/G1, S, and G2/M phases by DNA histogram deconvolution. Propidium iodide (PI) intercalates into DNA, and PI fluorescence is proportional to cellular DNA content when staining is performed under conditions that make DNA accessible and minimize non-DNA signal. Cells with G2/M DNA content are expected to show approximately twice the fluorescence intensity of G0/G1 cells, while S-phase cells occupy intermediate fluorescence values. PI-based DNA-content analysis can also detect cells with fractional DNA content, often reported as sub-G1, when DNA fragmentation and extraction during staining reduce retained DNA signal in apoptotic cells. DAPI is an alternative DNA fluorochrome for univariate DNA-content analysis, while bivariate approaches combining DNA content with proliferation
-
Annexin V plus membrane-impermeant dye apoptosis staining
Annexin V-based apoptosis assays rely on the detection of phosphatidylserine (PS) externalization from the inner leaflet of the plasma membrane to the outer leaflet, an early biochemical hallmark of apoptosis. Fluorescently labeled Annexin V binds PS in a calcium-dependent manner, enabling identification of early apoptotic cells by flow cytometry or fluorescence microscopy. When combined with a membrane-impermeant DNA-binding dye (e. g. , propidium iodide), this approach allows discrimination between viable (Annexin V−/dye−), early apoptotic (Annexin V+/dye−), and late apoptotic or necrotic (Annexin V+/dye+) cell populations by assessing membrane integrity and PS exposure.
-
BrdU Incorporation Assay
Bromodeoxyuridine (BrdU) incorporation assay is based on the principle that BrdU, a thymidine analog, is incorporated into newly synthesized DNA during the S phase of the cell cycle, thereby serving as a marker of DNA replication and cellular proliferation. Incorporated BrdU can be detected using anti-BrdU antibodies following DNA denaturation, enabling visualization or quantification of proliferating cells through immunochemical detection methods such as immunofluorescence or immunohistochemistry.
-
Multiplex immunohistochemistry
Multiplex immunohistochemistry (mIHC), also known as tyramide dignal amplification (TSA), is an enzymatic detection method that uses horseradish peroxidase (HRP) to perform high-density in-situ labeling of target proteins or nucleic acids.
-
Apoptosis Solutions
Apoptosis is a regulated, generally non-lytic cell-death pathway that removes unwanted, damaged, infected, or abnormal cells through coordinated morphological changes, caspase activation, DNA fragmentation, and membrane remodeling. The intrinsic apoptosis pathway is controlled mainly by mitochondrial outer membrane permeabilization, BCL-2 family proteins, cytochrome c release, apoptosome formation, caspase-9 activation, and downstream executioner caspase-3/7 activation. The extrinsic apoptosis pathway is initiated by death receptors such as Fas, TNFR, and TRAIL receptors, which recruit adaptor proteins and activate caspase-8 before engaging executioner caspases or mitochondrial amplification through BID cleavage. Apoptosis is linked to many phenotypes, including cancer cell killing, tissue homeostasis, immune regulation, neurodegeneration, infection response, and treatment-induced cytotoxicity; unresolved questions include how apoptosis interacts with necroptosis, pyroptosis, ferroptos
-
Protocol for Cell Cycle
Cell-cycle analysis by flow cytometry measures DNA content in single cells to estimate the fraction of cells in G0/G1, S, and G2/M phases. Propidium iodide intercalates into DNA, and after RNA removal with RNase, fluorescence intensity reflects cellular DNA content: 2N cells are assigned to G0/G1, cells between 2N and 4N to S phase, and 4N cells to G2/M. DNA-content analysis alone cannot reliably separate G0 from G1 or G2 from M. Ki-67 can distinguish quiescent G0 cells from cycling cells, EdU or BrdU incorporation marks active DNA synthesis in S phase, and phospho-histone H3 staining identifies mitotic cells within the 4N population.
-
Research Protocol for Cancer Immunology
Cancer immunology studies how the immune system recognizes, suppresses, edits, or fails to eliminate malignant cells through tumor antigen release, antigen presentation, T-cell priming, immune trafficking, tumor-cell killing, and feedback inhibition in the tumor microenvironment. The cancer-immunity cycle links tumor antigenicity, dendritic-cell priming, CD8+ T-cell infiltration, cytotoxic function, and immune-checkpoint regulation to tumor rejection or immune escape. Immune-checkpoint pathways such as PD-1/PD-L1 and CTLA-4 suppress antitumor T-cell activity and can be therapeutically blocked, but many tumors remain resistant because of poor antigen presentation, weak T-cell infiltration, suppressive myeloid cells, regulatory T cells, and tumor-intrinsic immune-exclusion programs. Unresolved questions include which immune-cell states predict response, how tumor-intrinsic pathways exclude immune cells, how myeloid suppression limits checkpoint blockade, and which combination strategies
-
Cell Viability Determination by MTT Colorimetric Assay
The following protocol uses the MTT colorimetric assay as a classic literature-established method for assessing cell viability/metabolic activity in cultured mammalian cells. MTT[3-(4,5-dimethylthiazol-2-yl)-2,5-diphenyltetrazolium bromide] is reduced by metabolically active cells to a colored formazan product; the amount of formazan is quantified spectrophotometrically and provides an indirect measure of metabolically active viable cells. Importantly, MTT reduction reflects cellular oxidoreductase/metabolic activity rather than an absolute direct count of living cells, so changes in cellular metabolism can alter the signal independently of cell number.


Purity & Documentation
-
Data Sheet (281 KB)
-
SDS (393 KB)
- English - EN (393 KB)
- Français - FR (393 KB)
- Deutsch - DE (393 KB)
- Norwegian - NO (393 KB)
- Español - ES (393 KB)
- Swedish - SV (393 KB)
- Italian - IT (393 KB)
- Korean - KR (393 KB)
- Portuguese - PT (393 KB)
-
Handling Instructions (2659 KB)
References
[1]. Bley N, et al. Inhibition of RNA-binding proteins enhances immunotherapy in ovarian cancer. Signal Transduct Target Ther. 2025;10(1):419. Published 2025 Dec 25. [Content Brief]
[4]. Jamal A, et al. BTYNB, an inhibitor of RNA binding protein IGF2BP1 reduces proliferation and induces differentiation of leukemic cancer cells. Saudi J Biol Sci. 2023;30(3):103569. [Content Brief]
[5]. Mahapatra L, et al. A Novel IMP1 Inhibitor, BTYNB, Targets c-Myc and Inhibits Melanoma and Ovarian Cancer Cell Proliferation. Transl Oncol. 2017;10(5):818-827. [Content Brief]


Complete Stock Solution Preparation Table
Please refer to the solubility information to select the appropriate solvent. Once prepared, please aliquot and store the solution to prevent product inactivation from repeated freeze-thaw cycles.
Storage method and period of stock solution: -80°C, 6 months; -20°C, 1 month (protect from light). When stored at -80°C, please use it within 6 months. When stored at -20°C, please use it within 1 month.
| Optional Solvent | Concentration Solvent Mass | 1 mg | 5 mg | 10 mg | 25 mg |
|---|---|---|---|---|---|
| DMSO | 1 mM | 3.2344 mL | 16.1718 mL | 32.3436 mL | 80.8590 mL |
| 5 mM | 0.6469 mL | 3.2344 mL | 6.4687 mL | 16.1718 mL | |
| 10 mM | 0.3234 mL | 1.6172 mL | 3.2344 mL | 8.0859 mL | |
| 15 mM | 0.2156 mL | 1.0781 mL | 2.1562 mL | 5.3906 mL | |
| 20 mM | 0.1617 mL | 0.8086 mL | 1.6172 mL | 4.0430 mL | |
| 25 mM | 0.1294 mL | 0.6469 mL | 1.2937 mL | 3.2344 mL | |
| 30 mM | 0.1078 mL | 0.5391 mL | 1.0781 mL | 2.6953 mL | |
| 40 mM | 0.0809 mL | 0.4043 mL | 0.8086 mL | 2.0215 mL | |
| 50 mM | 0.0647 mL | 0.3234 mL | 0.6469 mL | 1.6172 mL | |
| 60 mM | 0.0539 mL | 0.2695 mL | 0.5391 mL | 1.3477 mL | |
| 80 mM | 0.0404 mL | 0.2021 mL | 0.4043 mL | 1.0107 mL | |
| 100 mM | 0.0323 mL | 0.1617 mL | 0.3234 mL | 0.8086 mL |


BTYNB Related Classifications
HY-124447 Related Classifications
 Powered by Bioz