



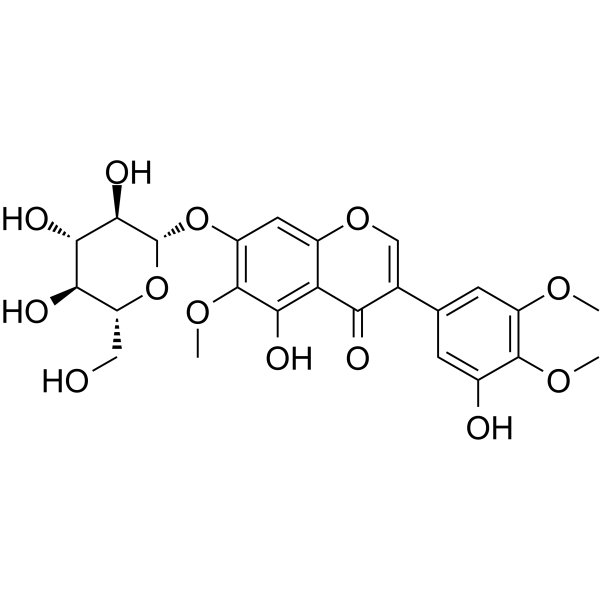
Iridin

Based on 1 Customer Validation
Iridin is an orally active natural isoflavone. Iridin inhibits the PI3K/AKT and PKM2 signaling pathways, and downregulates the JAK/STAT and NF-κB pathways. Iridin induces Fas-mediated extrinsic apoptosis, G2/M cell cycle arrest, and inhibits cell proliferation. Iridin reduces inflammation, inhibits ROS production, suppresses glycolysis, and also exhibits antioxidant and antidiabetic activities. Iridin can be used in research related to gastric cancer and acute lung injury.
Nur für Forschungszwecke. Wir verkaufen nicht an Patienten.
- Reinheit : 99.72%
- CAS. Nr.: 491-74-7
- Formel: C24H26O13
- Molecular Weight:522.46
-
Speicherung:
4°C, sealed storage, away from moisture and light
* In solvent : -80°C, 6 months; -20°C, 1 month (sealed storage, away from moisture and light)

To place orders, for customer services and technical support, please contact: MedChemExpress USA
Tel: 609-228-6898 E-mail: [email protected] [email protected]


-
 Biologische Aktivität
-
Chemical Information
-
Lösungsmittel & Löslichkeit
- Protokoll
- Reinheit & Dokumentation
- Verweise
-
 Help & FAQs




Biologische Aktivität
Beschreibung
In Vitro
Iridin (12.5-200 μM) induces apoptosis via the extrinsic pathway and regulates the PI3K/AKT signaling pathway in AGS gastric cancer cells, HaCaT cells, and TRAIL-resistant gastric cancer cells[1].
Iridin (12.5-50 μM; 18 h) inhibits the production of proinflammatory mediators in LPS (HY-D1056)-stimulated RAW 264.7 cells in a dose-dependent manner[1].
Iridin (10 nM-100 μM) exerts no anticancer effects on MCF-7 and T-47D breast cancer cells[1].
Iridin (12.5-200 μM; 48 h) inhibits the proliferation and induces the death of human gastric cancer AGS cells, with an IC50 of 161.3 μM; whereas it exerts no significant effect on the cell viability of human keratinocyte HaCaT cells after 48 h of treatment[2].
Iridin (50-200 μM; 48 h) induces G2/M cell cycle arrest in human gastric cancer AGS cells after 48 h of treatment by downregulating the expression of cell cycle regulatory proteins Cdc25C, CDK1, and Cyclin B1[2].
Iridin (50-200 μM; 48 h) induces apoptotic cell death in human gastric cancer AGS cells via the extrinsic apoptotic pathway[2].
Iridin (50-200 μM; 48 h) inhibits the PI3K/AKT signaling pathway in human gastric cancer AGS cells by downregulating the phosphorylated (active) forms of PI3K and AKT, without affecting the expression of total PI3K or AKT[2].
Iridin (6.25-200 μM; 24 h) shows no cytotoxicity against RAW264.7 cells even at concentrations up to 100 μM. Based on its anti-inflammatory efficacy, concentrations of 12.5, 25 and 50 μM are selected for subsequent studies[3].
Iridin (12.5-50 μM; 18 h) reverses LPS-induced Warburg effect in RAW264.7 cells in a dose-dependent manner by enhancing oxidative phosphorylation and reducing glycolytic activity[3].
Iridin (12.5-50 μM; 18 h) dose-dependently inhibits LPS-induced production of NO, TNF-α, IL-1β and MCP-1 in RAW264.7 cells[3].
Iridin (12.5-50 μM; 18 h) dose-dependently abrogates LPS-induced accumulation of ROS and NO in RAW264.7 cells[3].
Iridin (12.5-50 μM; 18 h) dose-dependently inhibits LPS-induced excessive phagocytic activity in RAW264.7 cells[3].
Iridin (12.5-50 μM; 18 h) dose-dependently downregulates the expression of PKM2 and its downstream JAK/STAT and NF-κB pathway proteins in LPS-stimulated RAW264.7 cells, and this effect is reversed by PKM2 activation or ROS scavenging[3].
MedChemExpress (MCE) has not independently confirmed the accuracy of these methods. They are for reference only.
-
Cell Line:human gastric cancer AGS cells, human keratinocyte HaCaT cells
-
Concentration:12.5, 25, 50, 100 and 200 μM
-
Incubation Time:48 h
-
Result:Caused a concentration-dependent reduction in AGS cell viability, with an IC50 of 161.3 μM.
Did not significantly affect HaCaT cell viability at any tested concentration.
Induced morphological changes in AGS cells including floating dead cells, cell shrinkage, and reduced cell numbers.
-
Cell Line:human gastric cancer AGS cells
-
Concentration:50, 100 and 200 μM
-
Incubation Time:48 h
-
Result:Caused a concentration-dependent increase in the percentage of AGS cells arrested in the G2/M phase, accompanied by reduced percentages of cells in the G0/G1 phase.
Downregulated Cdc25C, CDK1, and Cyclin B1 protein expression in a concentration-dependent manner compared to untreated controls.
-
Cell Line:human gastric cancer AGS cells
-
Concentration:50, 100 and 200 μM
-
Incubation Time:48 h
-
Result:Caused a concentration-dependent increase in the apoptotic cell fraction (early apoptosis) in AGS cells, with apoptotic cell percentages rising significantly at 50, 100, and 200 μM.
Upregulated cleaved Caspase-3 and cleaved PARP protein expression in a concentration-dependent manner, along with downregulation of full-length Caspase-3 and PARP.
-
Cell Line:human gastric cancer AGS cells
-
Concentration:50, 100 and 200 μM
-
Incubation Time:48 h
-
Result:Upregulated Fas and FasL protein expression in a concentration-dependent manner.
Downregulated full-length Caspase-8 and upregulated cleaved Caspase-8 in a concentration-dependent manner.
Caused no significant changes in the expression levels of Bcl-xL, Bax, Caspase-9, or cleaved Caspase-9 compared to untreated controls.\nDownregulated p-PI3K and p-AKT protein expression in a concentration-dependent manner.
Caused no changes in the expression levels of total PI3K and total AKT compared to untreated controls.
-
Cell Line:murine macrophage RAW264.7 cells
-
Concentration:6.25, 12.5, 25, 50, 100, 150, 200 μM
-
Incubation Time:24 h
-
Result:Did not affect RAW264.7 cell proliferation at concentrations ≤100 μM, with no significant difference in cell viability between control, Iridin-only, and LPS+Iridin groups (P>0.05).
Selected concentrations of 12.5, 25, and 50 μM for subsequent experiments based on an IC50 of 24.8 μM for LPS-induced NO release.
-
Cell Line:LPS-stimulated murine macrophage RAW264.7 cells
-
Concentration:12.5, 25, 50 μM
-
Incubation Time:2 h pre-incubation, followed by 16 h LPS stimulation
-
Result:Dose-dependently reduced the expression of PKM2, p-JAK1, p-STAT1, p-STAT3, p-p65, iNOS, and COX2 proteins.
Inhibitory effects were fully reversed by PKM2 agonist DASA-58 or antioxidant NAC, and partially reversed by NF-κB activator CUT129 or JAK1 activator RO8191.
In Vivo
MedChemExpress (MCE) has not independently confirmed the accuracy of these methods. They are for reference only.
-
Animal Model:ICR (male, 24 g body weight, LPS-induced acute lung injury model)[3]
-
Dosage:20 mg/kg; 40 mg/kg; 80 mg/kg
-
Administration:p.o.; once daily; 5 days
-
Result:Dose-dependently reduced lung pathologic scores, lung index, total cell count, and neutrophil count in bronchoalveolar lavage fluid compared to the LPS-challenged model group.
Dose-dependently decreased serum levels of iNOS and TNF-α, and increased serum levels of IL-10 compared to the LPS-challenged model group.
Dose-dependently reduced mRNA expressions of M1 macrophage markers iNOS and TNF-α, and increased mRNA expressions of M2 macrophage markers IL-10 and Arg-1 in lung tissue macrophages compared to the LPS-challenged model group.
Dose-dependently downregulated protein expressions of PKM2, p-JAK1, p-STAT1, p-STAT3, p-p65, iNOS, and COX2 in lung tissues compared to the LPS-challenged model group.
- Annexin V plus membrane-impermeant dye apoptosis staining
- BrdU Incorporation Assay
- ROS/oxidative-stress fluorescent staining
- Somatic Cell Culture
- CFSE Dye Dilution Proliferation Assay
- Dye-dilution cell tracking and proliferation staining
- Protocol for Cell Cycle
- CCK-8/WST-8 Cell Proliferation Assay
- Research Protocol for Inflammation-related Diseases
- Cell Counting-Based Growth Curve Assay
- Colony Formation (Clonogenic) Assay
- Cell Viability Determination by MTT Colorimetric Assay
- EdU Incorporation Assay (Click Chemistry-Based DNA Synthesis Measurement)
- Detection of Apoptosis
- TUNEL staining for apoptotic DNA fragmentation
- Ki-67 Immunostaining Proliferation Assay
- Flow cytometric DNA-content cell-cycle staining
- PCNA Immunodetection Proliferation Assay
- Protocol for Cell Counting and Cell Density Analysis
- Apoptosis Solutions
- MTT Cell Proliferation Assay
- Inhalation Toxicity Study


Chemical Information
-
CAS. Nr. 491-74-7
-
Appearance Solid
-
Molecular Weight 522.46
-
Formel C24H26O13
-
Color White to off-white
-
SMILES
O=C1C2=C(O)C(OC)=C(O[C@@H]3O[C@@H]([C@@H](O)[C@H](O)[C@H]3O)CO)C=C2OC=C1C4=CC(OC)=C(OC)C(O)=C4
-
Structure Classification
-
Initial Source
-
Versand
Room temperature in continental US; may vary elsewhere.
-
Speicherung
4°C, sealed storage, away from moisture and light
* In solvent : -80°C, 6 months; -20°C, 1 month (sealed storage, away from moisture and light)


Lösungsmittel & Löslichkeit
In Vitro:
DMSO : 100 mg/mL (191.40 mM; Need ultrasonic; Hygroscopic DMSO has a significant impact on the solubility of product, please use newly opened DMSO)
Please refer to the solubility information to select the appropriate solvent. Once prepared, please aliquot and store the solution to prevent product inactivation from repeated freeze-thaw cycles.
Storage method and period of stock solution: -80°C, 6 months; -20°C, 1 month (sealed storage, away from moisture and light). When stored at -80°C, please use it within 6 months. When stored at -20°C, please use it within 1 month.
Please refer to the solubility information to select the appropriate solvent. Once prepared, please aliquot and store the solution to prevent product inactivation from repeated freeze-thaw cycles.
Storage method and period of stock solution: -80°C, 6 months; -20°C, 1 month (sealed storage, away from moisture and light). When stored at -80°C, please use it within 6 months. When stored at -20°C, please use it within 1 month.
Konzentration (Stammlösung) × Volumen (Stammlösung) = Konzentration (Ziellösung) × Volumen (Ziellösung)
In Vivo:
Select the appropriate dissolution method based on your experimental animal and administration route.
- For the following dissolution methods, please ensure to first prepare a clear stock solution using an In Vitro approach and then sequentially add co-solvents:
- To ensure reliable experimental results, the clarified stock solution can be appropriately stored based on storage conditions. As for the working solution for In Vivo experiments, it is recommended to prepare freshly and use it on the same day.
- The percentages shown for the solvents indicate their volumetric ratio in the final prepared solution. If precipitation or phase separation occurs during preparation, heat and/or sonication can be used to aid dissolution.
Add each solvent one by one: 10% DMSO 40% PEG300 5% Tween-80 45% Saline
Solubility: ≥ 2.5 mg/mL (4.79 mM); Clear solution
This protocol yields a clear solution of ≥ 2.5 mg/mL (saturation unknown).
Taking 1 mL working solution as an example, add 100 μL DMSO stock solution (25.0 mg/mL) to 400 μL PEG300, and mix evenly; then add 50 μL Tween-80 and mix evenly; then add 450 μL Saline to adjust the volume to 1 mL.
Preparation of Saline: Dissolve 0.9 g sodium chloride in ddH₂O and dilute to 100 mL to obtain a clear Saline solution.
Add each solvent one by one: 10% DMSO 90% (20% SBE-β-CD in Saline)
Solubility: ≥ 2.5 mg/mL (4.79 mM); Clear solution
This protocol yields a clear solution of ≥ 2.5 mg/mL (saturation unknown).
Taking 1 mL working solution as an example, add 100 μL DMSO stock solution (25.0 mg/mL) to 900 μL 20% SBE-β-CD in Saline, and mix evenly.
Preparation of 20% SBE-β-CD in Saline (4°C, storage for one week): 2 g SBE-β-CD powder is dissolved in 10 mL Saline, completely dissolve until clear.
In Vivo Dissolution Calculator
Please enter the basic information of animal experiments:
-
-
-
-
Recommended: Prepare an additional quantity of animals to account for potential losses during experiments.
Please enter your animal formula composition:
-
%DMSO +
Recommended: Keep the proportion of DMSO in working solution below 2% if your animal is weak.
-
%+
-
+%Tween-80 + +
-
%Saline +
The co-solvents required include: DMSO, . All of co-solvents are available by MedChemExpress (MCE). , Tween 80. All of co-solvents are available by MedChemExpress (MCE).
Working solution concentration: 0.22 mg/mL
Method for preparing stock solution: mg drug dissolved in μL DMSO. Stock solution concentration: mg/mL. * In solvent : -80°C, 6 months; -20°C, 1 month (sealed storage, away from moisture and light)
1. Take μL DMSO stock solution;
2. Add μL .
μL , mix evenly;
3. Then add μL Tween 80, mix evenly;
4. Then add μL
Please ensure that the stock solution in the first step is dissolved to a clear state, and add co-solvents in sequence. You can use ultrasonic heating (ultrasonic cleaner, recommended frequency 20-40 kHz), vortexing, etc. to assist dissolution.


Reinheit & Dokumentation
-
Data Sheet (287 KB)
-
SDS (252 KB)
- English - EN (252 KB)
- Français - FR (252 KB)
- Deutsch - DE (252 KB)
- Norwegian - NO (252 KB)
- Español - ES (252 KB)
- Swedish - SV (252 KB)
- Italian - IT (252 KB)
- Korean - KR (252 KB)
- Portuguese - PT (252 KB)
-
Handling Instructions (2659 KB)
Verweise
[1]. Won Y, et al. The Effects of Iridin and Irigenin on Cancer: Comparison with Well-Known Isoflavones in Breast, Prostate, and Gastric Cancers. Int J Mol Sci. 2025;26(6):2390. Published 2025 Mar 7. [Content Brief]
[2]. Bhosale PB, et al. Iridin Induces G2/M Phase Cell Cycle Arrest and Extrinsic Apoptotic Cell Death through PI3K/AKT Signaling Pathway in AGS Gastric Cancer Cells. Molecules. 2021;26(9):2802. Published 2021 May 10. [Content Brief]
[3]. Ying ZH, et al. Iridin Prevented Against Lipopolysaccharide-Induced Inflammatory Responses of Macrophages via Inactivation of PKM2-Mediated Glycolytic Pathways. J Inflamm Res. 2021;14:341-354. Published 2021 Feb 5. [Content Brief]


Complete Stock Solution Preparation Table
Please refer to the solubility information to select the appropriate solvent. Once prepared, please aliquot and store the solution to prevent product inactivation from repeated freeze-thaw cycles.
Storage method and period of stock solution: -80°C, 6 months; -20°C, 1 month (sealed storage, away from moisture and light). When stored at -80°C, please use it within 6 months. When stored at -20°C, please use it within 1 month.
| Optional Solvent | Concentration Solvent Mass | 1 mg | 5 mg | 10 mg | 25 mg |
|---|---|---|---|---|---|
| DMSO | 1 mM | 1.9140 mL | 9.5701 mL | 19.1402 mL | 47.8506 mL |
| 5 mM | 0.3828 mL | 1.9140 mL | 3.8280 mL | 9.5701 mL | |
| 10 mM | 0.1914 mL | 0.9570 mL | 1.9140 mL | 4.7851 mL | |
| 15 mM | 0.1276 mL | 0.6380 mL | 1.2760 mL | 3.1900 mL | |
| 20 mM | 0.0957 mL | 0.4785 mL | 0.9570 mL | 2.3925 mL | |
| 25 mM | 0.0766 mL | 0.3828 mL | 0.7656 mL | 1.9140 mL | |
| 30 mM | 0.0638 mL | 0.3190 mL | 0.6380 mL | 1.5950 mL | |
| 40 mM | 0.0479 mL | 0.2393 mL | 0.4785 mL | 1.1963 mL | |
| 50 mM | 0.0383 mL | 0.1914 mL | 0.3828 mL | 0.9570 mL | |
| 60 mM | 0.0319 mL | 0.1595 mL | 0.3190 mL | 0.7975 mL | |
| 80 mM | 0.0239 mL | 0.1196 mL | 0.2393 mL | 0.5981 mL | |
| 100 mM | 0.0191 mL | 0.0957 mL | 0.1914 mL | 0.4785 mL |


Iridin Related Classifications
HY-N3011 Related Classifications
 Powered by Bioz
Keywords
- Iridin
- 491-74-7
- PI3K
- Akt
- Pyruvate Kinase
- JAK
- STAT
- NF-κB
- Apoptosis
- Reactive Oxygen Species (ROS)
- gastric cancer
- NF-κB signaling pathway
- AGS gastric cancer cells
- HaCaT cells
- Fas-mediated extrinsic apoptosis
- JAK/STAT signaling pathway
- PKM2
- acute lung injury
- RAW 264.7 cells
- PI3K/AKT signaling pathway
- Inhibitor
- inhibitor
- inhibit